Cash of $410.7 million at December 31, 2025
- 75% INCREASE IN ADJUSTED EPS
- Net earnings $65.3M or $0.08/share, with adjusted net earnings1 of $113.5M or $0.14/share versus $61.1M or $0.08/share in Q3 2025
- 6% GROWTH IN GOLD PRODUCTION
- 66,718 oz produced versus 63,154 oz in Q3 2025
- 12% IMPROVEMENT IN OPERATING CASH COSTS
- Operating cash costs1 of $1,185/oz sold compared to $1,339/oz in Q3 2025
- AISC REFLECTS HIGHER SUSTAINING CAPITAL1
- AISC/oz1,2 averaged $2,034; Site-level AISC/oz3 averaged $1,824
- INVESTING TO IMPROVE AND GROW PORCUPINE
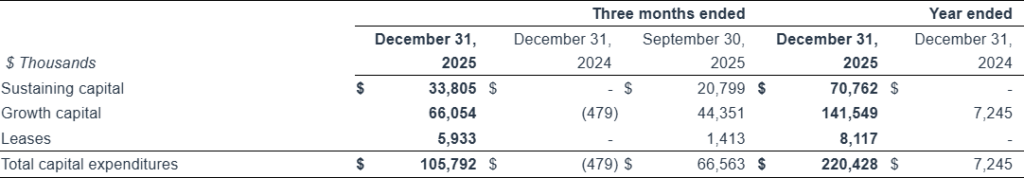
- Sustaining capital expenditures1 of $33.8M, with growth capital expenditures1 of $66.1M versus $20.8M and $44.4M, respectively, in Q3 2025
- STRONG CASH FLOW FROM GOLD SALES
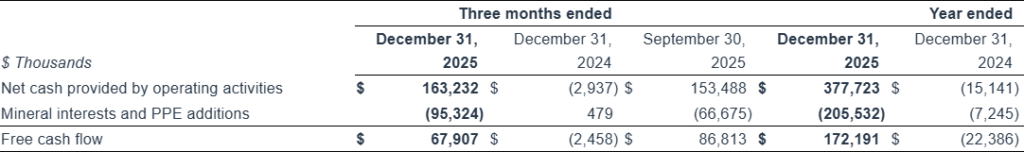
- Net cash from operating activities of $163.2M; Free cash flow1 of $67.9M
- 20% GROWTH IN CASH POSITION
- Cash at December 31, 2025, of $410.7M, with $250M of liquidity from an undrawn revolving credit facility and $100M accordion feature
- EXPLORATION SUCCESS AT ALL TARGETS
- Excellent drill results from resource conversion and expansion drilling at Hoyle Pond, Borden and Pamour, continued success at Owl Creek, and encourage initial results from Dome, TVZ and Broulan Pit
- 2026 GUIDANCE INCLUDES SOLID PRODUCTION GROWTH, INVESTMENTS FOR THE FUTURE
- 2026 guidance includes back half weighted production of 260 – 300 koz; operating cash costs/oz of $1,250 – $1,400, AISC/oz of $1,950 – $2,250; front half weighted sustaining capital expenditures of $120M – $165M and growth capital expenditures of $195M – $235M
- Example of Non-GAAP measure. See the section in this press release entitled, “NON-GAAP MEASURES” for more information.
- Refers to all-in sustaining costs per ounce sold.
- Site-level AISC includes corporate G&A allocation and excludes remaining corporate G&A, share-based compensation costs and corporate-level sustaining capital expenditures.
TORONTO, Feb. 19, 2026 (GLOBE NEWSWIRE) — Discovery Silver Corp. (TSX: DSV, OTCQX: DSVSF) (“Discovery” or the “Company”) today announced the Company’s financial and operating results for the fourth quarter (“Q4 2025”) and full year of 2025 (“FY 2025”). Discovery began reporting the results of gold production and sales following the Company’s acquisition (“Acquisition” or “Porcupine Acquisition”) of the Porcupine Complex (“Porcupine”) in and near Timmins, Ontario on April 15, 2025. The Company’s full financial statements and management discussion & analysis are available on SEDAR+ at www.sedarplus.ca and on the Company’s website at www.discoverysilver.com. All dollar amounts are in US dollars, unless otherwise noted.
Tony Makuch, Discovery’s CEO, commented: “We have built considerable momentum since acquiring Porcupine last April, with production in Q4 2025 totaling 66,718 ounces and operating cash costs improving to $1,185/oz. AISC has remained relatively unchanged as we have increased sustaining capital expenditures to provide needed investment for the Porcupine operations to achieve their full value potential. Our solid operating performance, in combination with higher gold prices, has resulted in improved profitability and substantial cash flow generation. We ended 2025 with a very strong financial position, with cash totaling $410.7 million and no debt.
“Another key area of accomplishment has been exploration. Last week, we reported excellent drilling results across our key Porcupine targets, including additional high-grade intersections from resource conversion and extension drilling at Hoyle Pond, Borden and Pamour; district drilling success at Owl Creek, as well as at the new Broulan target near Pamour; and very encouraging initial drilling results from our two key near-term growth projects, Dome and TVZ.
“Looking ahead, we issued our 2026 guidance today with our Q4 2025 results. The guidance includes significant production growth, reflecting higher output at Hoyle Pond and Borden, as well as increased production from open pit sources, including both Pamour and Hollinger, where we are currently resuming operations. Unit costs will be near the top of the target ranges in the first half of the year and improve significantly over the final six months as production levels increase, sustaining capital declines and we benefit from our investments in equipment, development and infrastructure at our operations. We will also be investing $55 – $75 million in exploration, which is a direct result of the success we are achieving and the tremendous upside we see at all our Porcupine operations and projects.”
SUMMARY OF Q4 AND FY 2025 PERFORMANCE
(1) The difference between ounces produced and ounces sold largely reflects the delivery of in-kind ounces under the Franco-Nevada royalty arrangement.
(2) Example of Non-GAAP measure. See the section in this press release entitled, “NON-GAAP MEASURES” for more information.
(3) 2025 results exclude G&A expense, share-based compensation costs and sustaining capital expenditures and lease expense incurred prior to April 15, 2025, the completion date of the Porcupine Acquisition.
Q4 2025
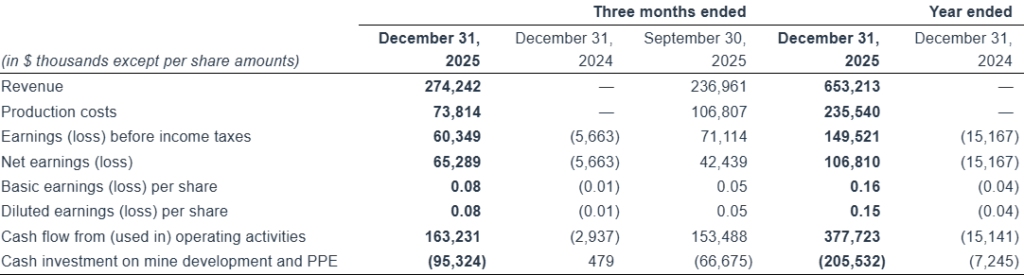
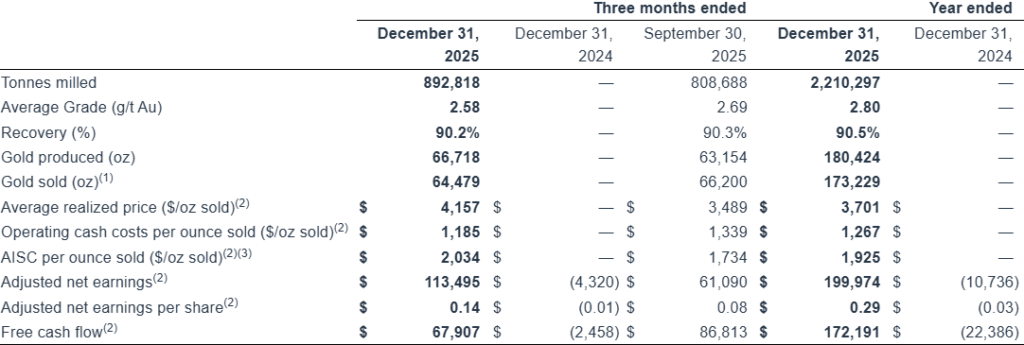
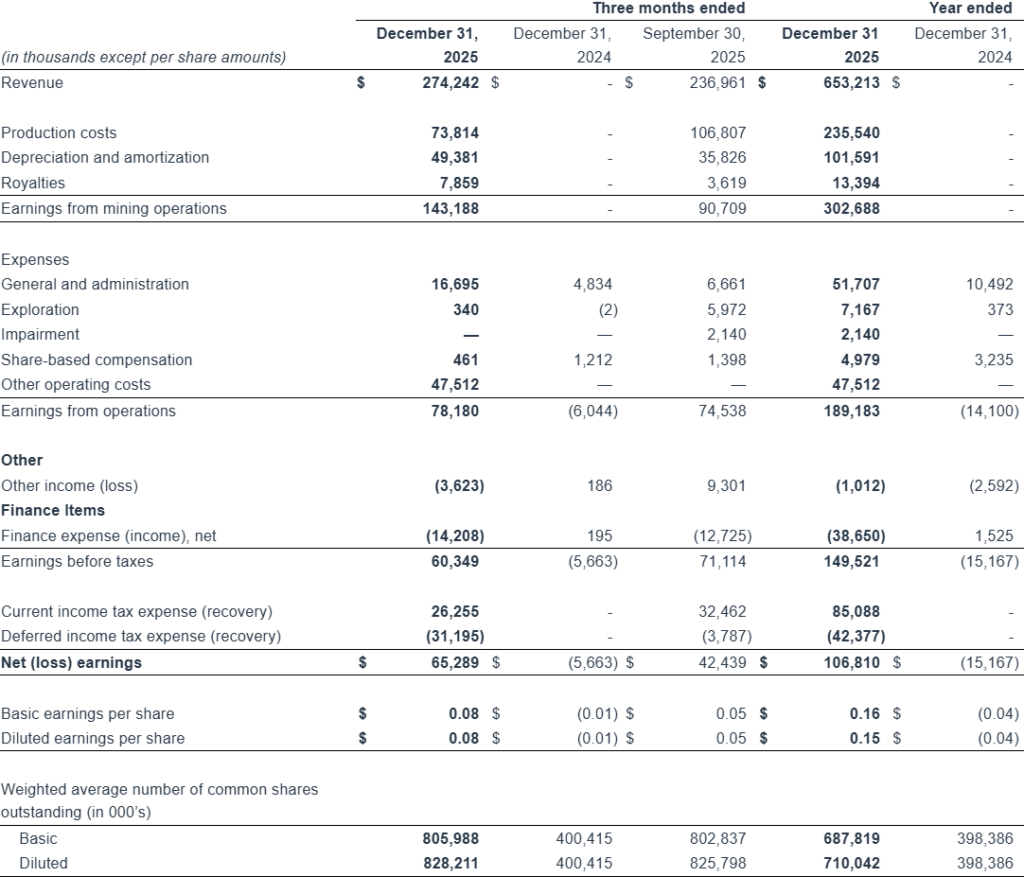
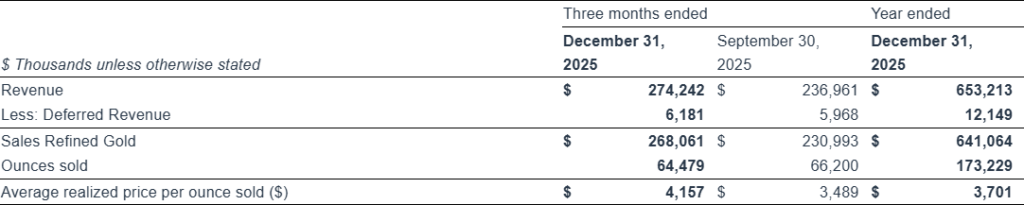
- Revenue in Q4 2025 increased 16% from the previous quarter to $274.2 million, reflecting gold sales of 64,479 ounces and an average realized gold price1 of $4,157 per ounce.
- Net earnings totaled $65.3 million, or $0.08 per basic share compared to net loss of $5.7 million, or $0.01 per basic share, in Q4 2024 and net earnings of $42.4 million, or $0.05 per basic share, in Q3 2025.
- Adjusted net earnings1 totaled $113.5 million, $0.14 per basic share, which compared to net loss of $4.3 million, or $0.01 per basic share, in Q4 2024, and adjusted net earnings of $61.1 million, or $0.08 per basic share, the previous quarter; Adjusted net earnings in Q4 2025 differed from net earnings due mainly to the exclusion from adjusted net earnings of a one-time $45.0 million reclamation expense for non-operating mine sites, a $10.9 million expense related to shares issued for the Taykwa Tagamou Nation (“TTN”) Resource Development Agreement (see Discovery press release dated October 21, 2025 for more information), $4.0 million of foreign exchange losses, $3.0 million related to a transaction services agreement (“TSA”) with Newmont Corporation, and $2.2 million of purchase price allocation adjustments.
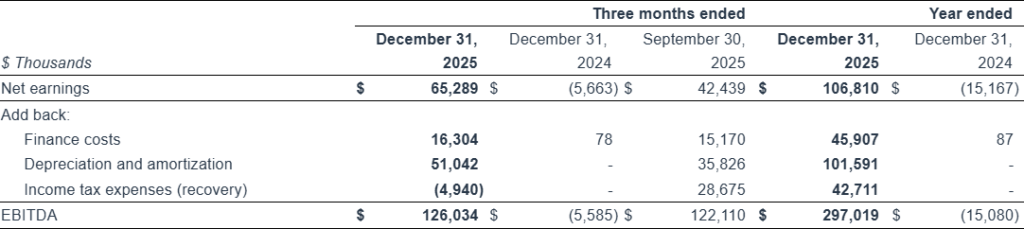
- EBITDA1,2 of $126.0 million compared to a loss before interest, taxes and depreciation and amortization of $5.6 million in Q4 2024 and EBITDA of $122.5 million in Q3 2025; EBITDA increased from the previous quarter as the favourable impact of higher revenue and lower production costs more than offset the reduction from a one-time $45.0 million reclamation expense related to non-operating mine sites due to a one-time accounting remeasurement.
- Solid operating performance in Q4 2025:
- Production of 66,718 ounces increased 6% from the previous quarter.
- Gold sales of 64,479 ounces versus 66,200 ounces in Q3 2025.
- Production costs of $73.8 million compared to $106.8 million the previous quarter, with the reduction largely due to reduced PPA adjustments and lower costs related to inventory changes compared to the previous quarter.
- Operating cash costs1 improved 12% to $1,185 per ounce sold compared to $1,339 per ounce sold in Q3 2025, largely reflecting changes in inventories.
- AISC1 averaged $2,034 per ounce sold compared to $1,734 per ounce sold the previous quarter, with the increase largely resulting from higher sustaining capital expenditures, as the Company invested in new mobile equipment, capital development and improving infrastructure at Hoyle Pond and Borden, and in buttressing the No. 6 tailings management area (“TMA6”), as well as increased Corporate G&A expense; Site-level AISC in Q4 2025 averaged $1,824 per ounce sold versus $1,699 per ounce sold in Q3 2025.
- Cash flows included net cash from operating activities of $163.2 million, which compared to net cash used in operating activities of $2.9 million in Q4 2024 and net cash from operating activities of $153.5 million the previous quarter.
- Free cash flow1 totaled $67.9 million versus free cash flow of ($2.5) million in Q4 2024 and $86.8 million in Q2 2025, with the change from Q3 2025 mainly reflecting progress in ramping up the Company’s investment programs.
- Capital expenditures1 in Q4 2025 totaled $99.9 million, with an additional $5.9 million of leases. Of the $99.1 million, $33.8 million related to sustaining capital expenditures1, while $66.1 million were growth capital expenditures1. Growth capital expenditures primarily related to pre-stripping at Pamour and longer-term investments at the TMA6.
- Cash at December 31, 2025, totaled $410.7 million compared to $341.5 million at September 30, 2025, with the increase in cash mainly resulting from the $67.9 million of free cash flow generated during Q4 2025.
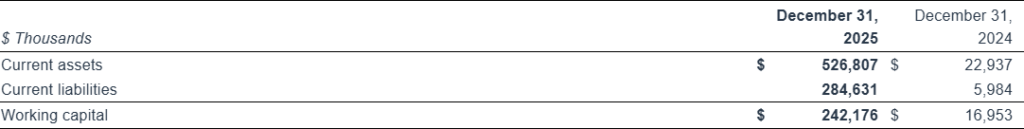
- Working capital1 at December 31, 2025 totaled $242.2 million as compared to working capital of $17.0 million at December 31, 2024 and $224.2 million at September 30, 2025. The Growth in working capital in Q4 2025 resulted from the increase in cash, partially offset by higher current taxes payable and increases in accounts payable and accrued liabilities compared to September 30, 2025. The Company’s current taxes payable at December 31, 2025, totaled $85.1 million, which will be paid in Q1 2026.
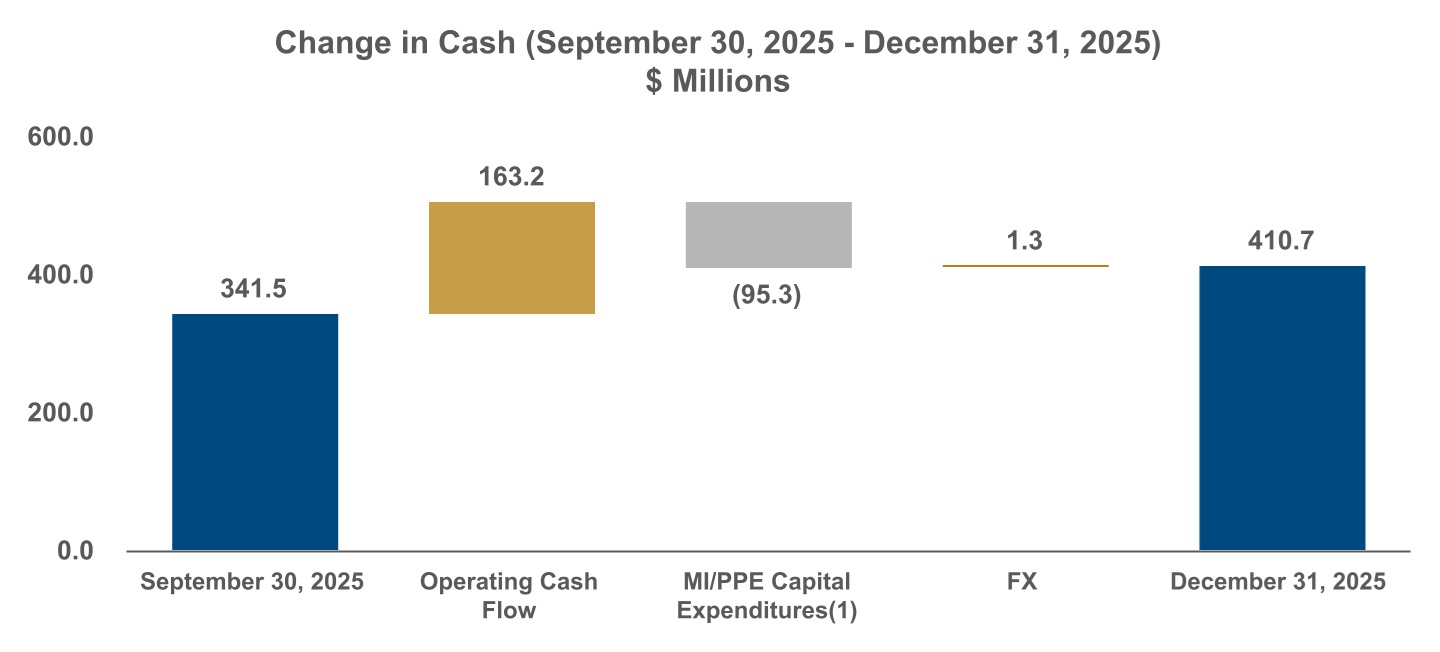
(1) Represents cash capital expenditures incurred during Q4 2025
FY 2025
Discovery did not generate revenue or earnings from mine operations in FY 2024 or Q1 2025.
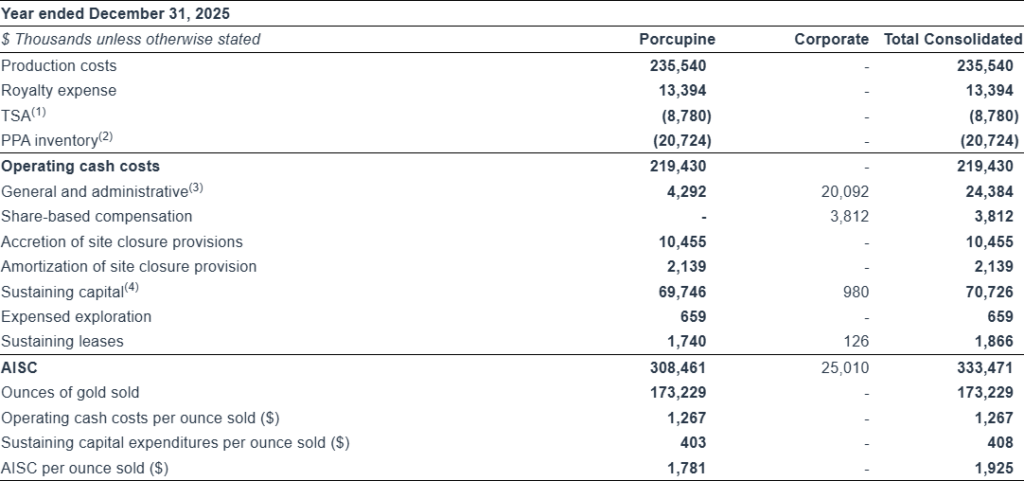
- Gold production from April 16, 2025 to December 31, 2025 totaled 180,424 ounces, while gold sales totaled 173,229 ounces. Revenue of $653.2 million resulted from gold sales and an average realized price of $3,701 per ounce. Production costs totaled $238.5 million. Operating cash costs averaged $1,267 per ounce sold, while AISC per ounce sold averaged $1,925. The difference between ounces produced and ounces sold largely reflects the delivery of in-kind ounces related to the Franco-Nevada royalty arrangement.
- EBITDA was $297.0 million versus a loss before interest, taxes and depreciation and amortization of $15.1 million in FY 2024, with earnings generated following the Porcupine Acquisition in FY 2025 mainly accounting for the significant improvement in EBITDA performance.
- Net earnings totaled $106.8 million, or $0.16 per basic share, versus net loss of $15.2 million, or $0.04 per basic share, in FY 2024, with the prior year net loss largely resulting from corporate G&A costs, share-based compensation expense and foreign exchange losses during FY 2024.
- Weighted average basic shares outstanding were 687.8 million shares versus 398.4 million shares for the same period a year earlier, with the increase mainly due to the impact of the 401.8 million shares issued during Q2 2025 in relation to the Porcupine Acquisition and related financing package.
- Adjusted net earnings were $200.0 million, or $0.29 per basic share compared to adjusted net loss of $10.7 million, or $0.03 per basic share, in FY 2024. The difference between net earnings and adjusted net earnings in FY 2025 mainly reflected the exclusion of the one-time $45.0 million reclamation expense for non-operating sites, $22.1 million of transaction-specific business development expenses, primarily related to the Porcupine Acquisition, $20.7 million of PPA adjustments, a $10.9 million expense related to shares issued in relation to the TTN Resource Development Agreement, and $8.8 million of TSA costs.
- Net cash from operating activities in FY 2025 totaled $377.7 million, while free cash flow totaled $172.2 million.
- Capital expenditures for FY 2025 totaled $212.3 million, with an additional $8.1 million of leases, which included $70.8 million of sustaining capital expenditures and $141.5 million of growth capital expenditures; Of growth capital expenditures in FY 2025, $134.4 million related to Porcupine, primarily due to pre-stripping at Pamour and longer-term investments at the TMA6, and $7.1 million related to Cordero, largely for land acquisition.
(1) Example of Non-GAAP measure. See the section of this press release entitled, “NON-GAAP MEASURES” for more information.
(2) Refers to earnings before interest, taxes and depreciation and amortization.
Income Statement Summary
PORCUPINE OPERATIONS REVIEW
Discovery’s Porcupine Operations consist of the Hoyle Pond, Pamour and Hollinger mine properties, the Dome mine property and milling facility, and numerous near-mine and regional exploration targets. The Complex also includes the Borden mine property and large land position near Chapleau, Ontario. Current operations include the Hoyle Pond and Borden underground mines, with the Pamour open-pit project ramping up towards commercial levels of production. All mineralization is processed at Dome, including mineralization from Borden, which is trucked 190 km to the Dome Mill. The Dome Mill is a 12,000 tonne-per-day processing facility that in recent years has operated at rates well below optimal levels. Through investment programs launched following the closing of the Porcupine Acquisition, the Company is targeting a return to full capacity operations by 2027 or sooner.
(1) Includes gold production, poured and sold from Hoyle Pond, Borden and Pamour.
(2) The difference between ounces produced and ounces sold largely reflects the delivery of in-kind ounces under the Franco-Nevada royalty arrangement.
(3) Example of Non-GAAP measure. See the section in this press release entitled, “NON-GAAP MEASURES” for more information.
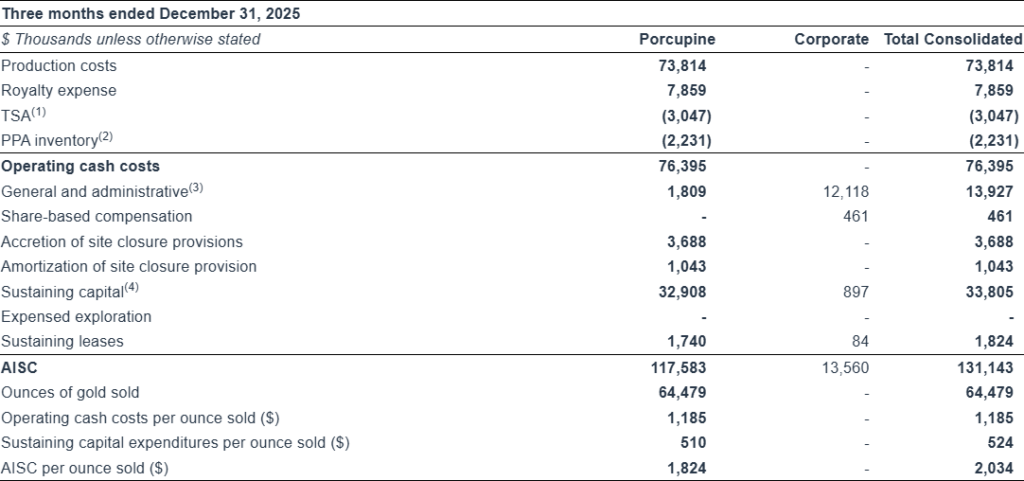
(4) Operating cash costs per ounce sold, AISC per ounce sold and total capital expenditures are site level and exclude remaining corporate G&A, share-based compensation costs and corporate-level sustaining capital expenditures.
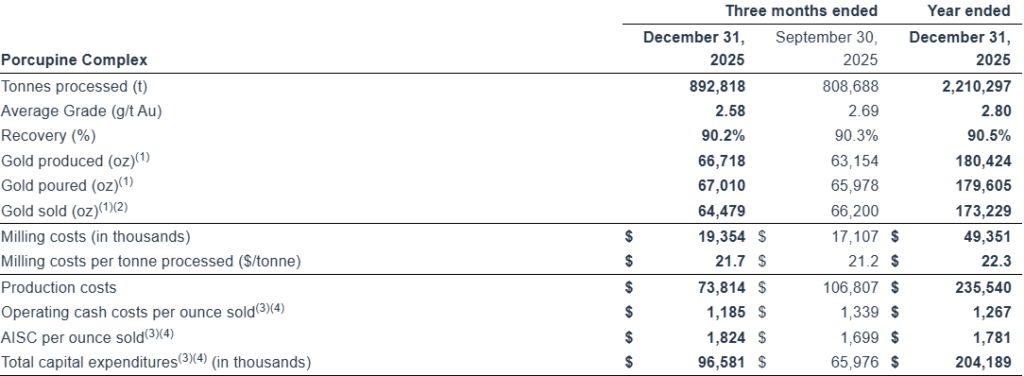
During Q4 2025, a total of 892,818 tonnes were processed at Porcupine Complex at an average grade of 2.58 g/t, with recovery rates averaging 90.2%, which compared to 808,688 tonnes at an average grade of 2.69 g/t and recovery rates averaging 90.3% in the previous quarter. A total of 66,718 ounces of gold were produced over this period, with total gold poured of 67,010 ounces, compared to 63,154 and 65,978 ounces produced and poured respectively, in the previous quarter. Higher production in Q4 2025 reflected the favourable impact of increased ore mining rates at Pamour and higher average grades at Hoyle Pond, Borden, and Pamour, partially offset by lower mining rates at Borden. The change in the combined average grade for the Porcupine Complex to 2.58 g/t in Q4 2025 from 2.69 g/t in the previous quarter, reflected a higher proportion of tonnes processed from Pamour.
Availability rates at the Dome Mill during Q4 2025 were impacted by a scheduled four-day maintenance shutdown in October, with an additional nine hours of scheduled maintenance in November. Based on operating days during Q4 2025, mill throughput averaged approximately 10,145 tonnes per day. Mill operating costs during Q4 2025 averaged $21.68 per tonne processed, similar to $21.15 per tonne processed for the previous quarter.
For FY 2025, representing operations for the period from April 16, 2025 to December 31, 2025, a total of 2,210,297 tonnes were processed at Dome Mill at an average grade of 2.80 g/t, with recovery rates averaging 90.5%. A total of 180,424 ounces of gold were produced over this period, with total gold poured of 179,605 ounces. Total mill operating costs were $49.4 million for FY 2025, for an average of $22.33 per tonne processed.
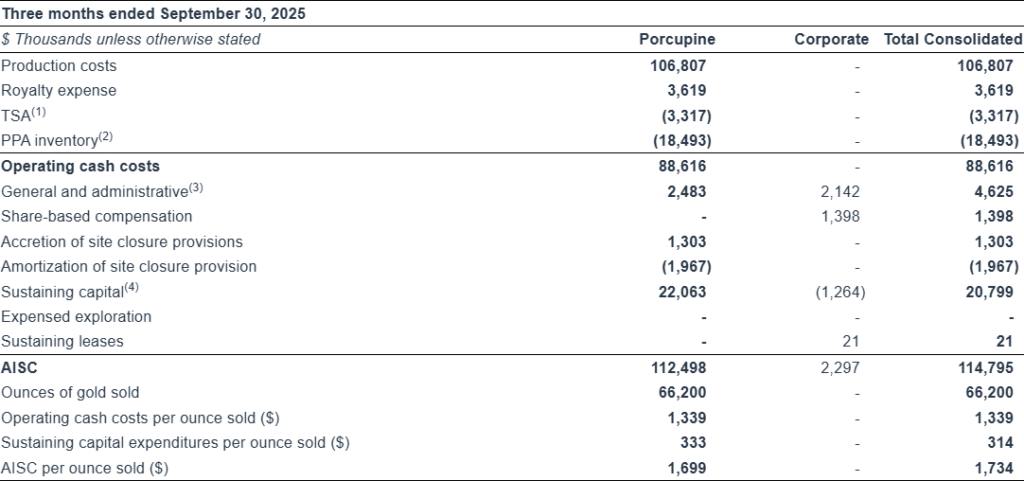
Production costs, including mining and processing costs, in Q4 2025 totaled $73.8 million versus $106.8 million in the previous quarter. Operating cash costs1 per ounce sold averaged $1,185 compared to $1,339 in the previous quarter. Site-level AISC1,2 averaged $1,824 per ounce sold compared to $1,699 in Q3 2025. The quarter-over-quarter increase in AISC reflected a 49% increase in sustaining capital expenditures1 to $32.9 million in Q4 2025, which were mainly related to increased mobile equipment procurement at Hoyle Pond and higher level of capital development at both Hoyle Pond and Borden.
For FY 2025, production costs totaled $235.5 million, with operating cash costs averaging $1,267 per ounce sold and AISC averaging $1,781 per ounce sold. Included in AISC were $69.7 million of sustaining capital expenditures related to capital development and expenditures related to TMA6.
(1) Example of Non-GAAP measure. See the section in this press release entitled, “NON-GAAP MEASURES” for more information.
(2) Site-level AISC includes corporate G&A allocation and excludes remaining G&A, share-based compensation costs and corporate-level sustaining capital expenditures.
CORDERO OVERVIEW
The Cordero Project was acquired by Discovery in 2019. Since that time, the Company has invested over $100.0 million in Mexico, conducting significant exploration drilling and technical analysis, leading to the release of multiple studies, most recently the Feasibility Study (“FS”) dated February 16, 2024 and filed on SEDAR+ (www.sedarplus.ca) on March 28, 2024. The results of the FS confirmed Cordero to be one of the world’s largest undeveloped silver deposits, with the potential for large-scale production at low unit costs, is capable of generating substantial free cash flow and attractive economic returns.
Key highlights of the FS include:
- Average annual production of 37.0 million silver equivalent ounces1(“AgEq”) over the first 12 years with a total project life of 19 years;
- AISC2 averaging below $12.50 per AgEq ounce in Years 1 – 8;
- Base-case after-tax net present value (“NPV”) of $1.2 billion (Base-case metal prices: Silver – $22.00 per ounce; Gold – $1,600 per ounce; Zinc – $1.20 per ounce; Lead – $1.00 per ounce);
- Initial capital expenditures2 of $606.0 million (resulting in a NPV to capital ratio of 2:1);
- Large-scale Mineral Reserve totaling 302.0 million ounces of silver, 840,000 ounces of gold, 5.2 billion pounds of zinc and 3.0 billion pounds of lead;
- Important socio-economic contribution to Mexico, including an initial investment of over $600 million, the creation of 2,500 jobs during development, and over 1,000 jobs during operations, $4.0 billion in total procurement, all to remain within Mexico, and, assuming a fixed $40.00 per ounce silver price, total tax contributions within Mexico of $2.7 billion over the project life; and,
- High levels of environmental responsibility and a commitment to contributing to the management of key social issues such as carbon reduction and water quality and availability.
Fourth Quarter 2025 Highlights
During Q4 2025, Discovery continued work on key initiatives to further de-risk the project, including:
- A third-party assessment to use natural gas power sources versus grid power supply and commencement of a peer review and follow up work to reach a decision point in 2026 for the primary source of power for Cordero;
- Completion of geotechnical and other assessment work related to the planned upgrade of the local water treatment plant;
- Ongoing evaluation of the potential to establish solar farms around the project site to contribute to the power supply required for mine development and operation; and,
- Participation in ongoing discussions with the various governmental bodies involved in issuing the permits for the project.
(1) AgEq produced is metal recovered in concentrate. AgEq is calculated as Ag + (Au x 72.7) + (Pb x 45.5) + (Zn x 54.6); these factors are based on metal prices of Ag – $22/oz, Au – $1,600/oz, PB – $1,00/lb and Zn – $1.20/lb use in the February 2024 FS.
(2) Example of Non-GAAP measure. See the section in this press release entitled, “NON-GAAP MEASURES” for more information.
2026 GUIDANCE
(1) Example of Non-GAAP measure. See the section in this press release entitled, “NON-GAAP MEASURES” for more information.
(2) Royalty expense is included in operating cash cost and AISC per ounce sold. Royalty expense does not include costs related to the Franco Nevada Royalties.
(3) Corporate G&A excludes share-based compensation.
(4) Based on, where applicable, a USD/CAD exchange rate of 1.36 and a USD/MXN$ exchange rate of 18.0.
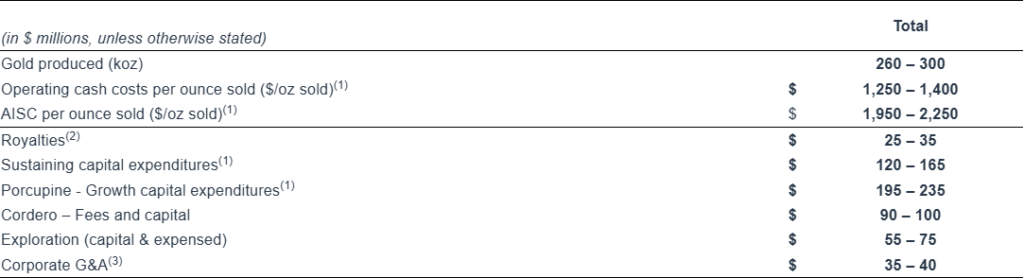
Discovery’s 2026 guidance outlines a plan for increased production, that is expected to ramp up and peak during the second half of the year. Operating cash costs per ounce sold1, AISC1 per ounce sold and capital expenditures1 are projected to be the highest in the first half of the year.
Targets for both sustaining1 and growth1 capital expenditures in 2026, reflect planned investment in support of the Company’s goal of more than doubling gold production, to over half a million ounces per year, with a cost profile in the lower half of the global cost curve. The Company’s guidance also includes a significant commitment to exploration given the substantial potential that exists to convert and expand mineral resources at existing operations and to identify new resources at the Porcupine operations, near-term projects and regional targets.
Gold Production
Gold production in 2026 is targeted to reach 260,000 – 300,000 ounces, with production weighted towards the second half of the year. Hoyle Pond and Borden are expected to account for approximately two-thirds of gold production in 2026, with the remaining third coming from open-pit mining sources. Open pit production will come from Pamour, as well as the Hollinger open pit, where production resumed early in 2026, and is expected to ramp up as the year progresses.
Unit Costs
Operating cash costs per ounce sold are projected to be highest in the first two quarters of 2026, and average $1,250 – $1,400 per ounce for the full year. Operating cash costs per ounce sold in 2026 are expected to benefit from increased volumes, resulting from higher planned processing rates at the Dome Mill, at similar grades, the impact of which will be offset by increased mining and processing costs and higher royalties as a result of an increase in the average realized gold price1. AISC per ounce sold is targeted at $1,950 – $2,250, reflecting higher sustaining capital expenditures and increased royalties compared to 2025. Unit costs are expected to be higher in the first half of the year, due to lower production levels, as mine operations at Hollinger ramp up, with AISC impacted by the weighting of sustaining capital expenditures to the first six months of 2026.
Royalties
Royalty expense in 2026 is expected to total $25 – $35 million. Royalty expense is highly dependent on the average realized gold price and will fluctuate dependent on the commodity cycle. Royalty expense primarily relates to royalty agreements with First Nations groups and private interests at Borden and, to a lesser extent, at Hoyle Pond and Pamour. Royalty expense does not include costs related to the Franco Nevada Royalties, which are accounted for as deferred revenue and are recognized when the performance obligations under the royalty agreement are satisfied. Interest expense is recorded based on the total deferred revenue balance.
Porcupine Sustaining Capital Expenditures
Sustaining capital expenditures for 2026 are projected to be $120 – $165 million primarily related to work to buttress the No. 6 tailings management area (“TMA6”) at the Dome property, as well as ongoing investments in capital improvements at the Dome Mill, new mobile equipment and improved infrastructure at Hoyle Pond and Borden. Planned capital development at both operations is required to achieve production targets. The replacement of mobile fleets at Hoyle Pond and Borden is an important initiative that will support future production growth and greater efficiency through improved cycle times for haulage, enhanced backfill rates and reduced ongoing maintenance costs.
Porcupine Growth Capital Expenditures
Growth capital expenditures at Porcupine are targeted at $195 – $235 million . Two key projects contributing to planned growth capital in 2026 include increasing tailings capacity at TMA6 through additional raises and by executing a new deposition strategy, and continued pre-stripping at Pamour, as the mine ramps up towards commercial levels of operation. The new deposition strategy at TMA6 involves dividing the #6 Dam into cells, which will support higher volumes and facilitate progressive rehabilitation, as completed cells can be rehabilitated prior to closure of the dam. Additional key projects include a new ventilation raise to be developed at Borden, and expenditures related to capital development and sump upgrades to support longer-term operations at Hoyle Pond.
Cordero
Fees and growth capital related to Cordero of $90 – $100 million are primarily for the fees required for permits and include capital to advance engineering studies for water treatment and power. A significant component of planned expenditures at Cordero relates to the anticipated payment of the change of land use permit fee. This permit, and payment of the related fee, will follow the approval of the Environmental Impact Statement (“Manifesto de Impacto Ambiental” or “MIA”) application by the Mexican Government’s Department of Natural Resources and Environment (“Secretaría de Medio Ambiente y Recursos Naturales” or “SEMARNAT”).
Exploration
Total exploration expenditures in 2026, including both capitalized and expensed expenditures, are targeted at $55 – $75 million. The Company exploration work program for the year involves an estimated 255,000 – 280,000 metres of drilling, as well as 1,200 – 1,400 metres of exploration development.
Capital exploration expenditures in 2026 are expected to total $25 – $35 million and relate mainly to continued resource conversion and expansion drilling at Hoyle Pond, Borden and Pamour. Key targets include the S Zone Deep and XMS Zone at Hoyle Pond, the further northeast extension of the Main Zone and infill of the Far West and East Lower Zones at Borden and within and along strike all three phases of the Pamour pit design. Capitalized exploration expenditures also include planned drilling at Dome designed to upgrade and add confidence to current inferred resources located on the edges and below the historic Dome pit. In addition, the Company is also targeting completion of 500 – 1,000 metres of underground exploration development at Hoyle Pond and Borden.
Expensed exploration expenditures are targeted at $30 – $40 million and involve work in the mid and upper-mine at Hoyle Pond, at the TVZ Zone adjacent to Hoyle Pond, and at Owl Creek, three kilometres west along the Hoyle Pond volcanic belt. Other key targets for expensed exploration include the down plunge extension of the Main Zone and East Lower Zone at Borden, a number of district targets around Pamour, including the Broulan Pit, AAA Trend and Keora Trend, and regional targets such as the Hollinger-McIntyre and Paymaster properties.
As at February 18, 2026, the Company had 20 exploration drill rigs operating. A breakout of drill-rig locations and related targets is provided below:
| Hoyle Pond: | Five underground drills – Three drills involved in resource conversion and extension drilling of the S Zone and two drills evaluating targets in the mid-mine. |
| TVZ Zone: | Two underground drills – One drill on the 1210 level focused on infilling and extending mineralization, and a drill on the 1680 level testing the down plunge extension of mineralization. |
| Owl Creek: | Two surface drills – Both drills are targeting mineralization near surface and at depth at Owl Creek, as well as towards the 750 Zone, located approximately 850 metres to the east. |
| Borden: | Six drills (four underground and two surface) – Three drill rigs involved in infill and expansion drilling targeting the Main (Deep) Zone to the northeast and one involved in infill and extension of the East Lower Zone, with two surface drills exploring to the northeast of the mine. |
| Pamour: | Four surface drills – Three drills focused on conversion drilling of the resource pit and one drill exploring targets near the Broulan Pit. |
| Dome: | One surface drill – Focused on the northeast portion of the historic open pit; work is also advancing to evaluate additional drill targets to the north, south and below the pit. |
Corporate G&A
Corporate G&A in 2026 is estimated at $35 – $40 million. Expenditure levels are expected to increase in 2026 reflecting the full-year impact of the Company’s transformation into a growing Canadian gold producer, and the related strengthening of organizational capabilities across operations, exploration, and corporate functions, such as finance and information technology.
(1) Example of Non-GAAP measure. See the section in this press release entitled, “NON-GAAP MEASURES” for more information.
ABOUT DISCOVERY
Discovery is a growing precious metals company that is creating value for stakeholders through exposure to both gold and silver. The Company’s silver exposure comes from its first asset, the 100%-owned Cordero project, one of the world’s largest undeveloped silver deposits, which is located close to infrastructure in a prolific mining belt in Chihuahua State, Mexico. On April 15, 2025, Discovery completed the acquisition of the Porcupine Complex, transforming the Company into a new Canadian gold producer with multiple operations in one of the world’s most renowned gold camps in and near Timmins, Ontario. Discovery owns a dominant land position within the camp, with a large base of Mineral Resources remaining and substantial growth and exploration upside.
On Behalf of the Board of Directors,
Tony Makuch, P.Eng
President, CEO & Director
For further information contact:
Mark Utting, CFA
SVP Investor Relations
Phone: 416-806-6298
Email: [email protected]
Website: www.discoverysilver.com
QUALIFIED PERSON
The scientific and technical information in this press release was reviewed and approved by Pierre Rocque, P.Eng., Chief Operating Officer of the Company and Eric Kallio, P.Geo., Senior Vice President, Exploration of the Company, who are recognized as a Qualified Persons (“QPs”) under the guidelines of National Instrument 43-101 – Standards of Disclosure for Mineral Projects (“NI 43-101”).
Scientific and technical information in this press release with respect to the Company’s Cordero project has been prepared and presented based on the technical report entitled “Cordero Silver Project, Technical Report and Feasibility Study” with an effective date of February 16, 2024, as filed on SEDAR+ (the “Feasibility Study”) which was completed by Ausenco Engineering Canada ULC, with support of AGP Mining Consultants Inc., WSP USA Inc. and RedDot3D Inc. The mineral reserve estimate was completed under the supervision of Wille Hamilton, P.Eng. Of AGP and the mineral resource estimate was completed under the supervision of R. Mohan Srivastava, P.Geo, both of whom are independent QPs as such term is defined in NI 43-101.
NON-GAAP MEASURES
The Company has included certain non-GAAP measures in this document, as detailed below. In the mining industry, these are common performance measures and ratios but may not be comparable to similar measures or ratios presented by other issuers and the non-GAAP measures and ratios do not have any standardized meaning. Accordingly, these measures and ratios are included to provide additional information and should not be considered in isolation or as a substitute for measures of performance prepared in accordance with IFRS Accounting Standards. These measures do not have any standardized meaning prescribed under IFRS, and therefore may not be comparable to other issuers.
Free Cash Flow
Free Cash Flow is a non-GAAP performance measure that is calculated as cash flows from operations net of cash flows invested in mineral property, plant, and equipment and exploration and evaluation assets. The Company believes that this measure is useful to the external users in assessing the Company’s ability to generate cash flow after capital investments and build the cash resources of the Company.
Free cash flow is reconciled to the amounts include in the Consolidated Statements of Cash Flows as follows:
Sustaining and Growth Capital
Sustaining capital and growth capital are non-GAAP measures. Sustaining capital is defined as capital required to maintain current operations at existing levels. Growth capital is defined as capital expenditures for major growth projects or enhancement capital for significant infrastructure improvements at existing operations. Both measurements are used by management to assess the effectiveness of investment programs.
Operating Cash Costs and Operating Cash Costs per Ounce Sold
Operating cash costs and operating cash costs per ounce sold are non-GAAP measures. In the gold mining industry, these metrics are common performance measures but do not have any standardized meaning under GAAP. Operating cash costs include mine site operating costs such as mining, processing, administration and royalty expenses but exclude depreciation and depletion and reclamation costs. Operating cash cost per ounce sold is based on ounces sold and is calculated by dividing operating cash costs by volume of gold ounces sold.
The Company discloses operating cash costs and operating cash cost per ounce sold as it believes the measures provide valuable assistance to investors and analysts in evaluating the Company’s operational performance and ability to generate cash flow. The most directly comparable measure prepared in accordance with GAAP is production costs. Operating cash costs and operating cash costs per ounce sold should not be considered in isolation or as a substitute for measures prepared in accordance with GAAP.
AISC and AISC per Ounce Sold
AISC and AISC per ounce sold are non-GAAP measures. These measures are intended to assist readers in evaluating the total costs of producing and selling gold from current operations. While there is no standardized meaning across the industry for this measure, the Company’s definition conforms to the definition of AISC as set out by the World Gold Council in its guidance note dated June 27, 2013.
The Company defines AISC as the sum of operating costs (as defined and calculated above), sustaining capital, exploration expense, corporate expenses, lease payments relating to sustaining assets, and reclamation cost accretion and depreciation related to current operations. Corporate expenses include general and administrative expenses, net of transaction related costs, severance expenses for management changes and interest income. AISC excludes growth capital expenditures, growth exploration expenditures, reclamation cost accretion and depreciation not related to current operations, lease payments related to non-sustaining assets, interest expense, debt repayment and taxes.
Operating cash costs and AISC Reconciliation
The following tables reconcile these non-GAAP measures to the most directly comparable GAAP measures for Q4 2025, FY 2025 and Q3 2025.
(1) Costs not reflective of normal operations.
(2) Purchase price allocation represents the depletion of inventories acquired with the business combinations.
(3) Excludes certain items not reflective of normal operations.
(4) Corporate includes the write-down of software.
(1) Costs not reflective of normal operations.
(2) Purchase price allocation represents the depletion of inventories acquired with the business combinations.
(3) Excludes certain items not reflective of normal operations.
(4) Corporate includes the write-down of software.
(1) Costs not reflective of normal operations.
(2) Purchase price allocation represents the depletion of inventories acquired with the business combinations.
(3) Excludes certain items not reflective of normal operations.
(4) Corporate includes the write-down of software.
Average Realized Price per Ounce Sold
In the gold mining industry, average realized price per ounce sold is a common performance measure that does not have any standardized meaning. The most directly comparable measure prepared in accordance with GAAP is revenue from gold sales. Average realized price per ounces sold should not be considered in isolation or as a substitute for measures prepared in accordance with GAAP. The measure is intended to assist readers in evaluating the total revenues realized in a period from current operations.
Adjusted Net Earnings and Adjusted Net Earnings per Share
Adjusted net earnings and adjusted net earnings per share are used by management and investors to measure the underlying operating performance of the Company. Adjusted net earnings is defined as net earnings adjusted to exclude the after-tax impact of specific items that are significant, but not reflective of the underlying operations of the Company, including foreign exchange gains and losses and other non-recurring items. Adjusted net earnings per share is calculated using the weighted average number of shares outstanding for adjusted net earnings per share.

(1) Non-recurring accounting remeasurement from IFRS 3 Business Combinations to IAS 37 Provisions, Contingent Liabilities, and Contingent Assets related to non-operating mine sites acquired through the Porcupine acquisition. Refer to the REVIEW OF FINANCIAL POSITION section of the Q4 2025 MD&A.
Earnings before Interest, Taxes, Depreciation, and Amortization (“EBITDA”)
EBITDA represents net earnings before interest, taxes, depreciation and amortization. EBITDA is an indicator of the Company’s ability to generate liquidity by producing operating cash flow to fund working capital needs, service debt obligations, and fund capital expenditures.
The following is a reconciliation of EBITDA to the consolidated financial statements:
Working Capital
Working capital is a non-GAAP measure. In the gold mining industry, working capital is a common measure of liquidity, but does not have any standardized meaning. The most directly comparable measure prepared in accordance with GAAP is current assets and current liabilities. Working capital is calculated by deducting current liabilities from current assets. Working capital should not be considered in isolation or as a substitute for measures prepared in accordance with GAAP. The measure is intended to assist readers in evaluating the Company’s liquidity. Working capital is reconciled to the amounts in the Consolidated Statements of Financial Position as follows:
FORWARD-LOOKING STATEMENTS
Except for statements of historical fact, information contained, or incorporated by reference, herein constitutes “forward-looking information” and “forward-looking statements” within the meaning of applicable securities laws. Such information or statements may relate to future events, facts or circumstances or the Company’s future financial or operating performance or other future events or circumstances. Forward-looking information is often, but not always, identified by the use of words such as “seek”, “anticipate”, “plan”, “continue”, “planned”, “expect”, “project”, “predict”, “potential”, “targeting”, “intends”, “believe”, and similar expressions, or describes a “goal”, or variation of such words and phrases or states that certain actions, events or results “may”, “should”, “could”, “would”, “might” or “will” be taken, occur or be achieved. Statements relating to mineral resources are deemed to be forward-looking statements, as they involve the implied assessment, based on certain estimates and assumptions, that the mineral resources described exist in the quantities predicted or estimated or that it will be commercially viable to produce any portion of such resources. Forward-looking statements in this press release include, but may not be limited to, statements and expectations regarding: outlooks for the Porcupine Complex and the Cordero Project pertaining to production rates, mining and processing rates, total cash costs, all-in sustaining costs, capital spending, cash flow, operational performance, mine life, value of operations and decreases to costs resulting from the intended mill expansion; intended infrastructure investments in, method of funding for, and timing of completion of the development and construction of the Cordero Project, planned continuation of negotiation of formal agreements with land owners and Mexican authorities with respect to the Cordero Project, as well as other statements and information as to strategy, plans or future financial and operating performance, such as project timelines, production plans, expected sustainable impact improvements, expected exploration programs, costs and budgets, forecasted cash shortfalls and the ability to fund them and other statements that express management’s expectations or estimates of future plans and performance, as well as the anticipated use of proceeds therefrom and the impact thereof on Discovery’s financial condition; and the Porcupine Complex, including the assumptions and qualifications contained in the Porcupine Technical Report (as defined herein). Forward-looking statements and forward-looking information are not guarantees of future performance and are based upon a number of estimates and assumptions of management at the date the statements are made, including among other things, the future prices of gold, silver, lead, zinc, and other metals, the price of other commodities such as coal, fuel and electricity, currency exchange rates and interest rates; favourable operating conditions, political stability, timely receipt of governmental approvals, licenses, and permits (and renewals thereof); access to necessary financing; stability of labour markets and in market conditions in general; availability of equipment; the estimation of mineral resource and mineral reserve estimates, and of any metallurgical testing completed to date; estimates of costs and expenditures to complete our programs and goals; the speculative nature of mineral exploration and development in general; there being no significant disruptions affecting the development and operation of the project, including possible pandemic; exchange rate assumptions being approximately consistent with the assumptions in the report; the availability of certain consumables and services and the prices for power and other key supplies being approximately consistent with assumptions in the report; labour and materials costs being approximately consistent with assumptions in the report and assumptions made in mineral resource estimates, including, but not limited to, geological interpretation, grades, metal price assumptions, metallurgical and mining recovery rates, geotechnical and hydrogeological assumptions, capital and operating cost estimates, and general marketing, political, business and economic conditions. Many of these assumptions are inherently subject to significant business, social, economic, political, regulatory, competitive and other risks and uncertainties, contingencies, and other factors that are not within the control of Discovery Silver Corp. and could thus cause actual performance, achievements, actions, events, results or conditions to be materially different from those projected in the forward-looking statements and forward-looking information.
Forward-looking information and forward-looking statements involve known and unknown risks, uncertainties and other factors which may cause the actual results, performance or achievements of the Company to be materially different from any other future results, performance or achievements expressed or implied by such statements. In addition to factors already discussed in this document, such risks, uncertainties and other factors include, among others: metal prices, continued access to capital and financing, general economic and market access restrictions or tariffs, changes in
U.S. laws and policies regarding regulating international trade, including but not limited to changes to or implementation of tariffs, trade restrictions, or responsive measures of foreign and domestic governments, changes to cost and availability of goods and raw materials, along with supply, logistics and transportation constraints, changes in general economic conditions including market volatility due to uncertain trade policies and tariffs;potential disputes with Indigenous groups in relation to the Porcupine Complex; risks related to unexpected liabilities arising after the Porcupine Acquisition Closing; risks related to the nature of acquisitions; reliance on information about the Porcupine Complex provided by third parties; regulatory risks associated with the Porcupine Acquisition; the risk that the Company will not realize the anticipated benefits of the Porcupine Acquisition; risks related to integrating the Porcupine Complex; reliance on a third party for transitional services for a period of time after the Porcupine Acquisition Closing; litigation and public attitude towards the Porcupine Acquisition; costs related to the Porcupine Acquisition; increased indebtedness arising from financing the Porcupine Acquisition; risks associated with exploration, development, and operating risks, and risks associated with the early-stage status of the Company’s mineral properties; the nature of exploration could have a negative effect on the Company’s operations and valuation; risk related to the cyclical nature of the mining business; permitting and license risks; risks related to title to land and the potential acquisition of neighboring land packages and the timing thereof; risks related to requiring a significant supply of water for the Company’s operations and being able to source it; the availability of adequate infrastructure for the Company’s operations; risks related to community relations; environmental risks and hazards and the limitations that environmental regulation poses on the Company; market price volatility of the Company’s common shares; uncertainties with respect to economic conditions; the Company’s mineral exploration activities being subject to extensive laws and regulations and the risk of failing to comply with those laws or obtain required permits; the accuracy of historical and forward-looking operational and financial information estimates provided by Newmont; the Company’s ability to integrate the Porcupine Operations; statements regarding the Porcupine Operations, including the results of technical studies and the anticipated capital and operating costs, sustaining costs , internal rate of return, concession or claim renewal, the projected mine life and other attributes of the Porcupine Operations, including net present value, the timing of any environmental assessment processes, reclamation obligations; risks and uncertainties related to operating in a foreign country, and specifically, risks arising from operating in Mexico; risks posed by health epidemics and other outbreaks; climate change risks, including risks associated with increased frequency of natural disasters such as fire, flood and seismicity; the risk that commodity prices decline; cybersecurity risks; risks of adverse publicity; potential dilution to the common shares; risks associated with contractual agreements and subsidiaries; the potential of future lack of funding; credit and liquidity risks; the Company’s history of net losses and negative operating cash flow; the Company’s reliance on a limited number of properties; uninsurable risks; costs of land reclamation; pandemic and global health risks on the Company’s business, operations, and market for securities; the competitive nature of mineral exploration and in the mining industry generally; the Company’s reliance on specialized skills and knowledge; risks associated with acquisitions and integrating new business; future sales of common shares by existing shareholders; risks associated with having multiple shareholders holding over 10% of the common shares; influence of third-party stakeholders; litigation risk; conflicts of interest; reliance on key executives; reliance on internal controls; risks stemming from international conflicts; risks related to changes to tariff and import/ export regulations; global financial conditions; currency rate risks; potential enforcement under the Extractive Sector Transparency Measures Act (Canada); and the potential to pay future dividends.
Although the Company has attempted to identify important factors that could cause actual performance, achievements, actions, events, results, or conditions to differ materially from those described in forward-looking statements or forward-looking information, there may be other factors that cause performance, achievements, actions, events, results, or conditions to differ from those anticipated, estimated, or intended. Further details relating to many of these factors is discussed in the section entitled “Risk Factors” in the Company’s AIF available on SEDAR+ at www.sedarplus.ca.
Forward-looking statements and forward-looking information contained herein are made as of the date of this press release and the Company disclaims any obligation to update or revise any forward-looking statements or forward-looking information, whether as a result of new information, future events, or results or otherwise, except as required by applicable law. There can be no assurance that forward-looking statements or forward-looking information will prove to be accurate, as actual results and future events could differ materially from those anticipated in such statements. Accordingly, readers should not place undue reliance on forward-looking statements or forward-looking information. All forward-looking statements and forward-looking information attributable to the Company is expressly qualified by these cautionary statements.
A photo accompanying this announcement is available at https://www.globenewswire.com/NewsRoom/AttachmentNg/5d8ba14a-1f6b-4944-b23b-1b0a3e6c2ea4
Original Article: https://www.globenewswire.com/news-release/2026/02/19/3240937/0/en/Discovery-Reports-Strong-Earnings-Growth-and-Cash-Generation-in-Q4-2025.html