FOURTH QUARTER FREE CASH FLOW OF $157 MILLION AND ADJUSTED ATTRIBUTABLE EPS OF $0.50 PER SHARE
DENVER, Feb. 17, 2021 /PRNewswire/ – SSR Mining Inc. (NASDAQ: SSRM) (TSX: SSRM) (ASX: SSR) (“SSR Mining” or “the Company”) reports consolidated financial results for the fourth quarter and year ended December 31, 2020.
Rod Antal, President and CEO said, “We exited 2020 with strong operational and financial momentum across all four of our operating assets. The fourth quarter represented the first full quarter following the completion of the Alacer merger, and the results demonstrated the strength of the business with 220,000 gold-equivalent ounces produced at $976 per ounce AISC and $157 million in free cash flow. Given our strong balance sheet we declared our first quarterly dividend in line with our recently instituted capital allocation policy. Our peer leading free cash flow will also provide us the opportunity to assess additional capital returns to shareholders in the form of supplemental dividends and/or share buy-back programs in the future.
In 2021, we remain focused on execution and delivery with the goal of demonstrating our organic ability to sustain 700,000 to 800,000 gold-equivalent ounces of production for the next 5+ years. Our large brownfield growth and exploration pipeline will take center-stage this year as we advance projects and provide clarity on their potential scale and timelines.”
Fourth Quarter and Year-End 2020 Highlights:
(All figures are in U.S. dollars unless otherwise noted)
- Closed zero-premium merger with Alacer: On September 16, 2020, completed the transaction with Alacer to create a leading intermediate precious metals producer with robust margins, strong free cash flow generation and long mine lives led by a highly experienced leadership team with a track record of value creation.
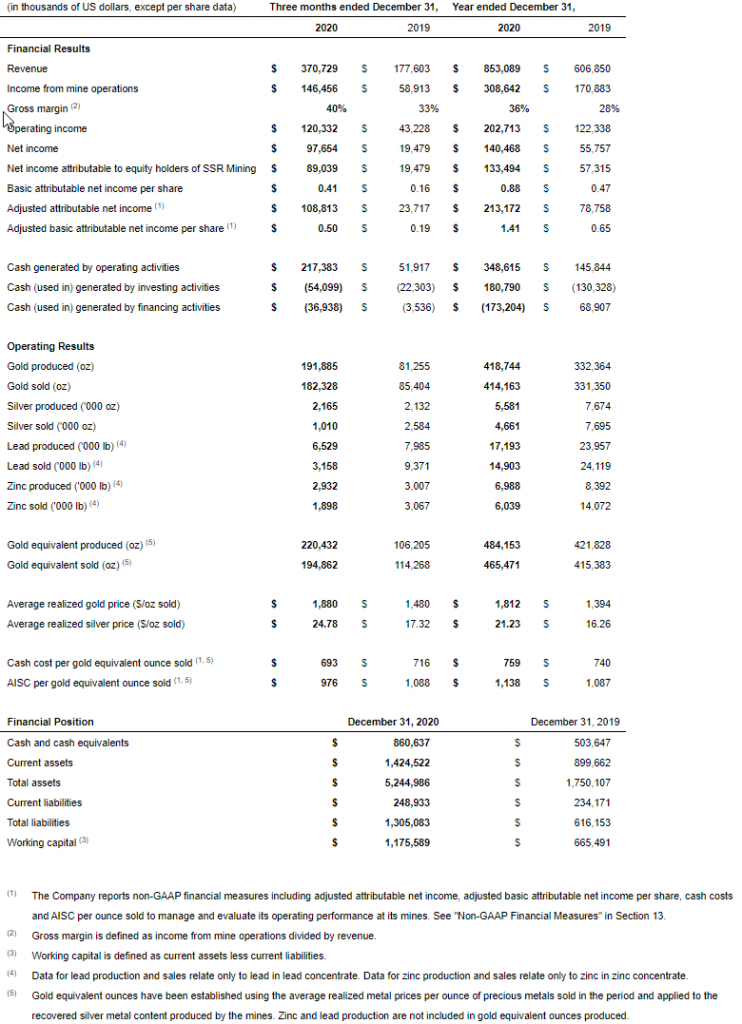
- Robust free cash flow: Reported fourth quarter attributable net income of $89.0 million, or $0.41 per share, and adjusted attributable net income of $108.8 million, or $0.50 per share. Generated cash flows from operating activities of $217.4 million and free cash flow of $157.0 million in the fourth quarter.(1)
- Record fourth quarter performance: Delivered fourth quarter production of 220,432 gold equivalent ounces at AISC of $976 per gold equivalent ounce, exiting the year with strong operational momentum.(1)
- Enhanced balance sheet and liquidity: Cash and cash equivalents and consolidated cash balances at year-end increased to $860.6 million and $897.0 million, respectively, further strengthening the Company’s peer-leading balance sheet.(1) Cash and cash equivalents increased by $127.1 million during the fourth quarter.
- Inaugural dividend announced: The Board declared the first quarterly cash dividend of $0.05 per share.
- Delivered positive Çöpler District Master Plan studies: Released an updated NI 43-101 technical report outlining two production scenarios which demonstrate the long-term value and the significant organic growth potential of this world-class operation.
- Discovered C2 copper-gold porphyry target at Çöpler: Announced positive results from four diamond drill holes below the Çöpler pit, with all holes intersecting gold-rich copper porphyry mineralization. The C2 results are another example of the long-term potential of Çöpler.
- Çöpler contributes low-cost production: Delivered gold production of 83,029 ounces in the fourth quarter and annual production of 326,908 ounces.(2) Reported AISC of $748 per ounce in the fourth quarter, generating robust margins.(1)
- Record production at Marigold: Delivered gold production of 76,941 ounces for the fourth quarter and annual production of 234,443 ounces, marking both quarterly and annual production records for the operation.
- Marigold recognized for operator safety: The Marigold team was awarded first place by the Nevada Mining Association for safety for large metal operator in 2020.
- Steady-state production at Seabee: Produced 31,915 ounces of gold at AISC of $787 per ounce in the fourth quarter as the mine returned to steady-state operations.(1)
- Strong performance at Puna: Produced 2.2 million ounces of silver at cash costs of $8.92 per ounce in the fourth quarter.(1) AISC of $15.90 per ounce was impacted by sales well below production due to lags as concentrate shipments resumed.(1)
- Provided robust 2021 outlook: In 2021, the Company expects to produce, on a consolidated basis, 720,000 to 800,000 gold-equivalent ounces at consolidated AISC of $1,050 to $1,110 per gold equivalent ounce.(1)
| (1) | SSR Mining reports the non-GAAP financial measures of all-in sustaining costs (“AISC”) per ounce of gold, silver and gold equivalent sold, adjusted attributable net income, adjusted attributable net income per share, free cash flow and consolidated cash to manage and evaluate the Company’s operating performance. See “Non-GAAP Financial Measures” in Section 13. |
| (2) | Includes full year 2020 production from Çöpler. SSR Mining is not entitled to the economic benefits from Çöpler prior to acquisition. |
Çöpler, Turkey
(amounts presented on 100% basis)
| Three months ended December 31 | Period from acquisition to December 31, 2020 | Year ended December 31 | ||||
| Operating Data | 2020 | 2020 (1) | 2020 (2) | |||
| Gold produced – oxide (oz) | 21,200 | 26,458 | 87,548 | |||
| Gold produced – sulfide (oz) | 61,830 | 76,158 | 239,360 | |||
| Total gold produced (oz) | 83,029 | 102,616 | 326,908 | |||
| Gold sold (oz) | 80,388 | 108,283 | 321,272 | |||
| Ore mined – oxide (kt) | 1,354 | 1,501 | 2,823 | |||
| Ore mined – sulfide (kt) | 935 | 1,034 | 2,255 | |||
| Total material mined (kt) | 7,045 | 8,108 | 25,861 | |||
| Waste removed (kt) | 4,756 | 5,573 | 20,783 | |||
| Strip ratio | 2.1 | 2.2 | 4.1 | |||
| Ore stacked – oxide (kt) | 1,292 | 1,413 | 2,841 | |||
| Gold grade stacked – oxide (g/t) | 1.20 | 1.20 | 1.13 | |||
| Ore processed – sulfide (kt) | 584 | 669 | 2,158 | |||
| Gold grade processed – sulfide (g/t) | 3.61 | 3.62 | 3.74 | |||
| Gold recovery – sulfide (%) | 90.3 | 90.1 | 90.7 | |||
| Average realized gold price ($/oz sold) | $ | 1,876 | $ | 1,887 | $ | 1,763 |
| Cash costs ($/oz gold sold) (3, 4) | $ | 619 | $ | 614 | $ | 625 |
| AISC ($/oz gold sold) (3, 4) | $ | 748 | $ | 743 | $ | 752 |
| Financial Data ($000s) | ||||||
| Revenue | $ | 151,970 | $ | 205,536 | N/A | |
| Production costs | $ | 79,948 | $ | 120,618 | N/A | |
| Depletion and depreciation | $ | 25,158 | $ | 34,053 | N/A | |
| Income from mine operations | $ | 46,864 | $ | 50,865 | N/A | |
| Exploration and evaluation expenses | $ | 2,605 | $ | 3,558 | N/A | |
| Capital expenditures | $ | 18,463 | $ | 22,883 | N/A |
| (1) | The data presented in this column is for the period from September 16, 2020 to December 31, 2020, the period for which the Company was entitled to all economic benefits of Çöpler following the Company’s acquisition of Alacer. |
| (2) | The operating data presented in this column includes operating results for Çöpler for the entire year ended December 31, 2020, including the period prior to the Company’s acquisition of Alacer on September 16, 2020. As the Company was not entitled to the economic benefits of Çöpler prior to the acquisition, financial data for the periods prior to September 16, 2020 are not provided. |
| (3) | The Company reports the non-GAAP financial measures of cash costs and AISC per ounce of gold sold to manage and evaluate operating performance at Çöpler. For further information, please refer to Non-GAAP Financial Measures” in Section 13. |
| (4) | Cash costs and AISC per ounce of gold sold exclude the impact of any fair value adjustment on acquired inventories as at the date of the Company’s acquisition of Alacer. |
Production
During the fourth quarter of 2020, Çöpler produced 83,029 ounces of gold, which included 21,200 ounces of gold production from the Çöpler oxide plant and 61,830 ounces of gold production from the sulfide plant. Production was in line with guidance despite the impacts of COVID-19. The mine plan was revised and other actions taken to mitigate the impacts of COVID-19.
From September 16, 2020, the date of the Company’s acquisition of Alacer, to December 31, 2020, Çöpler produced 102,616 ounces of gold, which included 26,458 ounces of gold production from the Çöpler oxide plant and 76,158 ounces of gold production from the sulfide plant.
For the year ended December 31, 2020, Çöpler produced 326,908 ounces of gold, which included 87,548 ounces of gold production from the Çöpler oxide plant and 239,360 ounces of gold production from the sulfide plant. Production was in line with the revised mine plan that was adopted to diversify ore sources and optimize production in light of the shortfall in mine operator numbers resulting from COVID-19.
For the three months and year ended December 31, 2020, oxide ore tonnes mined were 1.4 million and 2.8 million tonnes, respectively. The oxide ore mined grade was 1.16 g/t and 1.06 g/t, respectively.
For the three months and year ended December 31, 2020, sulfide ore tonnes mined were 0.9 million and 2.3 million tonnes, respectively, in line with the revised mine plan.
For the three months and year ending December 31, 2020, the sulfide plant treated 0.6 million and 2.2 million tonnes of sulfide ore, respectively. The sulfide plant continued to efficiently operate above design throughput. Plant gold recovery averaged approximately 91% for the year ended December 31, 2020. Recovery improvement projects continued in the fourth quarter of 2020, some of which continue into 2021.
Mine operator availability suffered in 2020 due to COVID-19 restrictions. The revised mine plan reduced the haulage of material to the tailings storage facility (“TSF”), stockpiling this material for 2021, and allowed for available mining resources to be focused on the Manganese pit cutback. The TSF is approximately 5 kilometers from the mine and is constructed from competent mine waste. Despite the reduced construction rate in 2020 as a result of the impacts from COVID-19, the TSF is advancing ahead of operational requirements. A mining area was also brought into production in the Main Pit to diversify ore sources, in part, as a risk management strategy should COVID-19 related restrictions increase. Total mined tonnes for the fourth quarter and full year 2020, with the revised mine plan, were above the original mine plan.
For the three months and year ended December 31, 2020, the total waste tonnes mined were 4.8 million and 20.8 million tonnes, respectively, in line with the revised mine plan.
The Çöpler District Master Plan 2020 (“CDMP2020”), issued in November 2020, updated the operating parameters of the sulfide plant and includes the results of optimization studies and programs, including the supplemental flotation circuit.
The flotation circuit included in the recent amendment to the Çöpler Environmental Impact Assessment application and incorporated into the CDMP2020 was approved for construction by the Board of Directors. The flotation circuit will treat a side stream from the grinding circuit, with the concentrate reporting to autoclave feed and the tails to leaching. The flotation circuit is anticipated to increase the gold and sulfur grades processed through the autoclaves (increasing autoclave and oxygen utilization), reduce unit costs, and increase total sulfide plant throughput and gold production. Overall recovery declines modestly due to lower float tails recovery. The currently-installed grinding mills have demonstrated significant latent capacity, sufficient to support an increase in sulfide plant throughput capacity up to approximately 3 million tonnes per annum. The capital cost estimate for the flotation circuit is approximately $18 million. At December 31, 2020, the detailed engineering designs for the flotation circuit were 89% complete and the civil construction was 95% complete. The fabrication of the steel work is in progress, with tank delivery at 75% and assembly at 55% completion. The flotation circuit commissioning is targeted for mid-year 2021.
Revenue
Revenue for the fourth quarter of 2020 was $152.0 million as 80,388 ounces of gold were sold at an average realized gold price of $1,876 per ounce.
Revenue for the period from September 16, 2020, the date of the Company’s acquisition of Alacer, to December 31, 2020, was $205.5 million as 108,283 ounces of gold were sold at an average realized gold price of $1,887 per ounce.
Gold ounces sold in the fourth quarter of 2020 were lower than production due to the timing of gold pours at year end. Gold ounces sold from the date of acquisition to December 31, 2020 were higher than production due to the sale of finished goods inventory acquired on the acquisition date.
Operating Costs
Cash costs and AISC per ounce of gold sold are non-GAAP financial measures. Please see the discussion under “Non-GAAP Financial Measures” in Section 13.
Unit operating costs remained stable as a weaker local currency offset by the impacts associated with COVID-19. The impact of fair value adjustments on acquired inventories and mineral interests are reflected in production costs and depletion and depreciation, respectively. These impacts have been removed in the calculation of cash costs and AISC per ounce of gold sold (refer to Section 13).
In the fourth quarter of 2020, cash costs per ounce of gold sold were $619. Royalty expense included in cash costs increased due to a combination of higher rate and higher gold prices.
In the fourth quarter of 2020, AISC per ounce of gold sold was $748, which was also affected by increased royalty expense.
Marigold, USA
| Three months ended December 31, | Year ended December 31, | |||||||||
| Operating Data | 2020 | 2019 | Change | 2020 | 2019 | Change | ||||
| Gold produced (oz) | 76,941 | 59,186 | 30% | 234,443 | 220,227 | 6% | ||||
| Gold sold (oz) | 73,927 | 61,088 | 21% | 230,043 | 226,957 | 1% | ||||
| Total material mined (kt) | 22,699 | 18,457 | 23% | 85,594 | 74,039 | 16% | ||||
| Waste removed (kt) | 15,946 | 11,736 | 36% | 62,038 | 48,364 | 28% | ||||
| Total ore stacked (kt) | 6,753 | 6,721 | —% | 23,556 | 25,676 | (8)% | ||||
| Gold stacked grade (g/t) | 0.48 | 0.36 | 33% | 0.39 | 0.40 | (3)% | ||||
| Strip ratio | 2.4 | 1.7 | 41% | 2.6 | 1.9 | 37% | ||||
| Average realized gold price ($/oz sold) | $ | 1,885 | $ | 1,478 | 28% | $ | 1,783 | $ | 1,391 | 28% |
| Cash costs ($/oz gold sold) (1) | $ | 838 | $ | 778 | 8% | $ | 852 | $ | 811 | 5% |
| AISC ($/oz gold sold) (1) | $ | 1,070 | $ | 1,117 | (4)% | $ | 1,222 | $ | 1,034 | 18% |
| Financial Data ($000s) | ||||||||||
| Revenue | $ | 139,183 | $ | 90,198 | 54% | $ | 409,798 | $ | 315,320 | 30% |
| Production costs | $ | 62,228 | $ | 47,472 | 31% | $ | 196,409 | $ | 183,782 | 7% |
| Depletion and depreciation | $ | 15,752 | $ | 12,463 | 26% | $ | 47,844 | $ | 52,291 | (9)% |
| Income from mine operations | $ | 61,203 | $ | 30,263 | 102% | $ | 165,545 | $ | 79,247 | 109% |
| Exploration and evaluation expenses | $ | 427 | $ | 319 | 34% | $ | 2,462 | $ | 936 | 163% |
| Capital expenditures | $ | 15,833 | $ | 20,754 | (24)% | $ | 80,161 | $ | 53,702 | 49% |
| (1) | The Company reports the non-GAAP financial measures of cash costs and AISC per ounce of gold sold to manage and evaluate operating performance at Marigold. For further information, please refer to “Non-GAAP Financial Measures” in Section 13. |
Production
In the fourth quarter of 2020, 22.7 million tonnes of material were mined, a 23% increase compared to the fourth quarter of 2019. For the year ended December 31, 2020, 85.6 million tonnes of material were mined, a 16% increase over the year ended December 31, 2019. These increases are attributable to shorter haulage cycles coupled with increased fleet capacities in load, haul and drilling.
During the fourth quarter of 2020, 6.8 million tonnes of ore was stacked at a gold grade of 0.48 g/t. This compares to 6.7 million tonnes of ore stacked at a gold grade of 0.36 g/t in the fourth quarter of 2019. The higher grades delivered in the fourth quarter of 2020 as compared to the fourth quarter 2019 are associated with the planned mining of the higher-grade portions of Mackay 4 and Mackay 8. In the fourth quarter of 2019, mining activities focused on the lower grade portions of Mackay 5 and stripping of Mackay 4.
For the year ended December 31, 2020, 23.6 million tonnes of ore was stacked at a gold grade of 0.39 g/t compared to 25.7 million tonnes of ore stacked at a gold grade of 0.40 g/t for the year ended December 31, 2019. The reduction in both ore tonnes stacked and gold grade are associated with the transition from mining higher grade Mackay 5 ore in 2019 to the stripping and mining of Mackay Phases 4 and 8 in 2020.
During the fourth quarter of 2020, Marigold produced a quarterly record 76,941 ounces of gold, an increase of 30% compared to the fourth quarter of 2019 and 15% higher than the previous quarterly record. Production benefited from higher grades stacked at lower lifts on the heap leach pads. A decrease in electrowinning cell inventory also contributed to ounces produced in the fourth quarter of 2020.
Annual production in 2020 of 234,443 ounces was a record for the mine’s 32-year history. This was 6% higher than the 220,227 ounces of gold for the year ended December 31, 2019. The increase was due to low stacking elevations throughout 2020 which contributed to faster leach times and a decrease in electrowinning cell inventory during 2020.
Revenue
Revenue increased by 54% to $139.2 million in the fourth quarter of 2020 compared to the fourth quarter of 2019, due to a 28% increase in the average realized gold price and 21% more ounces sold.
Revenue increased by 30% for the year ended December 31, 2020 compared to the year ended December 31, 2019, due to an increase of 28% in the average realized gold price.
Gold ounces sold in the fourth quarter and for the year ended December 31, 2020 were lower than production due to the timing of gold pours at year end.
Operating Costs
Cash costs and AISC per ounce of gold sold are non-GAAP financial measures. Please see the discussion under “Non-GAAP Financial Measures” in Section 13.
Cash costs per ounce of gold sold for the fourth quarter of 2020 was $838, an 8% increase compared to the fourth quarter of 2019, primarily due to an increase in per unit royalty costs due to higher realized gold prices. Cash costs per ounce of gold sold for the full year 2020 were $852, a 5% increase compared to the full year 2019 for the same reason.
In the fourth quarter of 2020, AISC per ounce of gold sold was $1,070, a 4% decrease compared to the fourth quarter of 2019, due to lower capital expenditures per gold ounce sold partially offset by higher cash costs. Capital spend was lower in the fourth quarter of 2020 primarily due to the purchase of a hydraulic shovel in the fourth quarter of 2019 with no comparable purchase in 2020.
AISC per ounce of gold sold for the year ended December 31, 2020 was $1,222, an 18% increase compared to the year ended December 31, 2019 due to higher cash costs and an increase in capital expenditures per gold ounce sold. Capital expenditures were higher than the year ended December 31, 2019, due to mobile mine equipment replacements, increased leach pad construction, dewatering construction costs and higher deferred stripping.
Seabee, Canada
| Three months ended December 31, | Year ended December 31, | |||||||||
| Operating Data | 2020 | 2019 | Change | 2020 | 2019 | Change | ||||
| Gold produced (oz) | 31,915 | 22,069 | 45% | 81,686 | 112,137 | (27)% | ||||
| Gold sold (oz) | 28,013 | 24,362 | 15% | 75,837 | 104,915 | (28)% | ||||
| Total ore milled (t) | 99,487 | 87,394 | 14% | 255,178 | 344,039 | (26)% | ||||
| Ore milled per day (t/day) | 1,081 | 950 | 14% | 697 | 943 | (26)% | ||||
| Gold mill feed grade (g/t) | 9.85 | 7.89 | 25% | 10.10 | 9.56 | 6% | ||||
| Gold recovery (%) | 98.4 | 97.9 | 1% | 98.4 | 98.2 | —% | ||||
| Average realized gold price ($/oz sold) | $ | 1,877 | $ | 1,484 | 26% | $ | 1,790 | $ | 1,398 | 28% |
| Cash costs ($/oz sold) (1) | $ | 531 | $ | 505 | 5% | $ | 534 | $ | 464 | 15% |
| AISC ($/oz sold) (1) | $ | 787 | $ | 751 | 5% | $ | 939 | $ | 812 | 16% |
| Financial Data ($000s) | ||||||||||
| Revenue | $ | 52,498 | $ | 36,142 | 45% | $ | 135,230 | $ | 146,141 | (7)% |
| Production costs | $ | 15,583 | $ | 12,283 | 27% | $ | 41,308 | $ | 48,470 | (15)% |
| Depletion and depreciation | $ | 11,148 | $ | 10,124 | 10% | $ | 28,233 | $ | 36,368 | (22)% |
| Income from mine operations | $ | 25,767 | $ | 13,735 | 88% | $ | 65,689 | $ | 61,303 | 7% |
| Exploration and evaluation expenses | $ | 2,088 | $ | 1,210 | 73% | $ | 6,108 | $ | 8,770 | (30)% |
| Capital expenditures | $ | 8,201 | $ | 5,946 | 38% | $ | 33,758 | $ | 33,559 | 1% |
| (1) | The Company reports the non-GAAP financial measures of cash costs and AISC per ounce of gold sold to manage and evaluate operating performance at Seabee. For further information, please refer to “Non-GAAP Financial Measures” in Section 13. |
Production
In response to the COVID-19 pandemic, Seabee was voluntarily placed into temporary care and maintenance on March 25, 2020 as a precautionary measure to protect the Company’s employees, their families and communities. Through this period, employees maintained the mine in a state of operational readiness.
In June 2020, a phased restart of the operation commenced. The first phase focused on underground ventilation raises and capital development within the mine while COVID-19-related protocols were assessed. Limited ore extraction was initiated at the end of June. In early July, Seabee commenced the second phase, which involved increasing underground development rates and mine production while continuing to monitor COVID-19 related protocols. In August, the third and final phase commenced, which involved a restart of milling operations and ramp-up to full mine production with a complete workforce, while continuing to maintain effective COVID-19-related protocols. The mine has operated at full capacity since completion of the final phase in August.
During the fourth quarter of 2020, Seabee produced 31,915 ounces of gold, a 45% increase compared to the fourth quarter of 2019, due to increases in tonnes and grade mined and milling of stockpiled ore. Mill feed grade was 9.85 g/t gold during the fourth quarter of 2020, a 25% increase compared to the fourth quarter of 2019, due to the scheduled sequencing of the mine.
For the year ended December 31, 2020, Seabee produced 81,686 ounces of gold, a 27% decrease compared to the year ended December 31, 2019, reflecting that the mill was shut down from March through August 2020, whereas the mill was fully operational in 2019.
Revenue
Revenue increased by 45% in the fourth quarter of 2020 compared to the fourth quarter of 2019 due to a 15% increase in gold ounces sold and a 26% increase in the average realized gold price.
Revenue decreased by 7% for the year ended December 31, 2020 compared to the year ended December 31, 2019, due to a 28% decrease in gold ounces sold, partially offset by a 28% increase in the average realized gold price. The decrease in gold ounces sold is due to the temporary suspension of operations as a result of COVID-19.
Gold ounces sold in the fourth quarter and for the year ended December 31, 2020 were lower than production due to the timing of shipments of gold on carbon fines and the timing of gold pours at year end.
Operating Costs
Cash costs and AISC per ounce of gold sold are non-GAAP financial measures. Please see the discussion under “Non-GAAP Financial Measures” in Section 13.
In the fourth quarter of 2020, cash costs per ounce of gold sold were $531, a 5% increase compared to the fourth quarter of 2019, due to higher general and administrative costs associated with the ramp up to full production.
In the fourth quarter of 2020, AISC per ounce of gold sold was $787, a 5% increase compared to the fourth quarter of 2019, due to higher cash costs. Capital expenditures in the fourth quarter of 2020 related mainly to the tailings expansion project. Full construction activities at the tailings expansion project resumed in early August 2020.
For the year ended December 31, 2020, cash costs per ounce of gold sold were $534, a 15% increase compared to the year ended December 31, 2019, due to higher unit mining and general and administrative costs, driven by the temporary suspension of operations for all of the second quarter and beginning of the third quarter.
For the year ended December 31, 2020, AISC per ounce of gold sold was $939, a 16% increase compared to the year ended December 31, 2019, due to higher cash costs.
Puna, Argentina
(amounts presented on 100% basis)
| Three months ended December 31, | Year ended December 31, | |||||||||
| Operating Data | 2020 | 2019 | Change | 2020 | 2019 | Change | ||||
| Silver produced (‘000 oz) | 2,165 | 2,132 | 2% | 5,581 | 7,674 | (27)% | ||||
| Silver sold (‘000 oz) | 1,010 | 2,584 | (61)% | 4,661 | 7,695 | (39)% | ||||
| Lead produced (‘000 lb) (1) | 6,529 | 7,985 | (18)% | 17,193 | 23,957 | (28)% | ||||
| Lead sold (‘000 lb) (1) | 3,158 | 9,371 | (66)% | 14,903 | 24,119 | (38)% | ||||
| Zinc produced (‘000 lb) (1) | 2,932 | 3,007 | (2)% | 6,988 | 8,392 | (17)% | ||||
| Zinc sold (‘000 lb) (1) | 1,898 | 3,067 | (38)% | 6,039 | 14,072 | (57)% | ||||
| Total material mined (kt) | 2,750 | 3,244 | (15)% | 5,696 | 12,282 | (54)% | ||||
| Waste removed (kt) | 2,440 | 2,725 | (10)% | 4,879 | 10,839 | (55)% | ||||
| Strip ratio | 7.9 | 5.3 | 49% | 6.0 | 7.5 | (20)% | ||||
| Ore milled (kt) | 416 | 400 | 4% | 1,118 | 1,394 | (20)% | ||||
| Silver mill feed grade (g/t) | 170 | 174 | (2)% | 164 | 184 | (11)% | ||||
| Lead mill feed grade (%) | 0.78 | 0.99 | (21)% | 0.77 | 0.89 | (13)% | ||||
| Zinc mill feed grade (%) | 0.52 | 0.63 | (17)% | 0.51 | 0.54 | (6)% | ||||
| Silver recovery (%) | 95.2 | 95.1 | —% | 94.6 | 93.2 | 2% | ||||
| Lead recovery (%) | 90.8 | 91.9 | (1)% | 90.2 | 85.8 | 5% | ||||
| Zinc recovery (%) | 61.4 | 54.3 | 13% | 55.5 | 49.2 | 13% | ||||
| Average realized silver price ($/oz) | $ | 24.78 | $ | 17.32 | 43% | $ | 21.23 | $ | 16.26 | 31% |
| Cash costs ($/oz silver sold) (2) | $ | 8.92 | $ | 8.90 | —% | $ | 11.43 | $ | 10.38 | 10% |
| AISC ($/oz silver sold) (2) | $ | 15.90 | $ | 11.18 | 42% | $ | 15.22 | $ | 14.06 | 8% |
| Financial Data ($000s) | ||||||||||
| Revenue | $ | 27,078 | $ | 51,263 | (47)% | $ | 102,525 | $ | 145,389 | (29)% |
| Production costs | $ | 11,822 | $ | 29,424 | (60)% | $ | 60,317 | $ | 97,558 | (38)% |
| Depreciation and depletion | $ | 2,634 | $ | 6,924 | (62)% | $ | 15,665 | $ | 17,498 | (10)% |
| Income from mine operations | $ | 12,622 | $ | 14,915 | (15)% | $ | 26,543 | $ | 30,333 | (12)% |
| Exploration, evaluation and reclamation expense | $ | (2,337) | $ | 492 | (575)% | $ | (2,144) | $ | 786 | (373)% |
| Capital expenditures | $ | 6,480 | $ | 5,557 | 17% | $ | 17,690 | $ | 33,819 | (48)% |
| (1) | Data for lead production and sales relate only to lead in lead concentrate. Data for zinc production and sales relate only to zinc in zinc concentrate. |
| (2) | The Company reports the non-GAAP financial measures of cash costs and AISC per ounce of silver sold to manage and evaluate operating performance at Puna. For further information, please refer to “Non-GAAP Financial Measures” in Section 13. |
Production
On March 20, 2020, Puna temporarily suspended operations as a result of government-mandated restrictions due to the COVID-19 pandemic. Subsequently, the Government of Argentina reinstated mining as an essential business activity. During the second quarter of 2020, a phased restart complying with government regulations and guidelines was implemented with the recommencement of mining, hauling and milling operations. During the third quarter of 2020, COVID-19 infection rates in the Province of Jujuy escalated, resulting in further interruptions to operations. In September, operations were suspended in order to manage camp occupancy, conduct testing and reduce the risk of transmission. Due to the significant ore stockpiles at Puna, milling operations were prioritized over mining operations through restarts. As a result, tonnes mined in the third quarter of 2020 were impacted due to COVID-19 related interruptions. Mining and milling activities were operating at expected levels by the beginning of October 2020.
During the fourth quarter of 2020, Puna produced 2.2 million ounces of silver, a 2% increase compared to the fourth quarter of 2019, due to higher tonnage milled at modestly lower grades. Lead and zinc production decreased 18% and 2% respectively, due to lower base metal head grades with zinc benefiting from a significant increase in recovery due to achieving finer ore grind. Ore milled was 0.4 million tonnes, a 4% increase compared to the fourth quarter of 2019 due to an increase in throughput and shorter shutdowns for scheduled maintenance. Processed ore contained an average silver grade of 170 g/t, a 2% decrease compared to the fourth quarter of 2019, which was in-line with the mine plan. The mill averaged approximately 4,517 tonnes per day during the fourth quarter of 2020, demonstrating an improved performance on plant throughput and tailings pumping system capacity achieved through continuous improvements.
For the year ended December 31, 2020, Puna produced 5.6 million ounces of silver, a 27% decrease compared to the year ended December 31, 2019, due to the temporary suspension of operations in response to COVID-19 during the second and third quarters of 2020. Lead and zinc production was similarly affected by the COVID-19 related shutdowns. Ore milled was 1.1 million tonnes, a 20% decrease compared to the year ended December 31, 2019, also as a result of COVID-19 related shutdowns. Processed ore contained an average silver grade of 164 g/t, an 11% decrease compared to the year ended December 31, 2019, but in-line with the mine plan.
Revenue
Revenue decreased by 47% in the fourth quarter of 2020 compared to the fourth quarter of 2019, due to a 61% decrease in silver ounces sold, partially offset by a 43% increase in the average realized silver price. Sales in the fourth quarter and for the year ended December 31, 2020 were significantly below production due to the normal transport and refining cycles associated with ramp-up after the COVID-19 related shutdowns.
Revenue decreased by 29% for the year ended December 31, 2020 compared to the year ended December 31, 2019, due to a 39% decrease in silver ounces sold as a result of the COVID-19 operational shutdowns, partially offset by a 31% increase in the average realized silver price.
Operating Costs
Cash costs and AISC per ounce of silver sold are non-GAAP financial measures. Please see the discussion under “Non-GAAP Financial Measures” in Section 13.
In the fourth quarter of 2020, cash costs per ounce of silver sold were $8.92, consistent with the fourth quarter of 2019.
In the fourth quarter of 2020, AISC per ounce of silver sold was $15.90, an increase of 42% compared to the fourth quarter of 2019. The increase in AISC was primarily due to higher capital expenditures per silver ounce sold, driven by silver ounces sold well below production due to normal ramp-up times for shipping and selling concentrates.
For the year ended December 31, 2020, cash costs per ounce of silver sold were $11.43, an increase of 10% compared to the year ended December 31, 2019, primarily due to higher mining unit costs, offset by lower processing and general and administrative unit costs as a result of higher average daily plant throughput and the positive impact of the renegotiation of the natural gas contract. Mining costs were higher due to operating inefficiencies through shutdown and start-up phases and an increase in maintenance work performed during the temporary suspensions.
For the year ended December 31, 2020, AISC per ounce of silver sold was $15.22, an increase of 8% compared to the year ended December 31, 2019, due to higher cash costs per ounce sold, offset partially by lower sustaining capital expenditures, mainly due to lower deferred stripping costs and the deferral of capital projects due to impacts of COVID-19.
Exploration and Development
The Company holds a portfolio of prospective exploration tenures across Turkey, the USA, Canada, Mexico and Peru both near or adjacent to the existing operations (near-mine) and greenfield standalone prospects. The Company continues exploring both near-mine and greenfield prospects with a focus on the near-mine targets. Near-mine expansion projects can leverage existing mine infrastructure and capability to generate lower cost, faster development opportunities.
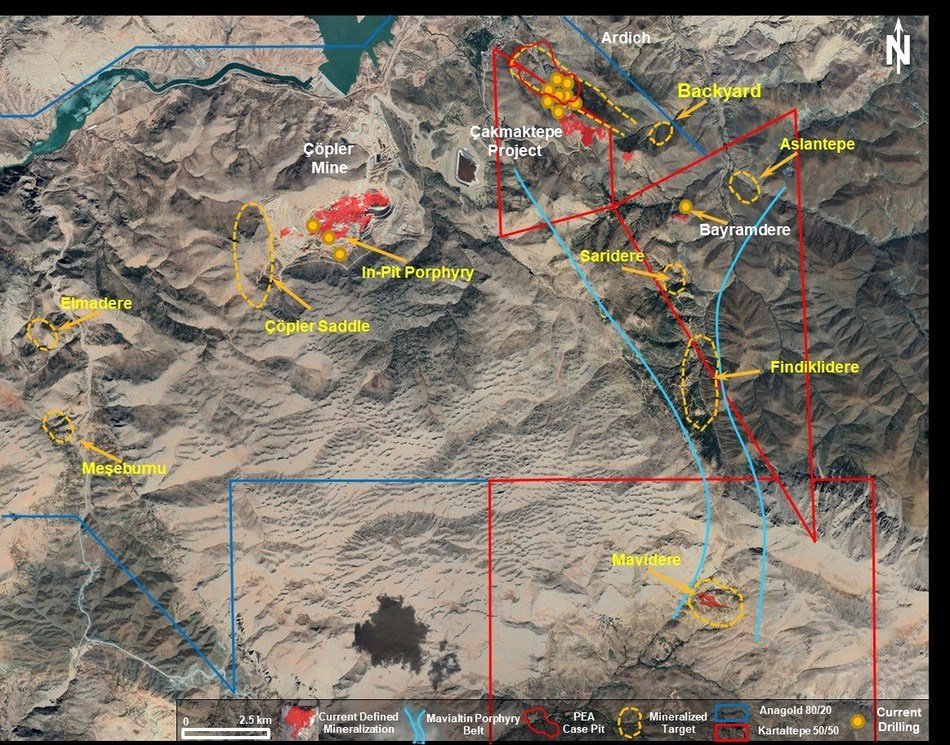
Çöpler District Exploration
The Company takes a disciplined approach to exploration at the Çöpler District, optimizing the historical exploration database, remapping and reinterpreting data, and judiciously drill testing new targets.
A primary focus in the Çöpler District is to fast-track exploration of oxide ore to take advantage of spare oxide plant capacity.
The Çöpler Saddle prospect and the Ardich and Çakmaktepe deposits represent the priorities as near–mine development projects with potential to add to the Company’s production profile within the next two to three years.
Çöpler (80% owned)
The operating mine is the center for district exploration activities, with established infrastructure for treating both oxide and sulfide gold ores.
Commencing in 2017, a Çöpler in–pit exploration program successfully provided additional oxide ore to the processing facilities. The in–pit exploration program is ongoing, targeting both oxide and sulfide ore. Recently, the in-pit exploration program identified the possibility of a copper-gold porphyry system below the Main pit. Designated C2, drill testing of the target commenced at the end of the second quarter of 2020 and continued through the third quarter. Initial drill results are encouraging and are described in detail below.
C2 Porphyry Copper-Gold (80% owned)
The C2 target lies directly below the Main pit of the Çöpler mine. In 2020, four diamond drill holes were completed along a line of approximately 730 meters, with all holes intersecting gold-rich copper porphyry mineralization. Chalcopyrite is visible in the drill core with mineralization starting at or close to the bottom of the currently defined Çöpler Main pit.
Some of the newly discovered porphyry intrusive has been exposed in parts of the lower benches. The porphyry has well-developed stockwork and sheeted sulfide-quartz veins. Where exposed in the pit benches, these veins are locally overprinted by thicker quartz-sericite-sulfide veins. The copper mineralization is predominantly chalcopyrite formed as disseminations in the matrix and as thin veins associated with quartz accompanied with rare molybdenite mineralization. There is elevated arsenic in some zones, but this does not seem to be directly correlated to the copper mineralization. The gold mineralization is not visible.
In 2020, the Company drilled eleven diamond core holes totaling 5,379 meters, with results of the first four holes announced in a news release dated November 25, 2020.
Significant results were returned from the initial four holes:
- CDD955 returned 0.74% CuEq(1) over 241.5 meters from 37 meters, and 0.42% CuEq(1) over 166.2 meters from 287.5 meters.
- CDD935 returned 0.86% CuEq(1) over 108.6 meters from 103.1 meters.
- CDD940 returned 0.71% CuEq(1) over 81.5 meters from 271.2 meters.
- CDD947 returned 1.14% CuEq(1) over 49.6 meters from 156.9 meters,1.20% CuEq(1) over 18.4 meters from 237.8 meters, and 0.30% CuEq(1) over 127.7 meters from 303.3 meters.
| (1) | Copper equivalent calculated as CuEq = [Cu ppm + ((Au ppm*Au price(g) / Cu price(g)) /10,000)]. Based upon metal prices of $1,750/oz gold and $3.00/pound copper with recovery assumed to be 100% as no metallurgical test work has been completed. CuEq will change proportionally to the metal’s relative recoveries once metallurgical test work is complete. Intervals reported are sections with more than 0.2%CuEq (and a minimum 0.1%Cu) and less than of 5 meters contiguous dilution. |
Metallurgical test work commenced at a contract laboratory in Canada on C2 diamond drill core samples. Preliminary indications from the metallurgical flotation test work is encouraging. The Company is currently drilling with three diamond drill rigs and plans to increase the number of rigs to nine in the first quarter of 2021.
Ardich Gold Deposit (80% owned)
The Ardich gold deposit is six kilometers northeast of the Çöpler processing facilities and is accessible by the nearby haul road to Çakmaktepe. The deposit mostly forms a tabular flat-lying gold-rich oxide and sulfide zone at the contact between an overlying assemblage of ultramafic rocks and underlying clastic and limestone rock types. The deposit is predominantly oxide mineralization.
A total of 175 drill holes were included in the maiden Ardich Mineral Resource estimate announced November 22, 2019. Since the cut-off date for the November 2019 Mineral Resource, data has been obtained for an additional 129 drill holes for a total of 304 drill holes. Based on the additional drill data, the Company provided an updated Ardich Mineral Resource estimate on November 30, 2020 within the CDMP2020, a summary of which is provided in the table below.
The CDMP20 includes an alternative PEA case including the development of Ardich.
Drilling continues at Ardich as the Mineral Resource remains open for expansion. Subsequent to the November 2020 Mineral Resource estimate published in the Technical Report which included drilling data up to February 2020, a total of 147 additional diamond drill holes totaling 35,147 meters have been drilled in the Ardich project. Development work including additional technical studies and permitting also continues.
| Mineral Resource Estimate for the Ardich Deposit (as at the Effective Date) | ||||
| Material Type | Resource Category Material | Tonnes (kt) | Au (g/t) | Contained Gold (koz) |
| Oxide (LS+HS) | Measured | 4,707 | 1.63 | 246 |
| Indicated | 12,817 | 1.62 | 666 | |
| Measured + Indicated | 17,524 | 1.62 | 912 | |
| Inferred | 4,713 | 1.62 | 246 | |
| Sulfide | Measured | 695 | 2.56 | 57 |
| Indicated | 2,231 | 3.71 | 266 | |
| Measured + Indicated | 2,926 | 3.43 | 323 | |
| Inferred | 782 | 4.24 | 107 | |
| Total | Measured | 5,402 | 1.75 | 303 |
| Indicated | 15,048 | 1.93 | 932 | |
| Measured + Indicated | 20,451 | 1.88 | 1,235 | |
| Inferred | 5,495 | 1.99 | 352 |
| Mineral Resources for Adrich have an effective date of 27 November 2020 and have been prepared in accordance with National Instrument 43-101 – Standards of Disclosure for Mineral Projects (“NI 43-101”). The Mineral Resources estimate for Ardich has been prepared by Sharron Sylvester, BSc (Geol), RPGeo AIG (10125), employed by OreWin Pty Ltd as Technical Director – Geology, a qualified person as defined under NI 43-101. All key assumptions, parameters and methods used to estimate Mineral Resources for Ardich and the data verification procedures followed are set out in the CDMP 2020.Mineral Resources that are not Mineral Reserves have not demonstrated economic viability.Due to the uncertainty that may be attached to Inferred Mineral Resources, it cannot be assumed that all or any part of an Inferred Mineral Resource will be upgraded to an Indicated or Measured Mineral Resource as a result of continued exploration.Mineral Resources are shown on a 100% basis. More than 96% of the Mineral Resources are located on the SSR Mining owned 80% ground, with the remainder of the mineralization within the 50%/50% ownership boundary.Low-sulfur (LS) oxide is defined as material with <1% total sulfur, high-sulfur (HS) oxide is material with total sulfur >1% and <2%, and sulfide material has ≥2% total sulfur.All Mineral Resources in the CDMP 2020 were assessed for reasonable prospects for eventual economic extraction by reporting only material that fell within conceptual pit shells based on metal prices of $1,750/oz for gold. The following parameters were used: metallurgical recoveries in oxide 40.0%–73.0%, and in sulfide 82.9%; Au cut-off grades in oxide 0.30–0.55 g/t Au, and in sulfide 0.77 g/t Au, (there are no credits for Ag or Cu in the cut-off grade calculations); allowances have been made for royalty payable.Reported Mineral Resources contain no allowances for unplanned dilution, or mining recovery. Tonnage and grade measurements are in metric units. Contained gold is reported in troy ounces.Tonnages are rounded to the nearest thousand tonnes; grades are rounded to two decimal places. As a result, totals may not match. |
Çöpler Saddle (80% owned)
The Saddle prospect borders the western flank of Çöpler as a two kilometer long north-south shear zone passing through West pit.
Çakmaktepe Mine (50% owned)
Çakmaktepe lies five kilometers east of the Çöpler processing infrastructure. In 2019, Phase 1 was mined. Exploration is investigating continuity to Ardich, which is immediately adjacent to the northeast of Çakmaktepe.
The Mavialtin Porphyry Belt (50% owned by SSR Mining)
The Mavialtin Porphyry Belt contains at least four gold-copper porphyry type exploration targets over a seven by 20 kilometer area from Çakmaktepe in the north to the deposit at Mavidere in the south. In February 2020, positive drill results were announced for Mavidere, Findiklidere, and Aslantepe. The mineralization is close to surface and appears to be low in deleterious elements.
The exploration strategy for Mavialtin is two–fold:
- Expand the known areas of mineralization, while concurrently making new discoveries, to economically justify a stand-alone mine; and/or
- Define a Mavialtin Complex where various smaller deposits could be processed through a central facility.
Mavialtin’s developmental potential and optionality are supported by:
- Proximity to existing Çöpler operations/infrastructure;
- Near-surface nature of the mineralization;
- Length of the mineralized intercepts which indicate the potential for volume; and
- Some high-grade intercepts.
Based on the results announced in February 2020, additional mapping and geochemistry, the Company drilled five diamond core holes totaling 2,122 meters in Findiklidere and drilled three diamond core holes totaling 1,384 meters in Saridere Prospects between July 2020 and October 2020.
Copper Hill Copper Exploration Prospect (50% owned)
In April 2020, the Company announced encouraging drill results from the Copper Hill exploration prospect in the Black Sea region (northeast Turkey). The intercepts were high grade, close to surface and appear to be very low in contaminates. The drilling pattern was constrained to areas previously permitted for drilling. Additional diamond drilling planned in 2020, to test the extension of the mineralization, was deferred due to COVID-19 related issues and is now planned for the 2021 summer drill season.
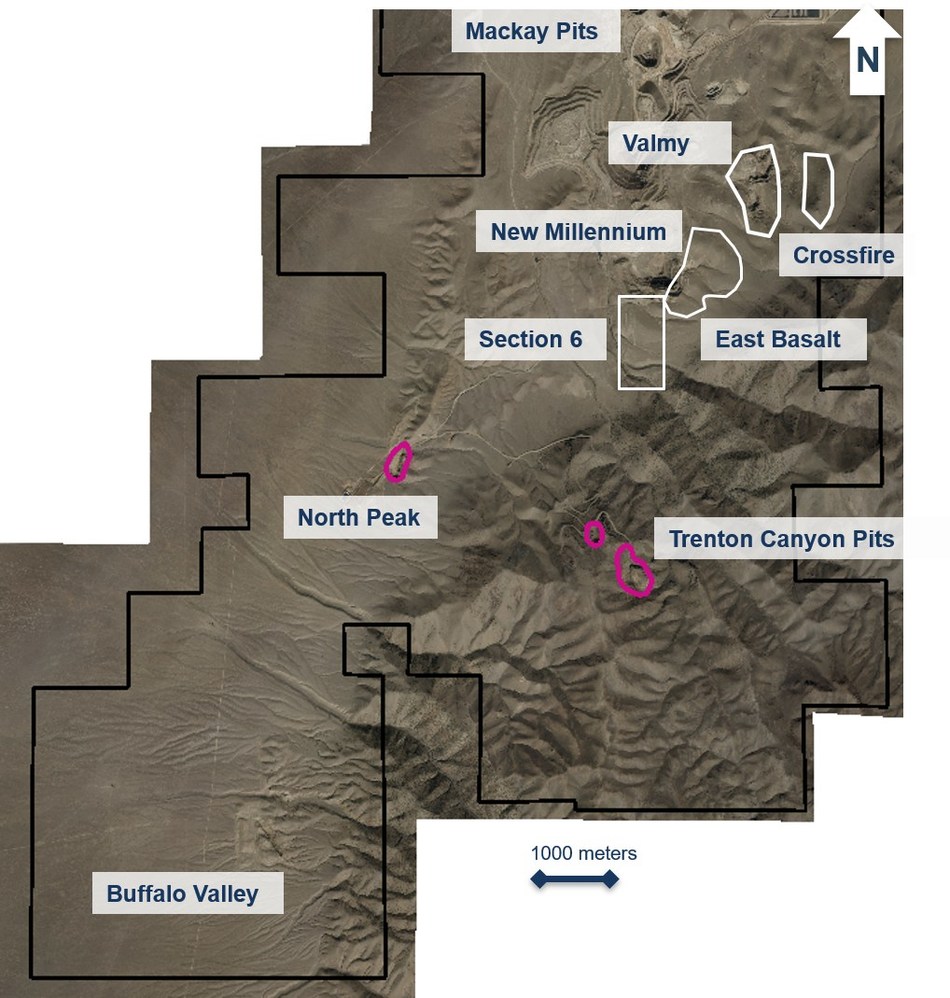
Marigold Exploration
An important focus of the 2020 exploration program was to identify new Mineral Resources on 11,740 hectares of adjoining mineral tenures that were acquired between 2015 and 2019.
At Valmy, there are three historic open pits mined by previous owners between 2002 and 2005, which produced approximately 196,000 ounces of gold. The Company has been expanding Mineral Resources around these pits since acquisition in 2015.
At Trenton Canyon, there is a historical Mineral Resource area and three mined pits developed by previous owners between 1996 and 2005, which produced approximately 290,000 ounces of gold. Since acquisition in 2019, the Company has been conducting exploration to confirm the historic drill database validity and expand known mineralization areas. The main objective is to define an open-pit oxide gold Mineral Resource amenable to heap leach processing.
At Buffalo Valley, predecessor companies mined a small open pit, which produced approximately 50,000 ounces of gold between 1987 and 1990. Following acquisition in mid-2019, the Company has focused on verifying historical information and assessing the potential for oxide gold Mineral Resources.
A focus for the Company is to increase gold production at Marigold by defining Mineral Resources to support additional stand-alone heap leach facilities in the North Peak area. In 2020, Marigold tested areas south of the currently producing Mackay Pit including Valmy, Crossfire, East Basalt, Section 6 and Trenton Canyon. As a result of land acquisitions, the Company is exploring the opportunity for a larger pit concept, encompassing East Basalt, Antler, Battle Cry and Section 6, which the Company refers to as New Millennium. In total, 15,185 meters of reverse circulation drilling in 48 holes and 1,055 meters of core drilling in 1 hole were completed in the fourth quarter of 2020. During 2020, a total of 72,788 meters were completed in 208 drill holes.
The Company completed 17.6 kilometers of seismic geophysical survey in two lines; one east-west transect, crossing just south of the Basalt and Antler open pits, and a north-south line the length of the Marigold deposits and onto the Trenton Canyon ground. Once compiled, the Company expects to validate the interpretation with the current core drilling results that have identified the favorable Comus Formation. This work aims to establish a method of mapping the 3D structure of the main rock assemblages beneath the entire property to identify targets with potential for higher-grade sulfide mineralization.
In the fourth quarter of 2020, a soil sampling program was initiated at the Trenton Canyon property. A total of 14.5 square kilometers of coverage is planned, with samples collected in a 61 meter staggered grid pattern for 3,854 total samples. In the fourth quarter of 2020, the Company completed approximately 1.5 square kilometers, collecting 395 samples. This program is expected to be completed in the first quarter of 2021, weather permitting. The soil survey covers an area of ground east of the Trenton Canyon mine extending to the tenement boundary where there is no historic surface geochemical coverage. Anomalous gold and pathfinder concentrations in soil strongly correlate to known mineral centers at Trenton Canyon, and anomalies identified by the new survey will be evaluated for future exploration campaigns.
For 2021, the Company is planning 71,450 meters of reverse circulation and core drilling for Mineral Resource and Mineral Reserve conversion and additions at Mackay, Valmy, New Millennium, Trenton Canyon, and Buffalo Valley.
Canada Exploration
The Company controls two separate claim groupings in Saskatchewan, Canada: Seabee and the Amisk project, which is 140 kilometers southeast of Seabee.
Seabee
The Seabee mineral interests comprise 100%-owned mineral tenures that are referred to as Seabee claims and an 80% owned joint venture interest on the contiguous Fisher property. Through late 2020 and early 2021, Seabee exercised its option to acquire 80% of the Fisher property and establish a joint venture, with Seabee being the operator, to advance exploration and development. Exploration activities in 2020, particularly at Fisher and other Seabee brownfield targets, were impacted as the mine shut down and then reduced ancillary activities due to COVID-19.
At Santoy, recent exploration success on Gap Hanging Wall (“Gap HW”) encouraged the Company to establish underground access to the zone on the 46 level, which is 450 meters below surface. Gap HW has excellent potential to provide additional ore feed and is approximately 220 meters in the 8A mining area’s hanging wall. Sheeted quartz veins in siliceous intrusive rock host gold mineralization at Gap HW, and the metallurgy is similar to other ores from Santoy.
The first excavation in the Gap HW was completed in the fourth quarter of 2020. A total of 12,470 tonnes of mineralized material was removed, with results reconciling closely to the Company’s block model estimates in this part of the orebody. In addition, the excavation provided the Company with geotechnical, structural and grade continuity determinations critical for mine design. A mobile drill rig is currently drilling tightly spaced holes into the foot wall and hanging wall of the current excavation to further determine grade continuity across the entire width of the zone and enhance future block model estimates, development drives and stope design initiatives. This program is intended to confirm structural interpretation, continuity and grades as part of the technical work to convert Mineral Resources to Mineral Reserves.
The focus of drilling efforts for the fourth quarter of 2020 remained on infill and extension drilling of the Gap HW, as well as exploring the prospective Santoy Hanging Wall (Santoy HW) target. During the fourth quarter of 2020, the Company drilled 9,606 meters underground and an additional 3,887 meters from surface for a combined total of 13,493 meters. During 2020, the Company completed 39,855 meters of drilling underground and 9,638 meters from surface for a total of 49,493 meters.
In the first quarter of 2020, brownfield exploration drilling approximately 1 kilometer south of the Santoy Mine Complex encountered high-grade gold mineralization at the Joker target. The sheeted quartz veins are hosted in the same siliceous intrusive rocks as the Gap HW deposit and represent an encouraging new target to be followed-up in 2021.
The Fisher property is contiguous to Seabee claims and, in May 2020, the Company reported encouraging drill results from gold prospects at Mac North, Yin and Abel Lake. In the fourth quarter of 2020, the Company completed a 3,500 meter drill program at the Mac North target and was successful in expanding the zone down-plunge and along strike, encountering wider visible gold-bearing zones than previous drilling. In total, the Company drilled 37 holes for 12,976 meters at Fisher in 2020. These targets will be further explored in 2021.
Amisk
The Amisk property is 39,882 hectares and hosts an Indicated Mineral Resource estimate. Proterozoic volcano-sedimentary rock assemblages, prospective for both base metal massive sulfide deposits and orogenic gold deposits, underlie the area. The Company’s plan for this property is to investigate its potential for lode gold mineralization on the claim’s western portion. The summer field program comprised detailed mapping and prospecting of the numerous gold showings on the property.
2021 Outlook
For the full year 2021, the Company expects to produce, on a consolidated basis, 720,000 to 800,000 gold equivalent ounces from its four operating mines at consolidated AISC of $1,050 to $1,110 per gold equivalent ounce.
| Operating Guidance (100%) (1) | Çöpler (2) | Marigold | Seabee | Puna | Other | Consolidated | |
| Gold Production | koz | 310 – 340 | 235 – 265 | 95 – 105 | — | — | 640 – 710 |
| Silver Production | Moz | — | — | — | 6.0 – 7.0 | — | 6.0 – 7.0 |
| Gold Equivalent Production | koz | 310 – 340 | 235 – 265 | 95 – 105 | 80 – 90 | — | 720 – 800 |
| Cash Cost per Ounce (3) | $/oz | 550 – 600 | 810 – 860 | 525 – 575 | 10.00 – 11.50 | — | 660 – 715 |
| Sustaining CapitalExpenditures (4) | $M | 52 | 53 | 11 | 19 | — | 135 |
| Capitalized Stripping / Capitalized Development | $M | 9 | 47 | 19 | 13 | — | 88 |
| Sustaining Exploration Expenditures | $M | 2 | 7 | 1 | 1 | — | 11 |
| General & Administrative (5) | $M | — | — | — | — | 30 – 35 | 30 – 35 |
| Share Based Compensation (5) | $M | — | — | — | — | 15 – 20 | 15 – 20 |
| All-In Sustaining Cost per Ounce (3) | $/oz | 760 – 810 | 1,250 – 1,290 | 860 – 910 | 16.00 – 17.50 | — | 1,050 – 1,110 |
| Growth Capital Expenditures | $M | 26 | — | 7 | — | — | 33 |
| Growth Exploration and Development Expenditures(6) | $M | 31 | 11 | 7 | — | 5 | 54 |
| Total Growth Capital | $M | 57 | 11 | 14 | — | 5 | 87 |
| (1) | Figures may not add due to rounding |
| (2) | Figures are reported on a 100% basis. Çöpler is 80% owned by SSR Mining. |
| (3) | SSR Mining reports the non-GAAP financial measures of cash costs and AISC per ounce of gold and silver sold to manage and evaluate operating performance at Çöpler, Marigold, Seabee and Puna. Refer to Section 13 “Non-GAAP Financial Measures”. |
| (4) | Excludes sustaining exploration expenditures. Includes $9.5 million oxygen plant lease payment at Çöpler. |
| (5) | General and administrative expenses exclude share-based compensation, which is reported separately. |
| (6) | Growth exploration and development expenditures are shown on a 100% basis, of which SSR Mining attributable amount totals $46 million. |
| (7) | All figures in U.S. dollars, unless otherwise noted. Gold equivalent figures for 2021 operating guidance are based on a gold-to-silver ratio of 76:1. Cash costs and capital expenditures guidance is based on an oil price of $45 per barrel and an exchange rate of 1.30 Canadian dollars to one U.S. dollar and 7.5 Turkish lira to one U.S. dollar. |
2021 Priority Operational and Development Catalysts
Çöpler:
- Flotation circuit construction, with expected ramp-up beginning mid-year 2021
- Ardich exploration and concurrent development towards first production in 2023
- C2 Porphyry copper-gold exploration and advancement, focusing on an expandable development plan
Marigold:
- Ongoing cost reduction and continuous improvement initiatives
- Oxide exploration targeting higher grades and conversion at Mackay, Valmy, New Millennium, Trenton Canyon and Buffalo Valley
- Sulfide exploration and evaluation
Seabee:
- Increase mining rates to exploit latent mill capacity
- Gap Hanging Wall Mineral Resource conversion
- Seabee and Fisher exploration and resource development
Puna:
- Continue steady state production with focus on increasing productivity
- Achieve and sustain mill throughput rates above 4,000 tonnes per day
- Implement and integrate owner-operated ore transport fleet
Free cash flow generation in 2021 is expected to be approximately 75% weighted to the second half of the year due to the timing of the ramp-up and commissioning of the flotation circuit at Çöpler, timing of capital expenditures across all sites, working capital seasonality at Seabee, and tax and royalty payments that are paid in the first half of the year.
Capital Returns
The Company’s capital allocation strategy is to balance continuing investment in high-return growth, maintaining peer leading financial strength, and providing sustainable capital returns to shareholders.
In recognition of SSR Mining’s position as a leading and sustainable free cash flow generator in the intermediate gold sector, it is the Company’s intention to return excess attributable free cash flow to shareholders through a two-tiered capital return structure. While a recurring quarterly dividend is expected to be the primary method of capital return, the Company will periodically evaluate supplementing this dividend from excess attributable free cash flow in the form of incremental dividends and/or share buyback programs.
On February 17, 2021, the Company’s Board of Directors approved its inaugural quarterly dividend payment of $0.05 per common share to be paid on March 31, 2021 to shareholders of record on March 5, 2021. The dividend was designated as an “eligible dividend” for Canadian federal and provincial income tax purposes. Dividends paid to shareholders who are non-residents of Canada will be subject to Canadian non-resident withholding taxes.
Financial and Operating Highlights
A summary of the Company’s consolidated financial and operating results for the three months and year ended December 31, 2020 and 2019 are presented below:
Management Discussion & Analysis and Conference Call
This news release should be read in conjunction with our audited Consolidated Financial Statements and our MD&A as filed with the Canadian Securities Administrators and available at www.sedar.com or our website at www.ssrmining.com.
- Conference call and webcast: Wednesday, February 17, 2021, at 5:00 pm EST.
| Toll-free in U.S. and Canada: | +1 (800) 319-4610 |
| All other callers: | +1 (416) 915-3239 |
| Webcast: | http://ir.ssrmining.com/investors/events |
- The conference call will be archived and available on our website. Audio replay will be available for two weeks by calling:
| Toll-free in U.S. and Canada: | +1 (855) 669-9658, replay code 6092 |
| All other callers: | +1 (412) 317-0088, replay code 6092 |
About SSR Mining
SSR Mining Inc. is a leading, free cash flow focused intermediate gold company with four producing assets located in the USA, Turkey, Canada, and Argentina, combined with a global pipeline of high-quality development and exploration assets in the USA, Turkey, Mexico, Peru, and Canada. In 2020, the four operating assets produced approximately 711,000 gold-equivalent ounces. SSR Mining is listed under the ticker symbol SSRM on the NASDAQ and the TSX, and SSR on the ASX.
SSR Mining Contacts:
F. Edward Farid, Executive Vice President, Chief Corporate Development Officer
Brian Martin, Director, Corporate Development & Investor Relations
SSR Mining Inc.
E-Mail: [email protected]
Phone: +1 (888) 338-0046 or +1 (604) 689-3846
To receive SSR Mining’s news releases by e-mail, please register using the SSR Mining website at www.ssrmining.com.
Cautionary Note Regarding Forward-Looking Statements
Except for statements of historical fact relating to the Company, certain statements contained in this press release constitute forward-looking information, future oriented financial information, or financial outlooks (collectively “forward-looking information”) within the meaning of Canadian securities laws. Forward-looking information may be contained in this document and the Company’s other public filings. Forward-looking information relates to statements concerning the Company’s outlook and anticipated events or results and in some cases, can be identified by terminology such as “may”, “will”, “could”, “should”, “expect”, “plan”, “anticipate”, “believe”, “intend”, “estimate”, “projects”, “predict”, “potential”, “continue” or other similar expressions concerning matters that are not historical facts.
Forward-looking information and statements in this press release are based on certain key expectations and assumptions made by the Company. Although the Company believes that the expectations and assumptions on which such forward-looking information and statements are based are reasonable, undue reliance should not be placed on the forward-looking information and statements because the Company can give no assurance that they will prove to be correct. Forward-looking information and statements are subject to various risks and uncertainties which could cause actual results and experience to differ materially from the anticipated results or expectations expressed in this press release. The key risks and uncertainties include, but are not limited to: local and global political and economic conditions; governmental and regulatory requirements and actions by governmental authorities, including changes in government policy, government ownership requirements, changes in environmental, tax and other laws or regulations and the interpretation thereof; developments with respect to the coronavirus disease 2019 (“COVID-19”) pandemic, including the duration, severity and scope of the pandemic and potential impacts on mining operations; and other risk factors detailed from time to time in the Company’s reports filed with the Canadian securities regulatory authorities.
Forward-looking information and statements in this press release include statements concerning, among other things: forecasts; outlook; timing of production; production, cost, operating and capital expenditure guidance; the Company’s intention to return excess attributable free cash flow to shareholders; the timing and implementation of the Company’s dividend policy; the granting of any supplemental dividends or the implementation of any share buyback program or other supplements to the base dividend; statements regarding plans or expectations for the declaration of future dividends and the amount thereof; future cash costs and AISC per payable ounce of gold, silver and other metals sold; the prices of gold, silver and other metals; Mineral Resources, Mineral Reserves, realization of Mineral Reserves, and the existence or realization of Mineral Resource estimates; the Company’s ability to discover new areas of mineralization; the timing and extent of capital investment at the Company’s operations; the timing and extent of capitalized stripping at the Company’s operations; the timing of production and production levels and the results of the Company’s exploration and development programs; current financial resources being sufficient to carry out plans, commitments and business requirements for the next twelve months; movements in commodity prices not impacting the value of any financial instruments; estimated production rates for gold, silver and other metals produced by the Company; the estimated cost of sustaining capital; availability of sufficient financing; receipt of regulatory approvals; the timing of studies, announcements, and analysis; the timing of construction and development of proposed mines and process facilities; ongoing or future development plans and capital replacement; estimates of expected or anticipated economic returns from the Company’s mining projects, including future sales of metals, concentrate or other products produced by the Company and the timing thereof; the Company’s plans and expectations for its properties and operations; and all other timing, exploration, development, operational, financial, budgetary, economic, legal, social, environmental, regulatory, and political matters that may influence or be influenced by future events or conditions.
Such forward-looking information and statements are based on a number of material factors and assumptions, including, but not limited in any manner to, those disclosed in any other of the Company’s filings, and include: the inherent speculative nature of exploration results; the ability to explore; communications with local stakeholders; maintaining community and governmental relations; status of negotiations and completion of transactions, including joint ventures; weather conditions at the Company’s operations; commodity prices; the ultimate determination of and realization of Mineral Reserves; existence or realization of Mineral Resources; the development approach; availability and receipt of required approvals, titles, licenses and permits; sufficient working capital to develop and operate the mines and implement development plans; access to adequate services and supplies; foreign currency exchange rates; interest rates; access to capital markets and associated cost of funds; availability of a qualified work force; ability to negotiate, finalize, and execute relevant agreements; lack of social opposition to the Company’s mines or facilities; lack of legal challenges with respect to the Company’s properties; the timing and amount of future production; the ability to meet production, cost, and capital expenditure targets; timing and ability to produce studies and analyses; capital and operating expenditures; economic conditions; availability of sufficient financing; the ultimate ability to mine, process, and sell mineral products on economically favorable terms; and any and all other timing, exploration, development, operational, financial, budgetary, economic, legal, social, geopolitical, regulatory and political factors that may influence future events or conditions. While the Company consider these factors and assumptions to be reasonable based on information currently available to the Company, they may prove to be incorrect.
The above list is not exhaustive of the factors that may affect any of the Company’s forward-looking statements and information. You should not place undue reliance on forward-looking information and statements. Forward-looking information and statements are only predictions based on the Company’s current expectations and the Company’s projections about future events. Actual results may vary from such forward-looking information for a variety of reasons including, but not limited to, risks and uncertainties disclosed in the Company’s filings on the Company’s website at www.ssrmining.com, on SEDAR at www.sedar.com, on EDGAR at www.sec.gov and on the ASX at www.asx.com.au and other unforeseen events or circumstances. Other than as required by law, the Company does not intend, and undertake no obligation to update any forward-looking information to reflect, among other things, new information or future events.
All references to “$” in this press release are to U.S. dollars unless otherwise stated.
Qualified Persons
Except as otherwise set out herein, the scientific and technical information contained in this press release relating to Çöpler has been reviewed and approved by Robert L. Clifford and Dr. Cengiz Y. Demirci, AIPG (CPG) each of whom is a qualified person under NI 43-101. Mr. Clifford is the Director, Open Pit Mine Planning and Dr. Demirci is the Vice President, Exploration. The scientific and technical information contained in this press release relating to Marigold has been reviewed and approved by Greg Gibson and James N. Carver, each of whom is a SME Registered Member and a qualified person under NI 43-101. Mr. Gibson is the General Manager and Mr. Carver is the Resource Development Manager at Marigold. The scientific and technical information contained in this press release relating Seabee has been reviewed and approved by Samuel Mah, P.Eng., and Jeffrey Kulas, P. Geo., each of whom is a qualified person under NI 43-101. Mr. Mah is the Director, Underground Mine Planning, and Mr. Kulas is the Resource Development Manager, Canada. The scientific and technical information contained in this press release relating to Puna has been reviewed and approved by Robert Gill, P.Eng., and Karthik Rathnam, MAusIMM (CP), each of whom is a qualified person under NI 43-101. Mr. Gill is the Company’s General Manager at Puna. Mr. Rathnam is the Company’s Resource Manager, Corporate.
Cautionary Note to U.S. Investors
This press release includes Mineral Reserves and Mineral Resources classification terms that comply with reporting standards in Canada and the Mineral Reserves and the Mineral Resources estimates are made in accordance with NI 43-101 – Standards of Disclosure for Mineral Projects (“NI 43-101”). NI 43-101 is a rule developed by the Canadian Securities Administrators that establishes standards for all public disclosure an issuer makes of scientific and technical information concerning mineral projects. These standards differ significantly from the requirements of the SEC set out in the SEC rules that are applicable to domestic United States reporting companies. Consequently, Mineral Reserves and Mineral Resources information included in this press release is not comparable to similar information that would generally be disclosed by domestic U.S. reporting companies subject to the reporting and disclosure requirements of the SEC. Accordingly, information concerning mineral deposits set forth herein may not be comparable with information made public by companies that report in accordance with U.S. standards.
Cautionary Note Regarding Non-GAAP Measures
This press release includes certain terms or performance measures commonly used in the mining industry that are not defined under International Financial Reporting Standards (“IFRS”), including free cash flow, cash costs and AISC per payable ounce of gold and silver sold, realized metal prices, earnings before interest, taxes, depreciation and amortization (“EBITDA”), adjusted attributable net income, adjusted basic attributable earnings per share, consolidated cash and consolidated net cash. Non-GAAP measures do not have any standardized meaning prescribed under IFRS and, therefore, they may not be comparable to similar measures employed by other companies. The Company believe that, in addition to conventional measures prepared in accordance with IFRS, certain investors use this information to evaluate the Company’s performance. The data presented is intended to provide additional information and should not be considered in isolation or as a substitute for measures of performance prepared in accordance with IFRS. Readers should refer to the endnotes in this press release for further information regarding how the Company calculates certain of these measures. Readers should also refer to the Company’s management’s discussion and analysis, available under the Company’s corporate profile at www.sedar.com or on the Company’s website at www.ssrmining.com, under the heading “Non-GAAP Financial Measures” for a more detailed discussion of how the Company calculates such measures and a reconciliation of certain measures to GAAP terms.
SOURCE SSR Mining Inc.
Original Article: https://www.prnewswire.com/news-releases/ssr-mining-reports-fourth-quarter-and-year-end-2020-results-301229574.html


