TORONTO, April 29, 2020 (GLOBE NEWSWIRE) — Alamos Gold Inc. (TSX:AGI; NYSE:AGI) (“Alamos” or the “Company”) today reported its financial results for the quarter ended March 31, 2020.
“We had a solid start to the year amidst a challenging environment with the COVID-19 pandemic. With strong operational performances at Island Gold and Mulatos, we exceeded the top end of our first quarter production guidance while completing several critical path items on the lower mine expansion at Young-Davidson,” said John A. McCluskey, President and Chief Executive Officer.
“Despite the temporary challenges with COVID-19, Alamos remains well positioned for a strong second half of the year. We expect to start ramping up operations at Island Gold in a safe manner in early May and will do the same at Mulatos once the government suspension has been lifted. We are making solid progress on the Phase III expansion study at Island Gold and the lower mine expansion at Young-Davidson with both expected to be completed in the middle of this year. We expect both will be significant catalysts for the Company. Combined with a robust balance sheet and strong free cash flow growth starting in the second half of this year, the outlook for Alamos has never been stronger,” Mr. McCluskey added.
First Quarter 2020
- Produced 110,800 ounces of gold, driven by strong performances at Island Gold and Mulatos
- Island Gold produced 38,800 ounces of gold and generated quarterly mine-site free cash flow1 of $19.6 million
- Achieved record underground mining rates of 1,240 tonnes per day (“tpd”) in the first quarter at Island Gold, a 14% improvement over the prior year period
- Mulatos produced 42,600 ounces of gold and generated $14.1 million of mine-site free cash flow1
- In response to COVID-19, proactively implemented preventative measures across all operations; to date, the Company has not had any confirmed cases of COVID-19 among any of its employees or contractors
- Commenced the tie-in of the upper and lower mines at Young-Davidson and completed several critical path items during and subsequent to the quarter. This included connecting the upper and lower mine ramp system and connecting the upper and lower portions of the Northgate shaft through removal of the rock pentice. The tie-in is anticipated to be completed in July 2020, a slight delay from June reflecting labour and productivity constraints related to COVID-19
- Sold 111,854 ounces of gold at an average realized price of $1,582 per ounce for revenues of $176.9 million
- Cash flow from operating activities of $56.6 million ($81.7 million, or $0.21 per share, before changes in working capital1)
- Consolidated total cash costs1 of $759 per ounce and all-in sustaining costs (“AISC”)1 of $1,010 per ounce were both at the low end of 2020 annual guidance, driven by lower costs at Mulatos and Island Gold
- Reported adjusted net earnings1 of $29.4 million, or $0.08 per share1, which includes adjustments for unrealized foreign exchange losses of $41.9 million, of which $36.8 million is recorded within deferred taxes, partially offset by other one-time gains of $0.2 million
- Realized a net loss of $12.3 million, or $0.03 per share
- Drew $100.0 million from the Company’s credit facility, leaving $400.0 million undrawn at March 31, 2020
- Ended the quarter with cash and cash equivalents of $214.7 million and equity securities of $15.6 million
- Repurchased a 3% net smelter return (“NSR”) royalty payable on the majority of Mineral Reserves and Resources at Island Gold for cash consideration of $54.8 million. This has reduced the effective royalty rate from 4.4% to 2.2% on Mineral Reserves, and has reduced 2020 total cash costs at Island Gold by approximately $45 per ounce
- Paid a quarterly dividend of $5.9 million, representing a 50% increase in the quarterly dividend to an annual rate of $0.06 per share, and adopted a Dividend Reinvestment and Share Purchase Plan (“DRIP”)
- Repurchased 1,133,561 common shares at a cost of $5.5 million, or $4.90 per share, under the Company’s Normal Course Issuer Bid (“NCIB”)
- Reported updated year-end 2019 Mineral Reserves and Resources, highlighted by a substantial increase in Mineral Reserves and Resources at Island Gold totaling 0.9 million ounces
- Announced the temporary suspension at Island Gold on March 24, 2020 and Mulatos on April 2, 2020; subsequent to quarter-end, withdrew 2020 guidance
(1) Refer to the “Non-GAAP Measures and Additional GAAP Measures” disclosure at the end of this press release and associated MD&A for a description and calculation of these measures.
Highlight Summary
| Three Months Ended March 31, | ||||||
| 2020 | 2019 | |||||
| Financial Results (in millions) | ||||||
| Operating revenues | $176.9 | $156.1 | ||||
| Cost of sales (1) | $120.3 | $127.0 | ||||
| Earnings from operations | $46.2 | $18.7 | ||||
| Earnings before income taxes | $40.5 | $20.6 | ||||
| Net (loss) earnings | ($12.3 | ) | $16.8 | |||
| Adjusted net earnings (2) | $29.4 | $10.3 | ||||
| Earnings before interest, depreciation and amortization (2) | $76.7 | $60.5 | ||||
| Cash provided by operations before working capital and cash taxes(2) | $81.7 | $62.1 | ||||
| Cash provided by operating activities | $56.6 | $42.4 | ||||
| Capital expenditures (sustaining) (2) | $17.5 | $16.1 | ||||
| Capital expenditures (growth) (2) (3) | $41.3 | $34.1 | ||||
| Capital expenditures (capitalized exploration) (4) | $4.5 | $3.1 | ||||
| Operating Results | ||||||
| Gold production (ounces) | 110,800 | 125,300 | ||||
| Gold sales (ounces) | 111,854 | 119,705 | ||||
| Per Ounce Data | ||||||
| Average realized gold price | $1,582 | $1,304 | ||||
| Average spot gold price (London PM Fix) | $1,583 | $1,304 | ||||
| Cost of sales per ounce of gold sold (includes amortization) (1) | $1,076 | $1,061 | ||||
| Total cash costs per ounce of gold sold (2) | $759 | $732 | ||||
| All-in sustaining costs per ounce of gold sold (2) | $1,010 | $957 | ||||
| Share Data | ||||||
| (Loss) earnings per share, basic and diluted | ($0.03 | ) | $0.04 | |||
| Adjusted earnings per share, basic and diluted(2) | $0.08 | $0.03 | ||||
| Weighted average common shares outstanding (basic) (000’s) | 391,341 | 389,735 | ||||
| Financial Position (in millions) | ||||||
| Cash and cash equivalents (5) | $214.7 | $182.8 | ||||
| Long-term debt (5) | $100.0 | $— |
(1) Cost of sales includes mining and processing costs, royalties, and amortization expense.
(2) Refer to the “Non-GAAP Measures and Additional GAAP Measures” disclosure at the end of this press release and associated MD&A for a description and calculation of these measures.
(3) Includes growth capital from operating sites and excludes the Island Gold royalty repurchase of $54.8 million.
(4) Includes capitalized exploration at Mulatos and Island Gold.
(5) Comparative cash and cash equivalents and long-term debt balance as at December 31, 2019.
| Three Months Ended March 31, | ||||||
| 2020 | 2019 | |||||
| Gold production (ounces) | ||||||
| Young-Davidson | 28,700 | 45,000 | ||||
| Mulatos | 42,600 | 38,900 | ||||
| Island Gold | 38,800 | 35,600 | ||||
| El Chanate (1) | 700 | 5,800 | ||||
| Gold sales (ounces) | ||||||
| Young-Davidson | 28,905 | 43,996 | ||||
| Mulatos | 43,822 | 36,089 | ||||
| Island Gold | 39,127 | 33,585 | ||||
| El Chanate (1) | — | 6,035 | ||||
| Cost of sales (in millions)(2) | ||||||
| Young-Davidson | $43.8 | $56.9 | ||||
| Mulatos | $46.0 | $33.8 | ||||
| Island Gold | $30.5 | $28.6 | ||||
| El Chanate (1) | $— | $7.7 | ||||
| Cost of sales per ounce of gold sold (includes amortization) | ||||||
| Young-Davidson | $1,515 | $1,293 | ||||
| Mulatos | $1,050 | $937 | ||||
| Island Gold | $780 | $852 | ||||
| El Chanate (1) | $— | $1,276 | ||||
| Total cash costs per ounce of gold sold (3) | ||||||
| Young-Davidson | $1,093 | $839 | ||||
| Mulatos | $812 | $743 | ||||
| Island Gold | $452 | $497 | ||||
| El Chanate (1) | $— | $1,193 | ||||
| Mine-site all-in sustaining costs per ounce of gold sold (3),(4) | ||||||
| Young-Davidson | $1,242 | $1,068 | ||||
| Mulatos | $958 | $809 | ||||
| Island Gold | $670 | $649 | ||||
| El Chanate (1) | $— | $1,193 | ||||
| Capital expenditures (sustaining, growth and capitalized exploration) (in millions)(3) | ||||||
| Young-Davidson | $27.0 | $22.3 | ||||
| Mulatos(5) | $7.4 | $12.6 | ||||
| Island Gold (6) | $22.1 | $12.4 | ||||
| Other | $6.8 | $6.0 |
(1) El Chanate transitioned to the reclamation phase of the mine life in the fourth quarter of 2019. Incremental production is a result of rinsing the leach pad. Gold sales from El Chanate in 2020 are not included in revenue and cost of sales.
(2) Cost of sales includes mining and processing costs, royalties and amortization.
(3) Refer to the “Non-GAAP Measures and Additional GAAP Measures” disclosure at the end of this press release and associated MD&A for a description and calculation of these measures.
(4) For the purposes of calculating mine-site all-in sustaining costs, the Company does not include an allocation of corporate and administrative and share based compensation expenses.
(5) Includes capitalized exploration at Mulatos of $0.5 for the three months ended March 31, 2020 (for the three months ended March 31, 2019 – $nil).
(6) Includes capitalized exploration at Island Gold of $4.0 million for the three months ended March 31, 2020 (for the three months ended March 31, 2019 – $3.1 million), and excludes the royalty repurchase of $54.8 million.
Management’s Response to the COVID-19 Pandemic
The World Health Organization declared COVID-19 a pandemic on March 11, 2020. The Company responded rapidly and proactively to COVID-19 and has implemented several initiatives to help protect the health and safety of our employees, their families and the communities in which we operate. To date, Alamos has not had any confirmed cases of COVID-19 among any of its employees or contractors.
Specifically, each of our operating mine sites has activated established crisis management plans and developed site-specific plans that enable them to meet and respond to changing conditions associated with COVID-19. The Company is adopting the advice of public health authorities and adhering to government regulations with respect to COVID-19 in the jurisdictions in which it operates.
The following measures have been instituted across the Company to prevent the potential spread of the virus:
- Medical screening for all personnel prior to entry to site for symptoms of COVID-19
- Training on proper hand hygiene and self protection
- Remote work options have been implemented for eligible employees
- Mandatory use of PPE for cleaners, nursing staff and security personnel
- Rigid camp and site hygiene protocols have been instituted and are being followed
- Social distancing practices have been implemented for all meetings, huddles and transportation
- Elimination of all non-essential business travel
- Required 14-day quarantine for any employees returning from out of country travel
Impact on Operations
In order to protect nearby communities and align with government requirements, two of the Company’s mines have been placed temporarily on care and maintenance. These mines are positioned to safely and quickly resume normal operations once restrictions are lifted.
At Island Gold, operations were suspended on March 25, 2020 given the unique set up of the operation with a large portion of the workforce operating on a fly-in, fly-out basis and being housed within a camp located directly within the local community. A number of essential employees remain on site to provide security, water management and other environmental protection activities. The Company expects to begin a phased restart of the operations in early May 2020.
Operations at Mulatos were suspended in early April following a mandate by the Mexican government to suspend all non-essential businesses in response to the COVID-19 crisis. The original suspension period has been extended to May 31, 2020; however, the government is reviewing the possibility of lifting restrictions in certain regions on May 18, 2020, provided those regions remain without positive cases. Essential employees remain on site to continue processing and other critical site activities. The Company will look to restart mining, crushing and stacking ore on the leach pad at the conclusion of the government mandated suspension. Although mining activities were suspended in April, the Company continues to recover gold from the leach pad given the significant amount of contained ounces stacked in the first quarter.
To date, operating activities at Young-Davidson have not been significantly impacted with mining and processing activities and work on the lower mine expansion ongoing. However, as a result of labour and productivity constraints resulting from the above noted health and safety measures, the lower mine expansion project is now expected to be completed in July 2020, a slight delay from previous guidance of June 2020.
Impact on 2020 Guidance
Given the downtime at both Island Gold and Mulatos, and the potential for further voluntary or government-mandated business interruptions, the Company withdrew its 2020 production, cost and capital guidance on April 2, 2020.
Outlook and Strategy
| 2020 Guidance for Reference Purposes (Withdrawn in April 2020) | ||||||
| Young-Davidson | Island Gold | Mulatos | Other (2) | Total | ||
| Gold production (000’s ounces) | 145-160 | 130-145 | 150-160 | 425-465 | ||
| Cost of sales, including amortization (in millions) (4) | $207 | $116 | $168 | — | $ 491 | |
| Cost of sales, including amortization ($ per ounce) (4) | $1,360 | $840 | $1,085 | — | $ 1,103 | |
| Total cash costs ($ per ounce) (1)(5) | $910-950 | $480-520 | $840-880 | — | $757-797 | |
| All-in sustaining costs ($ per ounce) (1)(5) | $1,007-1,047 | |||||
| Mine-site all-in sustaining costs ($ per ounce) (1)(3)(5) | $1,110-1,150 | $740-780 | $940-980 | — | — | |
| Amortization costs ($ per ounce) (1) | $430 | $340 | $225 | — | $ 340 | |
| Capital expenditures (in millions) | ||||||
| Sustaining capital(1) | $30-35 | $35-40 | $15-20 | — | $80-95 | |
| Growth capital(1) | $45-50 | $15-20 | $5 | $10 | $75-85 | |
| Capitalized exploration(1) | $1 | $19 | — | $5 | $ 25 | |
| Total capital expenditures and capitalized exploration(1) | $76-86 | $69-79 | $20-25 | $15 | $180-205 |
(1) Refer to the “Non-GAAP Measures and Additional GAAP” disclosure at the end of this press release and associated MD&A for a description of these measures.
(2) Includes growth capital and capitalized exploration at the Company’s development projects (Turkey, Lynn Lake, Esperanza and Quartz Mountain).
(3) For the purposes of calculating mine-site all-in sustaining costs at individual mine sites, the Company does not include an allocation of corporate and administrative and share based compensation expenses to the mine sites.
(4) Cost of sales includes mining and processing costs, royalties, and amortization expense, and is calculated based on the mid-point of guidance.
(5) On March 16, 2020, the Company updated total cash cost and AISC guidance to reflect the repurchase and cancellation of a royalty at Island Gold
The Company’s long-term strategic objective is to generate increasing returns for its shareholders through low-cost production and free cash flow growth from its existing operations and portfolio of development projects. The Company was successful in achieving these objectives in 2019, with production of 494,500 ounces of gold and a 10% reduction in total cash costs driving record operating cash flow.
With the strong start to 2020, the Company exceeded the top end of first quarter 2020 guidance with production of 110,800 ounces. In addition, total cash costs and all-in sustaining costs in the first quarter were at the low end of annual guidance issued in December 2019, driving strong margins and cash flow. However, given the temporary suspension of operations at Mulatos and Island Gold, the Company made the decision to withdraw its 2020 production and cost guidance on April 2, 2020.
Despite the temporary challenges associated with COVID-19, the Company’s strong outlook remains intact with several significant near term positive catalysts. These include the Phase III expansion study of Island Gold which is expected to be competed mid-2020 and showcase a larger, very profitable, long-life operation; the completion of the lower mine expansion at Young-Davidson in July; and the transition to strong company-wide free cash flow starting in the second half of 2020.
Island Gold and Mulatos are well positioned for a quick and safe resumption of operations. The Company expects to begin a phased restart of operations at Island Gold in early May 2020. At Mulatos, operations remain suspended as per the mandate by the Mexican government to suspend all non-essential businesses. The suspension has been extended to May 31, 2020; however, the government is reviewing the possibility of lifting restrictions in certain regions that have not been affected on May 18, 2020. The Company has scaled down mining and other activities and continues to recover gold from the leach pad given the significant leach pad inventory. The Company is not aware of any confirmed cases of COVID-19 in the region surrounding Mulatos and will look to restart full operations once the government suspension is lifted. Following the resumption of normal operating activities at both Island Gold and Mulatos, the Company will provide updated 2020 guidance.
At Young-Davidson, the lower mine expansion is in the final stages with the tie-in having commenced in February 2020. Several critical path items have recently been completed including the installation of the crusher, the breakthrough of the upper and lower mine ramp system and connecting the upper and lower portions of the Northgate shaft through removal of the rock pentice. The lower mine tie-in is now expected to be completed in July 2020, given some labour and productivity constraints related to COVID-19.
During this previously guided downtime of the Northgate shaft, the Company continues to truck ore to surface from the upper mine at a rate of 3,000 tpd. Following completion of the tie-in in July, underground mining rates are anticipated to increase to 7,500 tpd by the end of 2020. This is expected to drive production higher and costs significantly lower at Young-Davidson in the second half of 2020.
The Phase III expansion study at Island Gold is scheduled to be completed by mid-2020. The expansion study will incorporate the recently released 2019 year end Mineral Reserve and Resource update for Island Gold which included substantial growth in Mineral Reserves and Resources. The Company expects this study will showcase Island Gold as a larger, more profitable, long-life operation.
The surface and underground exploration program at Island Gold continued through most of the first quarter but was temporarily suspended. The 2020 program is focused on continuing to define new near mine Mineral Resources across the two-kilometre long Island Gold Main Zone which remains open laterally and down-plunge across multiple areas of focus.
At Mulatos, the Company has progressed detailed engineering and project design for La Yaqui Grande, and expects to make a construction decision on the project during the second quarter of 2020. La Yaqui Grande is fully permitted having received the approval of the environmental impact assessment during the second quarter of 2019 and the Change in Land Use permit in July 2019.
The Company’s liquidity remains strong, ending the quarter with $214.7 million of cash and cash equivalents. This reflects the repurchase of the Island Gold royalty in March for $54.8 million and the drawdown of $100.0 million on the Company’s $500.0 million revolving credit facility. The Company has no debt other than the $100.0 million drawn on the revolving facility and is well positioned to fund its internal growth initiatives. The Company expects to transition to strong free cash flow generation in the second half of 2020.
First Quarter 2020 Results
Young-Davidson Financial and Operational Review
| Three Months Ended March 31, | ||||||
| 2020 | 2019 | |||||
| Gold production (ounces) | 28,700 | 45,000 | ||||
| Gold sales (ounces) | 28,905 | 43,996 | ||||
| Financial Review (in millions) | ||||||
| Operating Revenues | $45.7 | $57.4 | ||||
| Cost of sales (1) | $43.8 | $56.9 | ||||
| Earnings from operations | $1.9 | $0.5 | ||||
| Cash provided by operating activities | $8.1 | $22.9 | ||||
| Capital expenditures (sustaining) (2) | $4.2 | $10.0 | ||||
| Capital expenditures (growth) (2) | $22.8 | $12.3 | ||||
| Mine-site free cash flow (2) | ($18.9 | ) | $0.6 | |||
| Cost of sales, including amortization per ounce of gold sold (1) | $1,515 | $1,293 | ||||
| Total cash costs per ounce of gold sold (2) | $1,093 | $839 | ||||
| Mine-site all-in sustaining costs per ounce of gold sold (2),(3) | $1,242 | $1,068 | ||||
| Underground Operations | ||||||
| Tonnes of ore mined | 390,367 | 588,634 | ||||
| Tonnes of ore mined per day | 4,290 | 6,540 | ||||
| Average grade of gold (4) | 2.17 | 2.54 | ||||
| Metres developed | 3,202 | 2,900 | ||||
| Mill Operations | ||||||
| Tonnes of ore processed | 464,744 | 609,927 | ||||
| Tonnes of ore processed per day | 5,107 | 6,777 | ||||
| Average grade of gold (4) | 1.93 | 2.47 | ||||
| Contained ounces milled | 28,851 | 48,515 | ||||
| Average recovery rate | 91 | % | 90 | % |
(1) Cost of sales includes mining and processing costs, royalties and amortization.
(2) Refer to the “Non-GAAP Measures and Additional GAAP Measures” disclosure at the end of this press release and associated MD&A for a description and calculation of these measures.
(3) For the purposes of calculating mine-site all-in sustaining costs, the Company does not include an allocation of corporate and administrative and share based compensation expenses.
(4) Grams per tonne of gold (“g/t Au”).
Young-Davidson produced 28,700 ounces of gold in the first quarter of 2020, a decrease from the same period in 2019 due to lower tonnes mined and processed as a result of shutting down the Northgate shaft in early February to complete the lower mine construction and tie-in. As previously guided, ore was trucked to surface from the upper mine during the downtime of the Northgate shaft which resulted in lower tonnes mined during February and March.
Underground mining rates averaged 4,290 tpd in the first quarter, with January mining rates in line with the prior year period at 6,700 tpd, lowering to 3,000 tpd in the months of February and March using the ramp system. Tonnes mined in February and March exceeded budgeted rates of 2,500 tpd.
Mill throughput was 5,107 tpd in the first quarter, a decrease from the same period of 2019 due to the lower mining rates in February and March of this year. Mill throughput was supplemented by existing lower grade stockpiles in the quarter, which have essentially been exhausted at the end of the quarter.
Mining activities in the first quarter focused on remnant stopes in the upper part of the mine to facilitate trucking up the ramp. The average mined grade was 2.17 g/t Au in the quarter.
Lower Mine Construction and Tie-In
Substantial progress on the lower mine expansion was made in the first quarter of 2020, despite the personnel challenges resulting from COVID-19 discussed previously. The main activities included the following:
- Completed the main ramp system to the lower mine infrastructure
- 8940 level loading pocket, including the conveyor and ore/waste bins, completed and ready for commissioning
- 8930 level ore and waste loadout substantially completed
- Installation of the hangers and trays for the main conveyor from the crusher loadout level to the top of the shaft bins are two-thirds complete
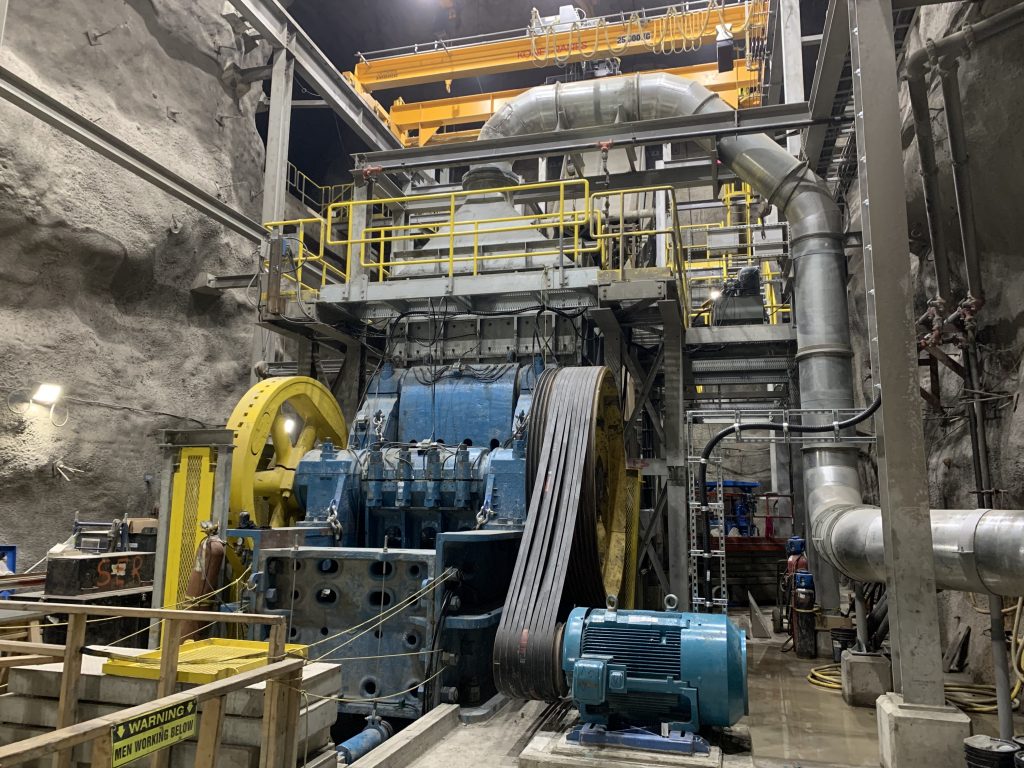
- Crusher installed and ready for commissioning
- Skips, ropes and shaft bottom steel has been removed from the mid shaft loading pocket
- Pentice excavation drilled off and blasted, and ground support completed by the end of April
As a result of COVID-19-related labour and productivity challenges, the tie-in is now expected to be completed in July 2020. All supplies and equipment required to complete the tie-in are on site. Remaining activities to be completed in the second quarter include the following:
- Completion of the 9025 rockbreaker station and coarse ore bin
- Permanent installation and changeover of new ropes and installation of new skips
- Completion of the 8930 loadout, including conveyor drive
Lower mine crusher
A photo accompanying this announcement is available at https://www.globenewswire.com/NewsRoom/AttachmentNg/41234b15-f8f8-4540-9647-7643964f6d5d
Financial Review
First quarter revenues of $45.7 million were 20% lower than the prior year quarter, reflecting a 34% decrease in ounces sold, partially offset by a higher realized gold price. Ounces sold were lower due to lower mining rates in February and March during the temporary shutdown of the Northgate shaft to enable completion of the lower mine tie-in.
Cost of sales (which includes mining and processing costs, royalties, and amortization expense) of $43.8 million in the first quarter were lower than the comparative quarter in 2019, due to lower mining and processing rates during the tie-in of the upper and lower mine. Underground mining costs increased to CAD$77 per tonne as result of a combination of increased costs relating to hauling rather than skipping ore to surface and the impact of fixed costs on lower mining rates.
Total cash costs of $1,093 per ounce in the first quarter were higher than the comparative period last year due to higher mining costs per tonne, and lower grades mined. Mine-site AISC of $1,242 per ounce in the first quarter were higher than the comparative quarter in 2019, reflecting the impact of higher total cash costs. Sustaining capital spending in the quarter was lower than the prior year period, as the focus in the first quarter of 2020 was the lower mine construction and tie-in.
Capital expenditures were $27.0 million in the first quarter. This included $4.2 million of sustaining capital and $22.8 million of growth capital. Growth capital spending included lower mine construction, as well as work on the north dam and east dam for the TIA 1 tailings project.
Consistent with planned downtime and capital spending on the lower mine expansion, mine-site free cash flow at Young-Davidson was negative $18.9 million in the first quarter. With declining capital spending following the completion of the lower mine expansion in July 2020, and a corresponding increase in gold production and lower operating costs as mining rates ramp up, Young-Davidson is expected to generate strong free cash flow starting in the second half of 2020.
Island Gold Financial and Operational Review
| Three Months Ended March 31, | ||||||
| 2020 | 2019 | |||||
| Gold production (ounces) | 38,800 | 35,600 | ||||
| Gold sales (ounces) | 39,127 | 33,585 | ||||
| Financial Review (in millions) | ||||||
| Operating Revenues | $61.9 | $43.8 | ||||
| Cost of sales (1) | $30.5 | $28.6 | ||||
| Earnings from operations | $31.2 | $15.0 | ||||
| Cash provided by operating activities | $41.7 | $29.0 | ||||
| Capital expenditures (sustaining) (2) | $8.5 | $5.1 | ||||
| Capital expenditures (growth) (2) | $9.6 | $4.2 | ||||
| Capital expenditures (capitalized exploration) (2) | $4.0 | $3.1 | ||||
| Mine-site free cash flow (2) | $19.6 | $16.6 | ||||
| Cost of sales, including amortization per ounce of gold sold (1) | $780 | $852 | ||||
| Total cash costs per ounce of gold sold (2) | $452 | $497 | ||||
| Mine-site all-in sustaining costs per ounce of gold sold (2),(3) | $670 | $649 | ||||
| Underground Operations | ||||||
| Tonnes of ore mined | 112,881 | 97,513 | ||||
| Tonnes of ore mined per day (“tpd”) | 1,240 | 1,083 | ||||
| Average grade of gold (4) | 11.69 | 11.40 | ||||
| Metres developed | 1,952 | 1,557 | ||||
| Mill Operations | ||||||
| Tonnes of ore processed | 105,927 | 101,997 | ||||
| Tonnes of ore processed per day | 1,164 | 1,133 | ||||
| Average grade of gold (4) | 11.73 | 11.11 | ||||
| Contained ounces milled | 39,945 | 36,441 | ||||
| Average recovery rate | 97 | % | 97 | % |
(1) Cost of sales includes mining and processing costs, royalties and amortization.
(2) Refer to the “Non-GAAP Measures and Additional GAAP Measures” disclosure at the end of this press release and associated MD&A for a description and calculation of these measures.
(3) For the purposes of calculating mine-site all-in sustaining costs, the Company does not include an allocation of corporate and administrative and share based compensation expenses.
(4) Grams per tonne of gold (“g/t Au”).
Island Gold produced 38,800 ounces in the first quarter, a 9% increase from the comparative period in 2019, despite losing approximately one week of mining and processing as the mine suspended operations on March 25, 2020 in response to COVID-19.
Underground mining rates were 1,240 tpd in the first quarter, a 14% improvement compared to the prior year period and above guidance of 1,200 tpd, despite the one week downtime at the end of the quarter. Underground grades mined averaged 11.69 g/t Au in the quarter, or 3% higher than the comparative quarter and higher than guidance, due to mine sequencing.
Mill throughput of 1,164 tpd in the first quarter was higher than the prior year period as a result of higher tonnes mined. Prior to the temporary suspension, milling rates were 1,261 tpd, ahead of guidance. Mill recoveries were 97% in the first quarter, in line with the prior year quarter and guidance.
Financial Review
Island Gold generated record revenues of $61.9 million in the first quarter, an increase of 41% compared to the prior year period, reflecting both an increase in ounces sold and a higher realized gold price.
Cost of sales (includes mining and processing costs, royalties, and amortization expense) of $30.5 million in the first quarter were 7% higher than the comparative period in 2019, reflecting more ounces sold, offset by lower unit mining costs. On a per ounce basis, cost of sales decreased 8%, driven by higher grades mined and lower amortization charges. Amortization per ounce decreased compared to 2019 as a result of additional ounces reported in the 2019 Mineral Reserves and Resources statement.
Total cash costs were $452 per ounce in the first quarter, a 9% improvement from the comparative quarter last year, driven by higher grades mined partially offset by higher mining costs. In addition, the Company was notified during the quarter that it has been approved for the Northern Industrial Electrical Rebate (NIER), which is expected to reduce electricity costs by approximately 20% going forward. Mine-site AISC of $670 per ounce in the first quarter were 3% higher than the prior year period due to the timing of sustaining capital expenditures.
During the quarter, the Company acquired and canceled a 3% NSR royalty payable on a majority of production from the Island Gold mine for cash consideration of $54.8 million. The royalty was applicable to all future gold production from the Goudreau Lake claims, which comprise the majority of the Island Gold deposit. As of December 31, 2019, these claims contained 0.9 million ounces of Mineral Reserves, representing 71% of Island Gold’s total Mineral Reserves, and 1.1 million ounces of Inferred Mineral Resources. The acquisition of the royalty is expected to decrease 2020 total cash costs by $45 per ounce, based on a $1,700 per ounce gold price. In addition, the acquisition reduces the effective NSR royalty rate on Island Gold’s Mineral Reserves to 2.2% from 4.4%.
Total capital expenditures, excluding the royalty repurchase, were $22.1 million in the first quarter. Spending was focused on lateral development, camp improvements, tailings construction, and the Phase III study. This included $8.5 million of sustaining capital and $13.6 million of growth capital. Growth capital is inclusive of $4.0 million of capitalized exploration.
Island Gold generated mine-site free cash flow of $19.6 million during the first quarter, excluding the royalty repurchase, driven by strong gold production and increased operating margins. The Company expects to resume production activities in a phased approach starting in early May.
Mulatos Financial and Operational Review
| Three Months Ended March 31, | ||||||
| 2020 | 2019 | |||||
| Gold production (ounces) | 42,600 | 38,900 | ||||
| Gold sales (ounces) | 43,822 | 36,089 | ||||
| Financial Review (in millions) | ||||||
| Operating Revenues | $69.3 | $47.1 | ||||
| Cost of sales (1) | $46.0 | $33.8 | ||||
| Earnings from operations | $22.0 | $12.4 | ||||
| Cash provided by operating activities | $21.5 | $0.6 | ||||
| Capital expenditures (sustaining) (2) | $4.8 | $1.0 | ||||
| Capital expenditures (growth) (2) | $2.1 | $11.6 | ||||
| Capital expenditures (capitalized exploration) (2) | $0.5 | $— | ||||
| Mine-site free cash flow (2) | $14.1 | ($12.0 | ) | |||
| Cost of sales, including amortization per ounce of gold sold (1) | $1,050 | $937 | ||||
| Total cash costs per ounce of gold sold (2) | $812 | $743 | ||||
| Mine site all-in sustaining costs per ounce of gold sold (2),(3) | $958 | $809 | ||||
| Open Pit Operations | ||||||
| Tonnes of ore mined – open pit (4) | 1,918,464 | 1,835,733 | ||||
| Total waste mined – open pit (6) | 2,338,917 | 1,977,839 | ||||
| Total tonnes mined – open pit | 4,257,380 | 3,813,572 | ||||
| Waste-to-ore ratio (operating) | 0.59 | 0.51 | ||||
| Crushing and Heap Leach Operations | ||||||
| Tonnes of ore stacked | 2,033,111 | 1,875,556 | ||||
| Average grade of gold processed (5) | 1.25 | 0.98 | ||||
| Contained ounces stacked | 81,933 | 59,174 | ||||
| Average recovery rate | 52 | % | 66 | % | ||
| Ore crushed per day (tonnes) – combined | 22,342 | 20,800 |
(1) Cost of sales includes mining and processing costs, royalties and amortization.
(2) Refer to the “Non-GAAP Measures and Additional GAAP Measures” disclosure at the end of this press release and associated MD&A for a description and calculation of these measures.
(3) For the purposes of calculating mine-site all-in sustaining costs, the Company does not include an allocation of corporate and administrative and share based compensation expenses.
(4) Includes ore stockpiled during the quarter.
(5) Grams per tonne of gold (“g/t Au”).
(6) Total waste mined includes operating waste and capitalized stripping.
Mulatos produced 42,600 ounces in the first quarter, a 10% increase from the comparative period in 2019, driven by higher grades mined and more tonnes stacked. Contained ounces stacked increased 38% in the quarter, reflecting higher grade ore from Cerro Pelon being stacked on the leach pad. Mining activities were suspended in April as a result of the COVID-19 related government decree requiring the suspension of non-essential businesses. The Company has scaled down mining and other activities and continues to recover gold from the leach pad given the significant leach pad inventory.
Total tonnes mined increased compared to the first quarter of 2019, driven by increased stripping activities at Cerro Pelon. The excess tonnes above the life-of-mine waste-to-ore ratio were capitalized in the period and are not included in the operating waste-to-ore ratio of 0.59:1 for the quarter.
Total crusher throughput in the first quarter averaged 22,342 tpd for a total of 2,033,111 tonnes stacked at a grade of 1.25 g/t Au. Grades stacked were 28% higher than in the comparative period of 2019, reflecting the contribution of higher grade ore from Cerro Pelon. The recovery rate of 52% in the first quarter was mainly impacted by the timing of stacking of higher grade ore, which is expected to be recovered throughout 2020.
Financial Review
First quarter revenues of $69.3 million were 47% higher than the prior year quarter as a result of both higher realized gold prices and an increase in ounces sold.
Cost of sales (includes mining and processing costs, royalties, and amortization expense) were $46.0 million in the first quarter, $12.2 million higher than the prior year period due to a higher number of tonnes mined, higher unit costs, and more ounces sold. On a per ounce basis, cost of sales were slightly higher in the first quarter of 2019 driven by higher mining costs associated with longer haulage distances and a higher waste to ore ratio, partially offset by higher grades processed. This also drove total cash costs higher to $812 per ounce.
Total capital spending for the quarter was $7.4 million, of which $4.8 million was sustaining capital primarily comprised of capitalized stripping in both the Mulatos and Cerro Pelon pits to benefit future periods. The higher sustaining capital spending contributed to an increase in mine-site AISC to $958 per ounce compared to the prior year period of $809 per ounce. Capital spending was lower than the comparative period in 2019 given the prior year capital included construction capital for Cerro Pelon.
Mulatos generated mine-site free cash-flow of $14.1 million in the first quarter, a significant improvement from the prior year period. The increase in cash flow was driven by an increase in ounces sold, higher operating margins as gold prices increased, and lower capital spending.
First Quarter 2020 Development Activities
Kirazlı (Çanakkale, Turkey)
On October 14, 2019, the Company suspended all construction activities on its Kirazlı project pending the renewal of its Turkish mining concessions which expired on October 13, 2019. Although the mining concessions have not been revoked and can be renewed following this expiration date, no further construction activities can be completed until the concessions have been renewed.
The Company has met all the regulatory requirements and conditions for the concessions to be renewed and reasonably expected the renewal by the expiration date. The communities local to the Kirazlı project remain supportive. As such, the Company is working with the Turkish Department of Energy and Natural Resources on securing the renewal of the mining concessions which will allow for a resumption of construction activities. The renewal is required from the same government department that granted the Operating Permit for Kirazlı in March 2019. The Company will provide updated guidance on the construction schedule and budget for Kirazlı following the receipt of the concession renewal and resumption of construction activities.
During the first quarter of 2020, the Company spent $1.6 million at Kirazlı, with an additional $1.4 million of working capital payments from prior periods.
Mulatos District (Sonora, Mexico)
La Yaqui Grande
The Company received approval of the environmental impact assessment (“MIA”) for La Yaqui Grande during the second quarter of 2019 and the Change in Land Use permit in the third quarter of 2019. The Company is currently finalizing project design and plans to finalize the project economics and announce a construction decision in the second quarter of 2020. La Yaqui Grande is a significantly larger project than La Yaqui Phase I (constructed in 2017) and Cerro Pelon (constructed in 2019), with 724,000 ounces in Mineral Reserves (19.2 million tonnes at 1.17 g/t Au) as reported in the 2019 Mineral Reserve and Resource statement.
During the first quarter, the Company invested $1.8 million at La Yaqui Grande, focused on detailed engineering, project design and costing, and exploration activities.
Lynn Lake (Manitoba, Canada)
The Company released a positive Feasibility Study on the Lynn Lake project in December 2017 outlining average annual production of 143,000 ounces over a 10 year mine life at average mine-site all-in sustaining costs of $745 per ounce.
The project economics detailed in the 2017 Feasibility Study outlined a 12.5% IRR at a $1,250 per ounce gold price (21.5% IRR and NPV of $290 million at a $1,500 per ounce gold price). Since the release of the 2017 Feasibility Study, the Company has undertaken several initiatives designed to improve the project economics. These include a detailed review of construction capital, the evaluation of various production scenarios and the inclusion of the results of more detailed engineering.
Development spending (excluding exploration) in the first quarter of 2020 was $1.5 million, primarily related to baseline work and drafting of the Environmental Impact Study (“EIS”) for the project that will be submitted to satisfy Federal and Provincial regulatory requirements. The EIS is expected to be submitted in the second quarter of 2020. The permitting process is expected to take approximately two years followed by two years of construction.
First Quarter 2019 Exploration Activities
Island Gold (Ontario, Canada)
The 2020 exploration drilling program is focused on continuing to expand the down-plunge and lateral extensions of the Island Gold deposit with the objective of adding new near mine Mineral Resources across the two-kilometre long Island Gold Main Zone. The exploration drilling program in the quarter was designed to follow up on the exploration success in 2019, where high grade gold mineralization was extended across all three areas of focus, most notably in the Main and Eastern Extensions. This resulted in a 21% increase in Mineral Reserves to 1.2 million ounces (3.6 mt grading 10.37 g/t Au), net of mining depletion, and a 46% increase in Inferred Mineral Resources to 2.3 million ounces (5.4 mt grading 13.26 g/t Au) as outlined in the 2019 Mineral Reserve and Resource statement issued on February 18, 2020.
A total of $21 million has been budgeted in 2020 for surface and underground exploration at Island Gold and includes 46,000 metres (“m”) of surface directional drilling, 30,000 m of underground exploration drilling, and 900 m of underground exploration development to extend drill platforms on the 620, 740, and 840 levels.
A regional exploration program which includes 10,000 m of drilling is also planned in 2020 and is focused on evaluating and advancing exploration targets outside the main Island Gold Mine area on the 9,750-hectare Island Gold Property.
Surface exploration drilling
A total of 11 holes totalling 9,719 m were completed in the first quarter as part of the surface directional drilling program. Directional drilling targeted areas peripheral to the Inferred Mineral Resource blocks below the 1,000 m level, with drill hole spacing ranging from 75 m to 100 m. The area that was targeted by the surface directional drill program extends approximately 2,000 m in strike length between the 1,000 m and 1,500 m elevation below surface.
Underground exploration drilling
During the first quarter of 2020, a total of 6,568 m of underground exploration drilling was completed in 22 holes from the 620 and 840 levels. The objective of the underground drilling is to identify new Mineral Resources close to existing Mineral Resource or Reserve blocks. A total of 266.5 m of underground exploration drift development was completed on the 340, 490, 620 and 840 levels during the first quarter of 2020.
Total exploration expenditures during the first quarter were $4.2 million, of which $4.0 million was capitalized.
Mulatos District (Sonora, Mexico)
The Company has a large exploration package covering 28,972 hectares with the majority of past exploration efforts focused around the Mulatos mine. Over the last three years, exploration has moved beyond the main Mulatos pit area and is focused on earlier stage prospects throughout the wider district.
In the first quarter, the Company invested $1.8 million in exploration activities within the Mulatos District, of which $0.5 million was capitalized related to La Yaqui Grande. Other spending in the quarter related to drilling to identify potential underground targets, ground geophysical surveys, and administrative costs.
Lynn Lake (Manitoba, Canada)
During the first quarter of 2020, a total of 7,612 m of drilling was completed in 35 holes focused on testing exploration targets in proximity to the Gordon and MacLellan Deposits. Targeting and planning for the 2020 field program continued in the first quarter with a focus on developing exploration programs to evaluate and further advance a pipeline of prospective regional exploration targets. Exploration spending in the first quarter totaled $1.5 million.
Review of First Quarter Financial Results
Operating Revenue
During the first quarter of 2019, the Company sold 111,854 ounces of gold for revenue of $176.9 million, a 13% increase from the prior year period driven by an increase in realized gold prices, partially offset by lower ounces sold. The decrease in ounces sold is primarily a result of the temporary shutdown of the Northgate shaft at Young-Davidson to facilitate the tie in of the lower mine infrastructure. In addition, El Chanate concluded residual leaching during the fourth quarter of 2019, further reducing gold sales compared to the prior year.
The average realized gold price in the quarter was $1,582 per ounce, a 21% increase compared to $1,304 per ounce realized in the prior year period.
Cost of sales were $120.3 million in the first quarter of 2020, a 5% decrease compared to the prior year period, driven by Young-Davidson and El Chanate.
Mining and processing costs were consistent with the comparative period at $82.5 million, as lower tonnes mined and processed at Young-Davidson during the lower mine tie-in were offset by higher costs at Mulatos.
Consolidated total cash costs for the quarter were $759 per ounce, a 4% increase compared to $732 per ounce in the prior year period, driven by higher unit costs at Young-Davidson.
AISC were $1,010 per ounce in the quarter, a 6% increase driven by higher total cash costs, and timing of sustaining capital spending at Mulatos and Island Gold.
Royalty expense was $2.4 million in the quarter, substantially lower than the prior year period of $5.4 million. During the quarter, the Company repurchased and cancelled a 3% NSR royalty at Island Gold, significantly reducing the royalty expense. In addition, the prior year royalty expense included a 5% royalty on production at Mulatos, which ceased in the first quarter of 2019, driving royalty expense lower in 2020.
Amortization of $35.4 million in the quarter was lower than the prior year period expense of $39.4 million due to lower production. Amortization of $316 per ounce was in line with guidance and the prior year.
The Company recognized earnings from operations of $46.2 million in the quarter, higher than the prior year period due to higher realized gold prices, driving stronger margins.
The Company reported a net loss of $12.3 million in the quarter, compared to net earnings of $16.8 million in the same period in 2019. The decrease is primarily due to the impact of the weakening Canadian dollar and Mexican Peso, which resulted in a $5.1 million foreign exchange loss, as well as a $36.8 million foreign exchange loss recorded within deferred tax expense. On an adjusted basis, earnings of $29.4 million or $0.08 per share increased compared to the prior year driven by higher realized gold prices and improved operating margins. Adjusted earnings reflect adjustments for one-time gains and losses, as well as foreign exchange movements, which generated a combined foreign exchange loss of $41.9 million in the first quarter of 2020.
Associated Documents
This press release should be read in conjunction with the Company’s interim consolidated financial statements for the three-month period ended March 31, 2020 and associated Management’s Discussion and Analysis (“MD&A”), which are available from the Company’s website, www.alamosgold.com, in the “Investors” section under “Reports and Financials”, and on SEDAR (www.sedar.com) and EDGAR (www.sec.gov).
Reminder of First Quarter 2020 Results Conference Call
The Company’s senior management will host a conference call on Thursday, April 30, 2020 at 11:00 am ET to discuss the first quarter 2020 results.
Participants may join the conference call by dialling (416) 764-8659 or (888) 664-6392 for calls within Canada and the United States, or via webcast at www.alamosgold.com.
A playback will be available until May 30, 2020 by dialling (416) 764-8677 or (888) 390-0541 within Canada and the United States. The pass code is 223183#. The webcast will be archived at www.alamosgold.com.
Qualified Persons
Chris Bostwick, FAusIMM, Alamos’ Vice President, Technical Services, who is a qualified person within the meaning of National Instrument 43-101 (“Qualified Person”), has reviewed and approved the scientific and technical information contained in this press release.
About Alamos
Alamos is a Canadian-based intermediate gold producer with diversified production from three operating mines in North America. This includes the Young-Davidson and Island Gold mines in northern Ontario, Canada and the Mulatos mine in Sonora State, Mexico. Additionally, the Company has a significant portfolio of development stage projects in Canada, Mexico, Turkey, and the United States. Alamos employs more than 1,700 people and is committed to the highest standards of sustainable development. The Company’s shares are traded on the TSX and NYSE under the symbol “AGI”.
FOR FURTHER INFORMATION, PLEASE CONTACT:
| Scott K. Parsons | |
| Vice-President, Investor Relations | |
| (416) 368-9932 x 5439 |
All amounts are in United States dollars, unless otherwise stated.
The TSX and NYSE have not reviewed and do not accept responsibility for the adequacy or accuracy of this release.
Cautionary Note
This press release contains statements which are, or may be deemed to be, forward-looking information as defined under applicable Canadian and U.S. securities laws (“forward-looking statement(s)”). All statements in this press release, other than statements of historical fact, which address events, results, outcomes or developments that the Company expects to occur are, or may be deemed to be forward-looking statements. Forward-looking statements are generally, but not always, identified by the use of forward-looking terminology such as “expect”, “believe”, “anticipate”, “intend”, “target”, “estimate”, “forecast”, “budget”, “potential’, “continues”, “plan”, “schedule” or variations of such words and phrases and similar expressions or statements that certain actions, events or results “may”, “could”, “would”, “should”, “might” or “will” be taken, occur or be achieved.
Forward-looking statements in this press release include information as to strategy, plans or future financial or operating performance, such as the Company’s expansion plans, project timelines, production plans and expected sustainable productivity increases, expected increases in mining activities and corresponding cost efficiencies, expected drilling targets, expected sustaining costs, expected improvements in cash flows and margins, expectations of changes in capital expenditures, forecasted cash shortfalls and the Company’s ability to fund them, cost estimates, projected exploration results, reserve and resource estimates, expected production rates and use of the stockpile inventory, expected recoveries, sufficiency of working capital for future commitments, the impact of COVID-19 on the Company’s operations, the Company’s response to COVID-19 including preventative measures and other statements that express management’s expectations or estimates of future performance.
Alamos cautions that forward-looking statements are necessarily based upon several factors and assumptions that, while considered reasonable by the Company at the time of making such statements, are inherently subject to significant business, economic, legal, political and competitive uncertainties and contingencies. Known and unknown factors could cause actual results to differ materially from those projected in the forward-looking statements.
Such factors and assumptions underlying the forward-looking statements in this press release include, but are not limited to: operations may be exposed to new diseases, epidemics and pandemics, including the effects and potential effects of the global COVID-19 widespread pandemic; the impact of the COVID-19 pandemic on the broader market and the trading price of the Company’s shares; provincial and federal orders or mandates (including with respect to mining operations generally or auxiliary businesses or services required for our operations) in Canada, Mexico, the United States and Turkey; the duration of regulatory responses to the COVID-19 pandemic; governments and the Company’s attempts to reduce the spread of COVID-19 which may affect many aspects of the Company’s operations including the ability to transport personnel to and from site, contractor and supply availability and the ability to sell or deliver gold dore bars; changes to current estimates of mineral reserves and resources; changes to production estimates (which assume accuracy of projected ore grade, mining rates, recovery timing and recovery rate estimates and may be impacted by unscheduled maintenance, labour and contractor availability and other operating or technical difficulties); fluctuations in the price of gold or certain other commodities such as, diesel fuel, natural gas, and electricity; changes in foreign exchange rates (particularly the Canadian dollar, Mexican peso, U.S. dollar and Turkish lira); the impact of inflation; employee and community relations; litigation and administrative proceedings; disruptions affecting operations; availability of and increased costs associated with mining inputs and labour; development delays at the Kirazlı project or Young-Davidson mine; inherent risks associated with mining and mineral processing; the risk that the Company’s mines may not perform as planned; uncertainty with the Company’s ability to secure additional capital to execute its business plans; the speculative nature of mineral exploration and development, including the risks of obtaining and maintaining necessary licenses, permits and authorizations for the Company’s development and operating assets; contests over title to properties; expropriation or nationalization of property; inherent risks and hazards associated with mining including environmental hazards, industrial accidents, unusual or unexpected formations, pressures and cave-ins; changes in national and local government legislation (including tax legislation), controls or regulations in Canada, Mexico, Turkey, the United States and other jurisdictions in which the Company does or may carry on business in the future; risk of loss due to sabotage and civil disturbances; the impact of global liquidity and credit availability and the values of assets and liabilities based on projected future cash flows; risks arising from holding derivative instruments; and business opportunities that may be pursued by the Company.
Additional risk factors and details with respect to risk factors affecting the Company are set out in the Company’s latest 40F/Annual Information Form and MD&A, each under the heading “Risk Factors”, available on the SEDAR website at www.sedar.com or on EDGAR at www.sec.gov. The foregoing should be reviewed in conjunction with the information found in this press release.
The Company disclaims any intention or obligation to update or revise any forward-looking statements whether as a result of new information, future events or otherwise, except as required by applicable law.
Cautionary Note to U.S. Investors Concerning Measured, Indicated and Inferred Resources
Unless otherwise indicated, all Mineral Resource and Mineral Reserve estimates included in this press release have been prepared in accordance with National Instrument 43-101 – Standards of Disclosure for Mineral Projects (“NI 43-101”) and the Canadian Institute of Mining, Metallurgy and Petroleum (the “CIM”) – CIM Definition Standards on Mineral Resources and MineralReserves, adopted by the CIM Council, as amended (the “CIM Standards”).
NI 43-101 is a rule developed by the Canadian Securities Administrators, which established standards for all public disclosure an issuer makes of scientific and technical information concerning mineral projects. The terms “Mineral Reserve”, “Proven Mineral Reserve” and “Probable Mineral Reserve” are Canadian mining terms as defined in accordance with NI 43-101 and the CIM Standards. These definitions differ materially from the definitions in SEC Industry Guide 7 (“SEC Industry Guide 7”) under the United States Securities Exchange Act of1934, as amended. Under SEC (defined below) Industry Guide 7 standards, a “final” or “bankable” feasibility study is required to report Mineral Reserves, the three-year historical average price is used in any reserve or cash flow analysis to designate reserves and the primary environmental analysis or report must be filed with the appropriate governmental authority. In addition, the terms “Mineral Resource”, “Measured Mineral Resource”, “Indicated Mineral Resource” and “Inferred Mineral Resource” are defined in and required to be disclosed by NI 43-101 and the CIM Standards; however, these terms are not defined terms under SEC Industry Guide 7 and are normally not permitted to be used in reports and registration statements filed with the U.S. Securities and Exchange Commission (the “SEC”). Investors are cautioned not to assume that all or any part of mineral deposits in these categories will ever be converted into Mineral Reserves. “Inferred Mineral Resources” have a great amount of uncertainty as to their existence, and great uncertainty as to their economic and legal feasibility. It cannot be assumed that all or any part of an Inferred Mineral Resource will ever be upgraded to a higher category. Under Canadian rules, estimates of Inferred Mineral Resources may not form the basis of feasibility or pre-feasibility studies, except in very limited circumstances.
Investors are cautioned not to assume that all or any part of an Inferred Mineral Resource exists or is economically or legally mineable. Disclosure of “contained ounces” in a Mineral Resource is permitted disclosure under Canadian regulations; however, the SEC normally only permits issuers to report mineralization that does not constitute “Mineral Reserves” by SEC standards as in place tonnage and grade without reference to unit measures. The SEC has adopted final rules, effective February 25, 2019, to replace SEC Industry Guide 7 with new mining disclosure rules under sub-part 1300 of Regulation S-K of the U.S. Securities Act (the “SEC Modernization Rules”). The SEC Modernization Rules replace the historical property disclosure requirements included in SEC Industry Guide 7. As a result of the adoption of the SEC Modernization Rules, the SEC now recognizes estimates of “Measured Mineral Resources”, “Indicated Mineral Resources” and “Inferred Mineral Resources”. In addition, the SEC has amended its definitions of “Proven Mineral Reserves” and “Probable Mineral Reserves” to be substantially similar to international standards. The SEC Modernization Rules will become mandatory for U.S. reporting companies beginning with the first fiscal year commencing on or after January 1, 2021.
Non-GAAP Measures and Additional GAAP Measures
The Company has included certain non-GAAP financial measures to supplement its Consolidated Financial Statements, which are presented in accordance with IFRS, including the following:
- adjusted net earnings and adjusted earnings per share;
- cash flow from operating activities before changes in working capital and taxes received;
- Company-wide free cash flow;
- total mine-site free cash flow;
- mine-site free cash flow;
- total cash cost per ounce of gold sold;
- all-in sustaining cost (“AISC”) per ounce of gold sold;
- mine-site all-in sustaining cost (“Mine-site AISC”) per ounce of gold sold;
- sustaining and non-sustaining capital expenditures; and
- earnings before interest, taxes, depreciation, and amortization
The Company believes that these measures, together with measures determined in accordance with IFRS, provide investors with an improved ability to evaluate the underlying performance of the Company. Non-GAAP financial measures do not have any standardized meaning prescribed under IFRS, and therefore they may not be comparable to similar measures employed by other companies. The data is intended to provide additional information and should not be considered in isolation or as a substitute for measures of performance prepared in accordance with IFRS. Management’s determination of the components of non-GAAP and additional measures are evaluated on a periodic basis influenced by new items and transactions, a review of investor uses and new regulations as applicable. Any changes to the measures are dully noted and retrospectively applied as applicable.
Adjusted Net Earnings and Adjusted Earnings per Share
“Adjusted net earnings” and “adjusted earnings per share” are non-GAAP financial measures with no standard meaning under IFRS which exclude the following from net earnings:
- Foreign exchange gain (loss)
- Items included in other gain (loss)
- Certain non-reoccurring items
- Foreign exchange gain (loss) recorded in deferred tax expense
Net earnings have been adjusted, including the associated tax impact, for the group of costs in “Other loss” on the consolidated statement of comprehensive income. Transactions within this grouping are: the fair value changes on non-hedged derivatives; the renunciation of flow-through exploration expenditures; and loss on disposal of assets. The adjusted entries are also impacted for tax to the extent that the underlying entries are impacted for tax in the unadjusted net earnings.
The Company uses adjusted net earnings for its own internal purposes. Management’s internal budgets and forecasts and public guidance do not reflect the items which have been excluded from the determination of adjusted net earnings. Consequently, the presentation of adjusted net earnings enables shareholders to better understand the underlying operating performance of the core mining business through the eyes of management. Management periodically evaluates the components of adjusted net earnings based on an internal assessment of performance measures that are useful for evaluating the operating performance of our business and a review of the non-GAAP measures used by mining industry analysts and other mining companies.
Adjusted net earnings is intended to provide additional information only and does not have any standardized meaning under IFRS and may not be comparable to similar measures presented by other companies. It should not be considered in isolation or as a substitute for measures of performance prepared in accordance with IFRS. The measure is not necessarily indicative of operating profit or cash flows from operations as determined under IFRS. The following table reconciles this non-GAAP measure to the most directly comparable IFRS measure.
| (in millions) | ||||||
| Three Months Ended March 31, | ||||||
| 2020 | 2019 | |||||
| Net (loss) earnings | ($12.3 | ) | $16.8 | |||
| Adjustments: | ||||||
| Foreign exchange loss (gain) | 5.1 | (0.2 | ) | |||
| Other gain | (0.2 | ) | (2.2 | ) | ||
| Unrealized foreign exchange loss (gain) recorded in deferred tax expense | 36.8 | (4.1 | ) | |||
| Adjusted net earnings | $29.4 | $10.3 | ||||
| Adjusted earnings per share – basic and diluted | $0.08 | $0.03 |
Cash Flow from Operating Activities before Changes in Working Capital and Cash Taxes
“Cash flow from operating activities before changes in working capital and cash taxes” is a non-GAAP performance measure that could provide an indication of the Company’s ability to generate cash flows from operations, and is calculated by adding back the change in working capital and taxes received to “Cash provided by (used in) operating activities” as presented on the Company’s consolidated statements of cash flows. “Cash flow from operating activities before changes in working capital” is a non-GAAP financial measure with no standard meaning under IFRS.
The following table reconciles the non-GAAP measure to the consolidated statements of cash flows.
| (in millions) | ||||||
| Three Months Ended March 31, | ||||||
| 2020 | 2019 | |||||
| Cash flow from operating activities | $56.6 | $42.4 | ||||
| Add (less): Changes in working capital and cash taxes | 25.1 | 19.7 | ||||
| Cash flow from operating activities before changes in working capital and cash taxes | $ 81.7 | $ 62.1 |
Company-wide Free Cash Flow
“Company-wide free cash flow” is a non-GAAP performance measure calculated from the consolidated operating cash flow, less consolidated mineral property, plant and equipment expenditures. The Company believes this to be a useful indicator of our ability to operate without reliance on additional borrowing or usage of existing cash company-wide. Company-wide free cash flow is intended to provide additional information only and does not have any standardized meaning under IFRS and may not be comparable to similar measures of performance presented by other mining companies. Company-wide free cash flow should not be considered in isolation or as a substitute for measures of performance prepared in accordance with IFRS.
| (in millions) | ||||||
| Three Months Ended March 31, | ||||||
| 2020 | 2019 | |||||
| Cash flow from operating activities | $56.6 | $42.4 | ||||
| Less: mineral property, plant and equipment expenditures | (63.3 | ) | (53.3 | ) | ||
| Company-wide free cash flow | ($ 6.7 | ) | ($ 10.9 | ) |
Mine-site Free Cash Flow
“Mine-site free cash flow” is a non-GAAP financial performance measure calculated as cash flow from mine-site operating activities, less mineral property, plant and equipment expenditures. The Company believes this to be a useful indicator of our ability to operate without reliance on additional borrowing or usage of existing cash. Mine-site free cash flow is intended to provide additional information only and does not have any standardized meaning under IFRS and may not be comparable to similar measures of performance presented by other mining companies. Mine-site free cash flow should not be considered in isolation or as a substitute for measures of performance prepared in accordance with IFRS.
| Total Mine-Site Free Cash Flow | ||||||
| Three Months Ended March 31, | ||||||
| 2020 | 2019 | |||||
| (in millions) | ||||||
| Cash flow from operating activities | $56.6 | $42.4 | ||||
| Add: operating cash flow used by non-mine site activity | 14.7 | 11.3 | ||||
| Cash flow from operating mine-sites | $ 71.3 | $ 53.7 | ||||
| Mineral property, plant and equipment expenditure 1 | $63.3 | $53.3 | ||||
| Less: capital expenditures from development projects, and corporate | (6.8 | ) | (6.0 | ) | ||
| Capital expenditure from mine-sites | $ 56.5 | $ 47.3 | ||||
| Total mine-site free cash flow | $ 14.8 | $ 6.4 |
(1) Excludes royalty repurchase of $54.8 million at Island Gold for the three months ended March 31, 2020
| Young-Davidson Mine-Site Free Cash Flow | ||||||
| Three Months Ended March 31, | ||||||
| 2020 | 2019 | |||||
| (in millions) | ||||||
| Cash flow from operating activities | $8.1 | $22.9 | ||||
| Mineral property, plant and equipment expenditure | (27.0 | ) | (22.3 | ) | ||
| Mine-site free cash flow | ($ 18.9 | ) | $ 0.6 |
| Mulatos Mine-Site Free Cash Flow | ||||||
| Three Months Ended March 31, | ||||||
| 2020 | 2019 | |||||
| (in millions) | ||||||
| Cash flow from operating activities | $21.5 | $0.6 | ||||
| Mineral property, plant and equipment expenditure | (7.4 | ) | (12.6 | ) | ||
| Mine-site free cash flow | $ 14.1 | ($ 12.0 | ) |
| Island Gold Mine-Site Free Cash Flow | ||||||
| Three Months Ended March 31, | ||||||
| 2020 | 2019 | |||||
| (in millions) | ||||||
| Cash flow from operating activities | $41.7 | $29.0 | ||||
| Mineral property, plant and equipment expenditure 1 | (22.1 | ) | (12.4 | ) | ||
| Mine-site free cash flow | $ 19.6 | $ 16.6 |
(1) Excludes royalty repurchase of $54.8 million at Island Gold for the three months ended March 31, 2020
Total Cash Costs per ounce
Total cash costs per ounce is a non-GAAP term typically used by gold mining companies to assess the level of gross margin available to the Company by subtracting these costs from the unit price realized during the period. This non-GAAP term is also used to assess the ability of a mining company to generate cash flow from operations. Total cash costs per ounce includes mining and processing costs plus applicable royalties, and net of by-product revenue and net realizable value adjustments. Total cash costs per ounce is exclusive of exploration costs.
Total cash costs per ounce is intended to provide additional information only and does not have any standardized meaning under IFRS and may not be comparable to similar measures presented by other mining companies. It should not be considered in isolation or as a substitute for measures of performance prepared in accordance with IFRS. The measure is not necessarily indicative of cash flow from operations under IFRS or operating costs presented under IFRS.
All-in Sustaining Costs per ounce and Mine-site All-in Sustaining Costs
The Company adopted an “all-in sustaining costs per ounce” non-GAAP performance measure in accordance with the World Gold Council published in June 2013. The Company believes the measure more fully defines the total costs associated with producing gold; however, this performance measure has no standardized meaning. Accordingly, there may be some variation in the method of computation of “all-in sustaining costs per ounce” as determined by the Company compared with other mining companies. In this context, “all-in sustaining costs per ounce” for the consolidated Company reflects total mining and processing costs, corporate and administrative costs, share-based compensation, exploration costs, sustaining capital, and other operating costs.
For the purposes of calculating “mine-site all-in sustaining costs” at the individual mine-sites, the Company does not include an allocation of corporate and administrative costs and share-based compensation, as detailed in the reconciliations below.
Sustaining capital expenditures are expenditures that do not increase annual gold ounce production at a mine site and excludes all expenditures at the Company’s development projects as well as certain expenditures at the Company’s operating sites that are deemed expansionary in nature. For each mine-site reconciliation, corporate and administrative costs, and non-site specific costs are not included in the all-in sustaining cost per ounce calculation.
All-in sustaining costs per gold ounce is intended to provide additional information only and does not have any standardized meaning under IFRS and may not be comparable to similar measures presented by other mining companies. It should not be considered in isolation or as a substitute for measures of performance prepared in accordance with IFRS.
The measure is not necessarily indicative of cash flow from operations under IFRS or operating costs presented under IFRS.
Total Cash Costs and All-in Sustaining Costs per Ounce Reconciliation Tables
The following tables reconciles these non-GAAP measures to the most directly comparable IFRS measures on a Company-wide and individual mine-site basis.
| Total Cash Costs and AISC Reconciliation – Company-wide | ||||||
| Three Months Ended March 31, | ||||||
| 2020 | 2019 | |||||
| (in millions, except ounces and per ounce figures) | ||||||
| Mining and processing | $82.5 | $82.2 | ||||
| Royalties | 2.4 | 5.4 | ||||
| Total cash costs | $84.9 | $87.6 | ||||
| Gold ounces sold | 111,854 | 119,705 | ||||
| Total cash costs per ounce | $ 759 | $ 732 | ||||
| Total cash costs | $84.9 | $87.6 | ||||
| Corporate and administrative(1) | 6.2 | 5.5 | ||||
| Sustaining capital expenditures(2) | 17.5 | 16.1 | ||||
| Share-based compensation | 2.2 | 3.3 | ||||
| Sustaining exploration | 1.5 | 1.4 | ||||
| Accretion of decommissioning liabilities | 0.7 | 0.6 | ||||
| Total all-in sustaining costs | $113.0 | $114.5 | ||||
| Gold ounces sold | 111,854 | 119,705 | ||||
| All-in sustaining costs per ounce | $ 1,010 | $ 957 |
(1) Corporate and administrative expenses exclude expenses incurred at development properties.
(2) Sustaining capital expenditures are defined as those expenditures which do not increase annual gold ounce production at a mine site and exclude all expenditures at growth projects and certain expenditures at operating sites which are deemed expansionary in nature. Total sustaining capital for the period is as follows:
| Three Months Ended March 31, | ||||||
| 2020 | 2019 | |||||
| (in millions) | ||||||
| Capital expenditures per cash flow statement | $63.3 | $53.3 | ||||
| Less: non-sustaining capital expenditures at: | ||||||
| Young-Davidson | (22.8 | ) | (12.3 | ) | ||
| Mulatos | (2.6 | ) | (11.6 | ) | ||
| Island Gold | (13.6 | ) | (7.3 | ) | ||
| Corporate and other | (6.8 | ) | (6.0 | ) | ||
| Sustaining capital expenditures | $17.5 | $16.1 |
| Young-Davidson Total Cash Costs and Mine-site AISC Reconciliation | ||||||
| Three Months Ended March 31, | ||||||
| 2020 | 2019 | |||||
| (in millions, except ounces and per ounce figures) | ||||||
| Mining and processing | $30.8 | $35.9 | ||||
| Royalties | 0.8 | 1.0 | ||||
| Total cash costs | $31.6 | $36.9 | ||||
| Gold ounces sold | 28,905 | 43,996 | ||||
| Total cash costs per ounce | $ 1,093 | $ 839 | ||||
| Total cash costs | $31.6 | $36.9 | ||||
| Sustaining capital expenditures | 4.2 | 10.0 | ||||
| Sustaining exploration | — | 0.1 | ||||
| Accretion of decommissioning liabilities | 0.1 | — | ||||
| Total all-in sustaining costs | $35.9 | $47.0 | ||||
| Gold ounces sold | 28,905 | 43,996 | ||||
| Mine-site all-in sustaining costs per ounce | $ 1,242 | $ 1,068 |
| Mulatos Total Cash Costs and Mine-site AISC Reconciliation | ||||||
| Three Months Ended March 31, | ||||||
| 2020 | 2019 | |||||
| (in millions, except ounces and per ounce figures) | ||||||
| Mining and processing | $35.3 | $24.5 | ||||
| Royalties | 0.3 | 2.3 | ||||
| Total cash costs | $35.6 | $26.8 | ||||
| Gold ounces sold | 43,822 | 36,089 | ||||
| Total cash costs per ounce | $ 812 | $ 743 | ||||
| Total cash costs | $35.6 | $26.8 | ||||
| Sustaining capital expenditures | 4.8 | 1.0 | ||||
| Sustaining exploration | 1.0 | 0.8 | ||||
| Accretion of decommissioning liabilities | 0.6 | 0.6 | ||||
| Total all-in sustaining costs | $42.0 | $29.2 | ||||
| Gold ounces sold | 43,822 | 36,089 | ||||
| Mine-site all-in sustaining costs per ounce | $ 958 | $ 809 |
| Island Gold Total Cash Costs and Mine-site AISC Reconciliation | ||||||
| Three Months Ended March 31, | ||||||
| 2020 | 2019 | |||||
| (in millions, except ounces and per ounce figures) | ||||||
| Mining and processing | $16.4 | $14.6 | ||||
| Royalties | 1.3 | 2.1 | ||||
| Total cash costs | $17.7 | $16.7 | ||||
| Gold ounces sold | 39,127 | 33,585 | ||||
| Total cash costs per ounce | $ 452 | $ 497 | ||||
| Total cash costs | $17.7 | $16.7 | ||||
| Sustaining capital expenditures | 8.5 | 5.1 | ||||
| Total all-in sustaining costs | $26.2 | $21.8 | ||||
| Gold ounces sold | 39,127 | 33,585 | ||||
| Mine-site all-in sustaining costs per ounce | $ 670 | $ 649 |
Earnings Before Interest, Taxes, Depreciation, and Amortization (“EBITDA”)
EBITDA represents net earnings before interest, taxes, depreciation, and amortization. EBITDA is an indicator of the Company’s ability to generate liquidity by producing operating cash flow to fund working capital needs, service debt obligations, and fund capital expenditures.
EBITDA does not have any standardized meaning under IFRS and may not be comparable to similar measures presented by other mining companies. It should not be considered in isolation or as a substitute for measures of performance prepared in accordance with IFRS.
The following is a reconciliation of EBITDA to the consolidated financial statements:
| (in millions) | ||||||
| Three Months Ended March 31, | ||||||
| 2020 | 2019 | |||||
| Net (loss) earnings | ($12.3 | ) | $16.8 | |||
| Add back: | ||||||
| Finance expense | 0.8 | 0.5 | ||||
| Amortization | 35.4 | 39.4 | ||||
| Deferred income tax expense (recovery) | 53.1 | (3.7 | ) | |||
| Current income tax (recovery) expense | (0.3 | ) | 7.5 | |||
| EBITDA | $ 76.7 | $ 60.5 |
Additional GAAP Measures
Additional GAAP measures are presented on the face of the Company’s consolidated statements of comprehensive income (loss) and are not meant to be a substitute for other subtotals or totals presented in accordance with IFRS, but rather should be evaluated in conjunction with such IFRS measures. The following additional GAAP measures are used and are intended to provide an indication of the Company’s mine and operating performance:
- Earnings from operations – represents the amount of earnings before net finance income/expense, foreign exchange gain/loss, other income/loss, loss on redemption of senior secured notes and income tax expense
Unaudited Consolidated Statements of Financial Position, Comprehensive
Income, and Cash Flow
ALAMOS GOLD INC.
Consolidated Statements of Financial Position
(Unaudited – stated in millions of United States dollars)
| March 31, 2020 | December 31, 2019 | ||||||
| A S S E T S | |||||||
| Current Assets | |||||||
| Cash and cash equivalents | $214.7 | $182.8 | |||||
| Equity securities | 15.6 | 22.8 | |||||
| Amounts receivable | 42.8 | 37.4 | |||||
| Income taxes receivable | 6.6 | 4.6 | |||||
| Inventory | 132.0 | 126.9 | |||||
| Other current assets | 15.9 | 19.8 | |||||
| Total Current Assets | 427.6 | 394.3 | |||||
| Non-Current Assets | |||||||
| Long-term inventory | 25.3 | 25.7 | |||||
| Mineral property, plant and equipment | 3,009.7 | 2,933.4 | |||||
| Other non-current assets | 41.2 | 43.1 | |||||
| Total Assets | $ 3,503.8 | $ 3,396.5 | |||||
| L I A B I L I T I E S | |||||||
| Current Liabilities | |||||||
| Accounts payable and accrued liabilities | $124.2 | $127.3 | |||||
| Total Current Liabilities | 124.2 | 127.3 | |||||
| Non-Current Liabilities | |||||||
| Deferred income taxes | 563.0 | 513.7 | |||||
| Decommissioning liabilities | 55.7 | 57.1 | |||||
| Debt and financing obligations | 100.0 | — | |||||
| Other non-current liabilities | 3.0 | 3.1 | |||||
| Total Liabilities | 845.9 | 701.2 | |||||
| E Q U I T Y | |||||||
| Share capital | $3,690.5 | $3,693.3 | |||||
| Contributed surplus | 89.7 | 90.7 | |||||
| Accumulated other comprehensive loss | (18.4 | ) | (0.2 | ) | |||
| Deficit | (1,103.9 | ) | (1,088.5 | ) | |||
| Total Equity | 2,657.9 | 2,695.3 | |||||
| Total Liabilities and Equity | $ 3,503.8 | $ 3,396.5 |
ALAMOS GOLD INC.
Consolidated Statements of Comprehensive (Loss) Income
(Unaudited – stated in millions of United States dollars, except share and per share amounts)
| For three months ended | |||||||
| March 31, | March 31, | ||||||
| 2020 | 2019 | ||||||
| OPERATING REVENUES | $176.9 | $156.1 | |||||
| COST OF SALES | |||||||
| Mining and processing | 82.5 | 82.2 | |||||
| Royalties | 2.4 | 5.4 | |||||
| Amortization | 35.4 | 39.4 | |||||
| 120.3 | 127.0 | ||||||
| EXPENSES | |||||||
| Exploration | 2.0 | 1.6 | |||||
| Corporate and administrative | 6.2 | 5.5 | |||||
| Share-based compensation | 2.2 | 3.3 | |||||
| 130.7 | 137.4 | ||||||
| EARNINGS FROM OPERATIONS | 46.2 | 18.7 | |||||
| OTHER EXPENSES | |||||||
| Finance expense | (0.8 | ) | (0.5 | ) | |||
| Foreign exchange (loss) gain | (5.1 | ) | 0.2 | ||||
| Other gain | 0.2 | 2.2 | |||||
| EARNINGS BEFORE INCOME TAXES | $ 40.5 | $ 20.6 | |||||
| INCOME TAXES | |||||||
| Current income tax recovery (expense) | 0.3 | (7.5 | ) | ||||
| Deferred income tax (expense) recovery | (53.1 | ) | 3.7 | ||||
| NET (LOSS) EARNINGS | ($ 12.3 | ) | $ 16.8 | ||||
| Items that may be subsequently reclassified to net earnings: | |||||||
| Unrealized gain (loss) on currency hedging instruments, net of taxes | (11.4 | ) | 3.3 | ||||
| Unrealized gain on fuel hedging instruments, net of taxes | (0.8 | ) | 0.6 | ||||
| Items that will not be reclassified to net earnings: | |||||||
| Unrealized gain (loss) on equity securities, net of taxes | (6.0 | ) | 2.3 | ||||
| Total other comprehensive income (loss) | ($ 18.2 | ) | $ 6.2 | ||||
| COMPREHENSIVE INCOME (LOSS) | ($ 30.5 | ) | $ 23.0 | ||||
| EARNINGS PER SHARE | |||||||
| – basic | ($ 0.03 | ) | $ 0.04 | ||||
| – diluted | ($ 0.03 | ) | $ 0.04 | ||||
| Weighted average number of common shares outstanding (000’s) | |||||||
| – basic | 391,341 | 389,735 | |||||
| – diluted | 391,341 | 394,196 |
ALAMOS GOLD INC.
Consolidated Statements of Cash Flows
(Unaudited – stated in millions of United States dollars)
| For three months ended | |||||||
| March 31, | March 31, | ||||||
| 2020 | 2019 | ||||||
| CASH PROVIDED BY (USED IN): | |||||||
| OPERATING ACTIVITIES | |||||||
| Net (loss) earnings for the period | ($12.3 | ) | $16.8 | ||||
| Adjustments for items not involving cash: | |||||||
| Amortization | 35.4 | 39.4 | |||||
| Foreign exchange loss (gain) | 5.1 | (0.2 | ) | ||||
| Current income tax (recovery) expense | (0.3 | ) | 7.5 | ||||
| Deferred income tax expense (recovery) | 53.1 | (3.7 | ) | ||||
| Share-based compensation | 2.2 | 3.3 | |||||
| Finance expense | 0.8 | 0.5 | |||||
| Other items | (2.3 | ) | (1.5 | ) | |||
| Changes in working capital and cash taxes | (25.1 | ) | (19.7 | ) | |||
| 56.6 | 42.4 | ||||||
| INVESTING ACTIVITIES | |||||||
| Mineral property, plant and equipment | (63.3 | ) | (53.3 | ) | |||
| Repurchase of Island Gold royalty | (54.8 | ) | — | ||||
| (118.1 | ) | (53.3 | ) | ||||
| FINANCING ACTIVITIES | |||||||
| Proceeds from draw down of credit facility | 100.0 | — | |||||
| Repayment of equipment financing obligations | (0.2 | ) | (1.1 | ) | |||
| Repurchase and cancellation of common shares | (2.9 | ) | (10.6 | ) | |||
| Proceeds from the exercise of options | 3.9 | 0.6 | |||||
| Dividends paid | (5.6 | ) | (3.9 | ) | |||
| 95.2 | (15.0 | ) | |||||
| Effect of exchange rates on cash and cash equivalents | (1.8 | ) | 0.5 | ||||
| Net increase (decrease) in cash and cash equivalents | 31.9 | (25.4 | ) | ||||
| Cash and cash equivalents – beginning of period | 182.8 | 206.0 | |||||
| CASH AND CASH EQUIVALENTS – END OF PERIOD | $ 214.7 | $ 180.6 |
Source: Alamos Gold Inc.
Original Article: https://www.alamosgold.com/news-and-media/news-releases/news-releases-details/2020/Alamos-Reports-First-Quarter-2020-Results/default.aspx


