(All amounts expressed in U.S. dollars unless otherwise noted)
TORONTO, Oct. 26, 2022 /CNW/ – Agnico Eagle Mines Limited (NYSE: AEM) (TSX: AEM) (“Agnico Eagle” or the “Company”) today reported financial and operating results for the third quarter of 2022.
Third quarter of 2022 highlights:
- Strong performance resulted in solid quarterly gold production and costs – Payable gold production1 in the third quarter of 2022 was 816,795 ounces at production costs per ounce of $804, total cash costs per ounce2 of $779 and all-in sustaining costs (“AISC”) per ounce3 of $1,106. For the third quarter of 2022, the Company reported quarterly net income of $0.17 per share, with adjusted net income4 of $0.52 per share. Operating cash flow after changes in non-cash components of working capital was of $1.26 per share
| 1 | Payable production of a mineral means the quantity of a mineral produced during a period contained in products that have been or will be sold by the Company whether such products are shipped during the period or held as inventory at the end of the period. |
| 2 | Total cash costs per ounce is a non-GAAP ratio that is not a standardized financial measure under the financial reporting framework used to prepare the Company’s financial statements and, unless otherwise specified, is reported on a by-product basis in this news release. For the detailed calculation of production costs per ounce and the reconciliation of total cash costs to production costs, see “Reconciliation of Non-GAAP Financial Performance Measures” below. See also “Note Regarding Certain Measures of Performance”. |
| 3 | AISC per ounce is a non-GAAP ratio that is not a standardized financial measure under the financial reporting framework used to prepare the Company’s financial statements and, unless otherwise specified, is reported on a by-product basis in this news release. For a reconciliation to production costs and for all-in sustaining costs on a co-product basis, see “Reconciliation of Non-GAAP Financial Performance Measures” below. See also “Note Regarding Certain Measures of Performance”. |
- Operating results include record gold production at Amaruq and sustained productivity improvements at Macassa – In the third quarter of 2022 at Amaruq, continued positive grade reconciliation and overall strong operating performance which resulted in a record quarter, with payable production of 122,994 ounces of gold. At Macassa, enhanced ventilation, better equipment availability and other operational efficiencies resulted in better-than-forecast production, with payable production of 51,775 ounces of gold
- Gold production, cost and capital expenditure guidance reiterated for 2022 – Expected payable gold production in 2022 remains unchanged at between 3.2 and 3.4 million ounces. Due to cost inflation in 2022, total cash costs per ounce and AISC per ounce are now expected to be near the top end of the guided ranges of between $725 and $775 and $1,000 and $1,050, respectively. Total expected capital expenditures (excluding capitalized exploration) for 2022 remain estimated to be approximately $1.4 billion. The Company’s guidance for 2022 includes production, costs and capital expenditures for the period commencing January 1, 2022 for the Detour Lake, Macassa and Fosterville mines
- Pressures related to cost inflation, workforce availability and COVID-19 remained manageable through the third quarter of 2022, but these pressures could be challenging in the coming months – In the third quarter of 2022, inflation on production costs was largely driven by higher input prices in key consumables (such as energy, cyanide and steel), which have experienced increases above the 5% to 7% general inflation rate forecast at the beginning of the year. Workforce availability and supply chain issues for equipment parts also remained challenging during the quarter. These pressures continued to be partially offset by solid operational performance, the pooling of resources within the regions in which the Company operates, optimization and cost saving initiatives, synergies resulting from the merger with Kirkland Lake Gold Ltd. (“Kirkland Lake Gold”) on February 8, 2022 (the “Merger”) and positive foreign exchange impacts (weaker Euro and Canadian and Australian dollars). Although the Company has started to see a gradual easing of inflationary pressures and some relief in supply chain procurement, these pressures could still be challenging in the fourth quarter of 2022 and into 2023. The Company’s focus will continue to be on increasing operational efficiencies and cost optimization at all mining operations
| 4 | Adjusted net income and adjusted net income per share are non-GAAP measures that are not standardized financial measures under the financial reporting framework used to prepare the Company’s financial statements. For a reconciliation to net income and net income per share see “Reconciliation of Non-GAAP Financial Performance Measures” below. See also “Note Regarding Certain Measures of Performance”. |
- Interim Target of 30% Greenhouse Gas Reduction by 2030 – The Company continues to be committed to addressing climate-change and reaching net-zero by 2050. Supporting this commitment, the Board approved adopting an interim target to reduce greenhouse gas emissions by 30% by 2030. The Company will be releasing a Climate Action report in the fourth quarter of 2022
- Development Projects Progressing as Planned
- Amaruq Underground – The project was completed on schedule and on budget with commercial production achieved on August 1, 2022
- Odyssey project – Construction and development activities remain on schedule. Shaft sinking activities expected to commence in early January 2023, with initial production from the Odyssey South ramp expected in March 2023
- Detour Lake mine – Projects to increase mill throughput to 28 million tonnes per year (“Mtpa”) continue to advance as planned. Installation of the screen before the secondary crusher on line two was completed in August 2022 and resulted in daily average throughput of 3,515 tonnes per hour (equivalent to 28 Mtpa) for the month of September. Installation of a screen on line one is expected to be completed in the fourth quarter of 2022 and the focus will be on maximizing daily throughput levels
- Exploration Continues to Deliver Positive Results at Minesites and Development Projects
- Odyssey project – In the third quarter of 2022, an expanded drill program focused on infill drilling at Odyssey South, on drill testing the Odyssey Internal zones and on infill and step-out drilling at East Gouldie. A recent intercept at Odyssey South yielded 5.7 grams per tonne (“g/t”) gold over 21.8 metres at 367 metres depth. At East Gouldie, the drilling in the core of the deposit continues to return wide, high-grade intersections, with recent results including 4.6 g/t gold over 50.7 metres at 1,537 metres depth. Step-out drilling to the west of East Gouldie continues to test the western extension and filling the gap between East Gouldie and the Norrie Zone, with a recent intercept of 4.2 g/t gold over 12.8 metres at 1,331 metres depth in an area approximately 100 metres above the Norrie Zone and 670 metres west of the current East Gouldie mineral resources
- Detour Lake mine – The conversion and expansion drilling program in the West Pit extension continues to intersect wide zones of mineralization immediately adjacent to the current open pit, with recent results including 1.9 g/t gold over 118.8 metres at 419 metres depth, and higher-grade intervals along the westerly plunge, with a recent highlight including 6.1 g/t gold over 12.2 metres at 918 metres depth and approximately 1,935 metres west of the pit, where infill drilling continues to confirm the down-plunge and western extension of the deposit
- Macassa mine – The extension of the ramp from Macassa to the Amalgamated Kirkland (“AK”) deposit is now completed. Two underground drills are operating in the ramp, with one focused on infill drilling higher grade areas near the proposed bulk sample. The Company believes ore could be sourced for the Macassa mill in early 2024, which could provide flexibility to the operations. Recent results include a highlight intercept of 30.7 g/t gold over 3.6 metres at 64 metres depth
- Fosterville mine – In the third quarter of 2022, step-out drilling returned high-grade results west of the Lower Phoenix zone and identified a new mineralized structure (Cardinal zone) in the hanging wall of Lower Phoenix. Highlight visible-gold intercepts from the Cardinal zone include 365.5 g/t gold over 1.1 metre at 1,682 metres depth; 226.2 g/t gold over 1.4 metres at 1,716 metres depth; and 168.6 g/t gold over 2.9 metres at 1,682 metres depth
- Hope Bay project – Drilling continues to ramp-up with eight rigs now in operation and the addition of a second drill contractor. Good grades and thicknesses were encountered at Doris in the BCO and BCN zones. Recent results west of the BTD Connector zone include 7.3 g/t gold over 15.8 metres at 459 metres depth and 19.6 g/t gold over 4.5 metres at 520 metres depth. Drilling ramped up at Madrid in the third quarter of 2022
- Focus remains on disciplined capital allocation and strong financial flexibility – On July 24, 2022, the Company repaid the $100 million 4.87% Series C senior notes at maturity with available cash. At September 30, 2022, the Company’s net debt5 totalled $519.9 million. In the third quarter of 2022, the Company repurchased 999,320 common shares for $42.6 million through its normal course issuer bid (“NCIB”). Under the NCIB, the Company is authorized to purchase up to $500 million of its common shares (up to a maximum of 5% of its issued and outstanding common shares) and year to date approximately $65 million has been purchased
- A quarterly dividend of $0.40 per share has been declared
“In the third quarter of 2022, the Company posted the best safety performance in its 65 year history and delivered solid operational results. With a strong first nine months of the year, the Company is tracking well to deliver on its production and cost guidance in 2022,” said Ammar Al-Joundi, Agnico Eagle’s President and Chief Executive Officer. “Despite headwinds from a lower gold price and cost inflation, the Company’s financial position remains strong. It gives us strategic flexibility and provides us with the ability to continue advancing our key development projects and exploration programs while maintaining capital returns to our shareholders,” added Mr. Al-Joundi.
| 5 | Net debt is a non-GAAP measure that is not a standardized measure under the financial reporting framework used to prepare the Company’s financial statements. For a reconciliation to long-term debt see “Reconciliation of Non-GAAP Financial Performance Measures – Reconciliation of Long-Term Debt to Net Debt”. See also “Note Regarding Certain Measures of Performance”. |
Third Quarter 2022 Financial and Production Results
In the third quarter of 2022, net income was $79.6 million ($0.17 per share). This result includes the following items (net of tax): unrealized mark-to-market losses on foreign exchange and oil hedges of $134.5 million ($0.30 per share), foreign currency translation losses on deferred tax liabilities of $19.6 million ($0.04 per share), non-cash foreign currency translation gains of $7.2 million ($0.02 per share), realized losses on foreign exchange and oil hedges of $6.9 million ($0.02 per share), mark-to-market gains on the Company’s investment portfolio of $3.1 million ($0.01 per share), and various other adjustment losses of $5.1 million ($0.02 per share). The unrealized mark-to-market losses on foreign exchange hedges losses are a result of the rapidly appreciating U.S. dollar relative to the Euro, and Canadian and Australian dollars over the last two weeks of the quarter (for additional details see section on the Company’s financial flexibility below).
Excluding these items would result in adjusted net income of $235.4 million or $0.52 per share for the third quarter of 2022. For the third quarter of 2021, the Company reported net income of $119.0 million ($0.49 per share).
Included in the third quarter of 2022 net income, and not adjusted above are care and maintenance costs net of tax of $5.9 million ($0.01 per share) and a non-cash stock option expense of $3.3 million ($0.01 per share).
In the first nine months of 2022, the Company reported net income of $465.2 million ($1.08 per share). This compares with the first nine months of 2021, when net income was $460.6 million ($1.89 per share).
For financial reporting purposes, the Merger was determined to be a business combination with Agnico Eagle identified as the acquirer. As a result, the purchase consideration was allocated to the identifiable assets and liabilities of Kirkland Lake Gold based on their fair values as of February 8, 2022 (the “Purchase Price Allocation”) and was recorded in the first quarter of 2022. The finalization of the Purchase Price Allocation will take place within twelve months following the acquisition date.
Upon closing of the Merger, under the Purchase Price Allocation, any gold inventory held by Kirkland Lake Gold on February 8, 2022 was revalued at the forecast gold price in the period the inventory was expected to be sold. The revalued inventory subsequently sold during the third quarter of 2022 resulted in additional production costs of approximately $3.1 million ($2.1 million after tax) during the quarter. The revalued inventory subsequently sold during the first nine months of 2022 resulted in additional production costs of approximately $156.0 million ($108.0 million after tax). Given the extraordinary nature of the fair value adjustment on inventory related to the Merger, this non-cash adjustment, which increased the cost of inventory sold during the quarter, was normalized from net income and net income per share and adjusted out of the total cash costs per ounce and AISC in the third quarter of 2022.
The decrease in net income in the third quarter of 2022 compared to the prior-year period is primarily due to unrealized mark-to-market losses on foreign exchange hedges, higher exploration and amortization costs due to the inclusion of the Detour, Fosterville and Macassa mines and higher general and administrative expenses, offset by higher mine operating margins6 (from higher sales volumes following the Merger).
The increase in net income in the first nine months of 2022 compared to the prior-year period is primarily due to higher mine operating margins (from higher sales volumes following the Merger). The overall increase in net income was partially offset by the unrealized mark-to-market losses on foreign exchange hedges, higher exploration and amortization costs due to the inclusion of the Detour, Fosterville and Macassa mines and higher general and administrative costs. In addition, other expenses and care and maintenance costs offset the higher operating margins.
| 6 | Operating margin is a non-GAAP measure that is not a standardized measure under the financial report framework used to prepare the Company’s financial statements. For a reconciliation to net income see “Reconciliation of Non-GAAP Financial Performance Measures” below. See also “Note Regarding Certain Measures of Performance”. |
In the third quarter of 2022, cash provided by operating activities was $575.4 million ($558.4 million before changes in non-cash components of working capital), compared to the third quarter of 2021 when cash provided by operating activities was $297.2 million ($419.9 million before changes in non-cash components of working capital).
The increase in cash provided by operating activities (before changes in non-cash components of working capital) in the third quarter of 2022, compared to the prior-year period, is primarily due to higher sales volumes following the Merger, partially offset by lower realized metal prices.
In the first nine months of 2022, cash provided by operating activities was $1,716.1 million ($1,630.3 million before changes in non-cash components of working capital), compared to the first nine months of 2021 when cash provided by operating activities was $1,083.2 million ($1,289.9 million before changes in non-cash components of working capital). A non-cash fair value adjustment on inventory related to the Merger of $156.0 million was included in production costs and as a result included in cash provided by operating activities before changes in non-cash components of working capital for the first nine months of 2022. The non-cash fair value adjustment on inventory was then reversed through changes in non-cash components of working capital. Excluding the non-cash fair value adjustment on inventory of $156.0 million, cash provided by operating activities before changes in non-cash components of working capital was $1,786.3 million in the first nine months of 2022.
The increase in cash provided by operating activities in the first nine months of 2022, compared to the prior-year period, is primarily due to higher net income driven by higher sales volumes following the Merger, partially offset by lower realized metal prices. This included non-recurring costs related to the Merger of $35.3 million in transaction costs and $57.0 million in severance costs.
In the third quarter of 2022, the Company’s payable gold production was 816,795 ounces. This compares to quarterly payable gold production of 541,663 ounces in the prior-year period. In the first nine months of 2022, the Company’s gold production was a record 2,335,569 ounces. Including the entire first nine month’s production from the pre-Merger Kirkland Lake Gold mines, total gold production in the first nine months of 2022 was 2,481,294. This compares to payable gold production of 1,584,473 ounces in the first nine months of 2021, which included 24,057 ounces and 348 ounces of pre-commercial production of gold at the Tiriganiaq open pit at Meliadine and Amaruq underground project, respectively.
Gold production in the third quarter of 2022 and the first nine months of 2022, when compared to the prior-year periods, was higher primarily due to the inclusion of the production from the Detour Lake, Fosterville and Macassa mines. This was partially offset by the cessation of gold production in 2022 at Hope Bay following the Company’s decision to dedicate the infrastructure to exploration activities and lower production at the Company’s Pinos Altos mine and the LaRonde complex.
Production costs per ounce in the third quarter of 2022 were $804, compared to $852 in the prior-year period. Total cash costs per ounce in the third quarter of 2022 were $779, compared to $784 in the prior-year period.
Production costs per ounce in the first nine months of 2022 were $846, compared to $837 in the prior-year period. Total cash costs per ounce in the first nine months of 2022 were $769, compared to $755 in the prior-year period. Including the entire first nine month’s production from the pre-Merger Kirkland Lake Gold mines, total cash costs per ounce in the first nine months of 2022 were slightly above the mid-point of 2022 cost guidance.
In the third quarter of 2022, production costs per ounce and total cash costs per ounce decreased when compared to the prior-year period primarily as a result of the combination of operations following the Merger. In the first nine months of 2022, production costs per ounce and total cash costs per ounce increased when compared to the prior-year period primarily due to lower production volumes from the Canadian Malartic, Hope Bay and Pinos Altos mines, partially offset by the contribution of lower cost production (on a per ounce basis) from the Detour Lake, Fosterville and Macassa mines following the Merger. A detailed description of the minesite costs per tonne at each mine is set out below.
AISC per ounce in the third quarter of 2022 were $1,106, compared to $1,059 in the prior-year period. AISC per ounce in the first nine months of 2022 were $1,067, compared to $1,035 in the prior-year period.
AISC per ounce in the third quarter of 2022 and first nine months of 2022 increased when compared to the prior-year periods primarily due to lower by-product metal revenues from lower production volumes and higher sustaining capital expenditures7 from an increase in input costs for fuel and materials.
Update on Key Value Drivers
Activities are progressing well at the Company’s key exploration, development and mine expansion projects. Highlights on the key value drivers (Detour Lake, Odyssey, Kirkland Lake and Hope Bay) are set out below and details on certain mine expansion projects (Kittila shaft, Meliadine Phase 2 and Amaruq underground) are set out in the operational section of this news release.
Detour Lake Mine – Secondary Crusher Pre-Screen Commissioned on Second Mill Circuit; Exploration Drilling in the West Pit Extension Continues to Return Positive Results; Modelling of Underground Mineral Resources Underway
The Company continues to advance multiple initiatives to increase mill throughput from 23 Mtpa in 2020 to 28.0 Mtpa in 2025. The initiatives completed to date include improved fragmentation at the mine, improved primary crusher choke feeding, removal of the daily regulatory mill limit and the completion of the 610 conveyor refeed, bringing the mill throughput to approximately 25.5 Mtpa. In the third quarter of 2022, the Company’s focus was on the installation and commissioning of the screens before the secondary crushers on line two.
Pre-screening before the secondary crushers is expected to help de-bottleneck the grinding circuit and contribute an additional approximately 2.0 Mtpa to the mill throughput. The installation and commissioning of the screen before the secondary crusher on the second mill circuit was completed in August 2022 and resulted in an average daily throughput of 3,515 tonnes per hour (equivalent to 28.0 Mtpa) for the month of September. More time is required to fully optimize the circuit and confirm these initial results. The installation and commissioning of a screen before the secondary crusher on the first mill circuit is expected to be completed in the fourth quarter of 2022.
With positive initial results from the projects completed to date, the Company anticipates that a mill throughput of 28.0 Mtpa could be achieved before 2025 and sees potential to increase mill throughput beyond 28.0 Mtpa. The Company’s future focus will be stabilizing and optimizing the mill circuit processes.
| 7 | Sustaining capital expenditures is a non-GAAP measure that is not a standardized financial measure under the financial reporting framework used to prepare the Company’s financial statements. For a reconciliation of sustaining capital expenditures to the consolidated statement of cashflows, see “Reconciliation of Non-GAAP Financial Performance Measures” below. See “Note Regarding Certain Measures of Performance”. |
An update on other projects that will contribute to the current site expansion is set-out below.
- An upgrade to the gravity circuit is underway which is expected to increase free gold recovery from 25% to approximately 40%. The upgrade to the gravity circuit in the first mill line was commissioned in the third quarter of 2022. The installation and commissioning of the upgrade to the gravity circuit in the second mill line is expected in the first quarter of 2023
- An upgrade of the 230kV main substation is planned to improve the power quality at the mine. In addition, the upgrade is expected to improve the site readiness for potential future power expansion for projects such as the trolley assist mine haulage system. The upgrade is expected to be completed in 2024 depending on the timing of equipment deliveries
Exploration at Detour Lake in the third quarter of 2022 was focused on infill drilling under the West Pit and in the West Pit Extension, as well as work on regional targets.
Thirteen drill rigs were active in the third quarter of 2022, completing 18,965 metres of expensed drilling and 54,184 metres of capitalized drilling. In the first nine months of 2022, there have been 31,990 metres of expensed drilling and 150,183 metres of capitalized drilling, putting the Company on track to meet the forecast 234,000 metres of drilling at the Detour Lake mine in 2022.
At the northwestern margin of the West Pit, hole DLM22-473A intersected 2.5 g/t gold over 18.8 metres at 220 metres depth, 1.9 g/t gold over 118.2 metres at 419 metres depth and 0.8 g/t gold over 45.3 metres at 636 metres depth.
In exploration drilling approximately 1,935 metres west of the West Pit, hole DLM22-469 intersected 6.1 g/t gold over 12.2 metres at 918 metres depth in hole DLM22-469, further confirming the down-plunge western extension of the deposit.
Work is ongoing to update the geological model with regards to the underground mineralization, and to determine the amount of infill drilling required to estimate an initial mineral resource.
Odyssey Project – Shaft Sinking Expected to be Initiated in Early 2023; Underground Development on Schedule, with Initial Production Expected in March 2023; Infill Drilling Continues to Return Positive Results at Odyssey South and East Gouldie; Regional Exploration Continues to Test East Gouldie Extension to the West
In the third quarter of 2022, underground development and the critical infrastructure projects for the start-up of production at Odyssey South in March 2023 remained on schedule. Updates on the key activities are set-out below.
- Lateral development has fully transitioned from a mining contractor to Canadian Malartic GP (“the Partnership”) employees. The main ramp reached a depth of 410 metres and development of production levels is underway. The focus in the fourth quarter of 2022 is on stope preparation, with delineation drilling to be initiated shortly
- The maintenance workshop and warehouse were completed in the third quarter of 2022
- The structural steel installation for the paste plant was mostly completed in the third quarter of 2022. The focus in the next six months is on equipment installation at the plant and the construction of the underground paste backfill piping network
- The excavation of a 5.5 metres in diameter return air raise is underway
Pre-commercial production from the Odyssey South orebody is expected to begin before the end of March 2023.
In the third quarter of 2022, the construction of the headframe was slightly behind schedule due to weather conditions, however all other critical activities to initiate shaft sinking progressed as planned. Shaft sinking is now expected to be initiated in early 2023, with no impact on the overall shaft sinking schedule. Updates on the key projects are set-out below.
- The construction of the 120kv line and power station is progressing as anticipated for completion in the fourth quarter of 2022
- Structural steel installation for the headframe reached the sixth floor in the third quarter of 2022. Structural steel installation is sensitive to weather conditions, with no work able to be completed in rain or high winds
- The shaft house, waste silo and temporary sinking hoist building are all progressing as planned, with completion expected in the fourth quarter of 2022
- In the third quarter of 2022, the fabrication of the Galloway (shaft sinking equipment) was completed and its assembly in the shaft was initiated. The assembly is expected to be completed in the fourth quarter of 2022 and the sinking team is scheduled to be mobilized by early January 2023
Inflationary cost pressures were manageable in the third quarter of 2022, with the overall project remaining on budget. Project costs are being re-evaluated to factor-in the potential impact of sustained cost inflation in 2023.
Exploration drilling by the Partnership in the third quarter of 2022 at the Odyssey project targeted the Odyssey South, Odyssey internal zones and East Gouldie deposits and extensions of East Gouldie towards the west and the Norrie Zone. Ten rigs were active at surface and four rigs were active underground in the third quarter of 2022.
In the Odyssey South deposit, hole UGOD-016-074 intersected 5.5 g/t gold over 11.9 metres at 342 metres depth and hole UGOD-016-075 intersected 5.7 g/t gold over 21.8 metres at 366 metres depth.
At East Gouldie, infill drilling in the core of the deposit continues to return wide, high-grade intersections, with recent results including 4.6 g/t gold over 50.7 metres at 1,537 metres depth in hole MEX21-224WAZ.
Hole MEX22-240, drilled approximately 670 metres west of the East Gouldie mineralized envelope, intersected 4.2 g/t gold over 12.8 metres at 1,331 metres depth in an area approximately 100 metres above the Norrie Zone. This result continues to suggest potential connection of the East Gouldie deposit and the Norrie Zone along strike where additional drilling is currently being performed.
Kirkland Lake Region – Commissioning of Shaft #4 at Macassa Expected to Commence in the Fourth Quarter of 2022; Underground Ramp from Macassa to the AK Deposit Completed; Infill Drilling Ongoing and Progressing as Planned to define AK Mineral Resource Potential by year-end 2022
In the third quarter of 2022, focus remained on the primary infrastructure projects related to Shaft #4 and the ventilation upgrades. The commissioning of Shaft #4 is now expected to commence in December 2022, with completion in the first quarter of 2023. In the third quarter of 2022, the various infrastructure projects were on budget as inflationary cost pressures remained manageable. Updates of the key projects are set out below:
- Development work to connect the new shaft infrastructure to the existing mining areas continued to advance during the third quarter of 2022 and the service hoist was commissioned. Construction of the conveyor loadout station is expected to start in the fourth quarter of 2022, with completion in early 2023. The Company’s focus is now on operational readiness in preparation of the Shaft #4 production hoist commissioning, expected to commence in December 2022
- The upgrade of the ventilation system progressed as planned. At the end of the third quarter of 2022, the civil construction for the installation of the two 3,000 HP fans had started. The commissioning of the fans is now expected to be completed in the first quarter of 2023
Exploration at the Macassa mine in the third quarter of 2022 targeted multiple underground zones, including Main Break, South Mine Complex, Near Surface Amalgamated and the adjacent AK deposit, with 10 rigs operating underground (including two rigs in the ramp) and one rig at surface. In the third quarter of 2022, 15,129 metres of capitalized drilling (45,654 metres year to date) and 28,218 metres of expensed drilling (60,418 metres year to date) were completed.
Highlights from the drilling included: in the Main Break, hole 58-736 intersected 25.1 g/t gold over 2.6 metres at 1,831 metres depth, 11.4 g/t gold over 2.2 metres at 1,876 metres depth and 10.2 g/t gold over 1.8 metres at 2,305 metres depth; and at SMC East, hole 58-743 intersected 23.9 g/t gold over 2.3 metres at 1,774 metres depth, 5.8 g/t gold over 1.8 metres at 1,773 metres depth and 11.4 g/t gold over 1.8 metres at 1,772 metres depth
At the AK deposit, an assessment is underway to evaluate the deposit as a potential ore source for the Macassa mine. If the evaluations are positive, AK ore could complement the mill feed at Macassa as early as 2024.
The exploration ramp into the AK deposit was completed in the third quarter of 2022, with 290 metres of development in the quarter. The drilling campaign at AK is expected to be completed on schedule during the fourth quarter and includes infill drilling of higher grade portions of the deposit near the proposed bulk sample. Recent results from the infill drilling at AK include a highlight intercept of 30.7 g/t gold over 3.6 metres at 64 metres depth in hole KLAKC22-193.
Hope Bay – Drilling Activities Accelerated at Doris and Drilling at Madrid Commenced in the Third Quarter of 2022
Exploration drilling at Hope Bay totalled 76,200 metres during the first nine months of 2022 and the Company anticipates completing approximately 100,000 metres of drilling in 2022. Most of this drilling was done at Doris, where three drill rigs are currently operating at surface and three rigs operating underground.
Recent results continue to confirm and extend high-grade mineralization at depth, with highlights west of the BTD Connector area of 7.3 g/t gold over 15.8 metres at 459 metres depth in hole HBD22-037 and 19.6 g/t gold over 4.5 metres at 520 metres depth in hole HBD22-038.
The Company’s priority remains the continued extension of the BCO exploration drive that will connect the BTD Extension and BTD Connector zones in the coming years.
At Madrid, drilling continues to ramp-up with two rigs now operating on surface. A second drill contractor has been mobilized to site to increase drilling capacity moving forward.
Farther south in the Hope Bay belt at the Boston deposit, camp refurbishment has been completed and the site is ready for exploration drilling in 2023.
In the meantime, the technical study continued to progress. Infrastructure at the Madrid site was designed and concepts for the processing facility were advanced in the third quarter of 2022.
2022 Synergy and Optimization Benefits Ahead of Initial Estimates and Schedule
In the third quarter of 2022, the Company’s focus shifted from realizing synergies at the corporate level (primarily general and administrative (“G&A”)) to further identifying and delivering potential operational synergies and strategic optimizations resulting from the Merger.
The corporate level G&A synergies were realized at a higher rate and faster than anticipated. The Company identified over $50 million of annual savings from G&A synergies, with the majority of that already realized for 2022. As a result of the success to date, the Company expects corporate G&A synergies to amount to $225 million before tax in the first five years and up to $425 million over the next ten years. Details of the corporate G&A synergies are provided in the Company’s news release dated July 27, 2022.
Operational synergies and optimization are expected to result from the pooling of resources and the leveraging of expertise across the Company’s operations and regions. Operational synergies and optimizations include opportunities in procurement, energy management, maintenance, Detour Lake plan optimization, streamlining doré marketing, reduction in external consultants and the acceleration of the implementation of technology and innovation. To date, benefits of approximately $20 million have been realized, approximately $10 million from procurement, approximately $5 million from the Detour Lake plan optimization, approximately $2 million from the elimination of external consultants and approximately $3 million from various other initiatives.
In the third quarter of 2022, the Company worked to improve the confidence level on the identified opportunities in the coming year and over the long term. The Company maintains its estimate for potential operational synergies in excess of $130 million per year ($440 million over five years, ramping-up to $1.1 billion over 10 years). Details of the operational synergies are provided in the Company’s news release dated July 27, 2022.
The Company continues to advance strategic opportunities to generate new revenues and reduce current and future expenditures as part of its project pipeline, maintaining the original estimate of up to $240 million over five years and $590 million over 10 years. Some examples of strategic optimization are set out below.
Mining the AK deposit from Macassa Infrastructure:
- In the third quarter of 2022, the exploration ramp from Macassa to the AK deposit and the infill drill program from surface were completed. An infill drilling program from underground is underway, with 9,983 metres completed in 75 holes by the end of the third quarter of 2022
- As part of the regular life of mine planning process, the Company is evaluating the optimal timing of potentially feeding AK ore into the Macassa mill. If the evaluations are positive, AK ore could complement the mill feed at Macassa as early as 2024
Upper Beaver project update:
- Work continues on the engineering for an exploration shaft and the potential to use existing Kirkland Lake Camp equipment and infrastructure to reduce capital expenditures and operating costs at the Upper Beaver project
Improved Budgeting and Costing:
- Over the past three years, the Company has been working on an initiative to more accurately measure and predict operating cost drivers
- This initiative is in the process of being rolled out across all operations and it is anticipated that improved cost control from this initiative could result in operating costs savings of up to $30 million per year by 2026
Strong Financial Flexibility; Focus on Capital Discipline and Returns to Shareholders
On July 24, 2022, the Company repaid $100 million on the 2012 Series A 4.87% senior notes with available cash, reducing the Company’s indebtedness and re-affirming its commitment to maintaining a strong investment grade balance sheet. At September 30, 2022, the Company’s net debt totalled $519.9 million.
In addition to the dividend, the Company continued its focus on shareholder returns through the NCIB, in the third quarter of 2022, under which 999,320 common shares were repurchased for $42.6 million. Under the NCIB, the Company can purchase up to $500 million of its common shares (up to a maximum of 5% of its issued and outstanding common shares) and year-to-date total approximately $65 million has been purchased.
Cash and cash equivalents decreased to $821.8 million at September 30, 2022, from the June 30, 2022 balance of $1,006.9 million, primarily due to the debt repayment, purchases under the NCIB and lower cash flow from operations (lower sales volumes and realized gold prices). As of September 30, 2022, the outstanding balance on the Company’s unsecured revolving bank credit facility was nil, and available liquidity under this facility was approximately $1.2 billion, not including the uncommitted $600 million accordion feature.
In the third quarter of 2022, the Company realized a loss net of tax of approximately $9.4 million on its foreign exchange hedges, partially offset by a realized gain net of tax of approximately $2.5 million on its fuel hedges. Due to the significant strengthening of the US dollar, largely at the end of the third quarter of 2022, the Company recorded unrealized mark-to-market losses on foreign exchange net of tax of approximately $134.5 million arising from its ongoing foreign exchange risk management program. The impact of these derivative products was more than offset by the relatively weaker operating currencies. The Canadian dollar remains the second largest input, after the price of gold, to the Company’s financial results.
Approximately 60% of the Company’s remaining 2022 estimated Canadian dollar exposure is hedged at an average floor price above 1.28 C$/US$. Approximately 37% of the Company’s remaining 2022 estimated Euro exposure is hedged at an average floor price of approximately 1.10 US$/EUR. Approximately 22% of the Company’s remaining 2022 estimated Australian dollar exposure is hedged at an average floor price above 1.45 A$/US$. Approximately 51% of the Company’s remaining 2022 estimated Mexican peso exposure is hedged at an average floor price above 20.35 MXP/US$. The Company’s full year 2022 cost guidance is based on assumed exchange rates of 1.25 C$/US$, 20.00 MXP/US$, 1.20 US$/EUR and 1.32 A$/US$.
The Company has hedged approximately 90% of its remaining diesel exposure in 2022, reducing its exposure to further diesel price volatility. Year to date, the Company has realized approximately $20 million in hedging gains related to fuel. These hedges have partially mitigated the effect of inflationary pressures to date and are expected to provide some protection against inflation going forward.
The Company will continue to monitor market conditions and anticipates continuing to opportunistically add to its operating currency and diesel hedges to strategically support its key input costs. Current hedging positions are not factored into 2022 and future guidance.
In order to maintain financial flexibility, and consistent with past practice, the Company now intends to file a new base shelf prospectus in the fourth quarter of 2022. The Company has generally maintained a base shelf prospectus since 2002. The Company has no present intention to offer securities pursuant to the new base shelf prospectus. The notice set out in this paragraph does not constitute an offer of any securities for sale or an offer to sell or the solicitation of an offer to buy any securities.
Dividend Record and Payment Dates for the Third Quarter of 2022
Agnico Eagle’s Board of Directors has declared a quarterly cash dividend of $0.40 per common share, payable on December 15, 2022 to shareholders of record as of December 1, 2022. Agnico Eagle has declared a cash dividend every year since 1983.
Expected Dividend Record and Payment Dates for the 2022 Fiscal Year
| Record Date | Payment Date |
| December 1, 2022* | December 15, 2022* |
*Declared
Dividend Reinvestment Plan
Please see the following link for information on the Company’s dividend reinvestment plan: Dividend Reinvestment Plan
Capital Expenditures
In the third quarter of 2022, capital expenditures (including sustaining capital expenditures) were $396.5 million and capitalized exploration expenditures were $31.6 million, for a total of $428.1 million. In the first nine months of 2022, capital expenditures (including sustaining capital expenditures) were $980.4 million and capitalized exploration expenditures were $99.3 million, for a total of $1,079.7 million. Capital expenditures were higher than forecast in the third quarter of 2022 primarily due to expenditures that were delayed in the first six months of 2022. In the first nine months of 2022, capital expenditure spending remains slightly behind forecast due to expenditures that were delayed.
Total capital expenditures (excluding capitalized exploration) for 2022 remain estimated to be approximately $1.4 billion.
The following table sets out capital expenditures and capitalized exploration in the third quarter of 2022 and the first nine months of 2022.
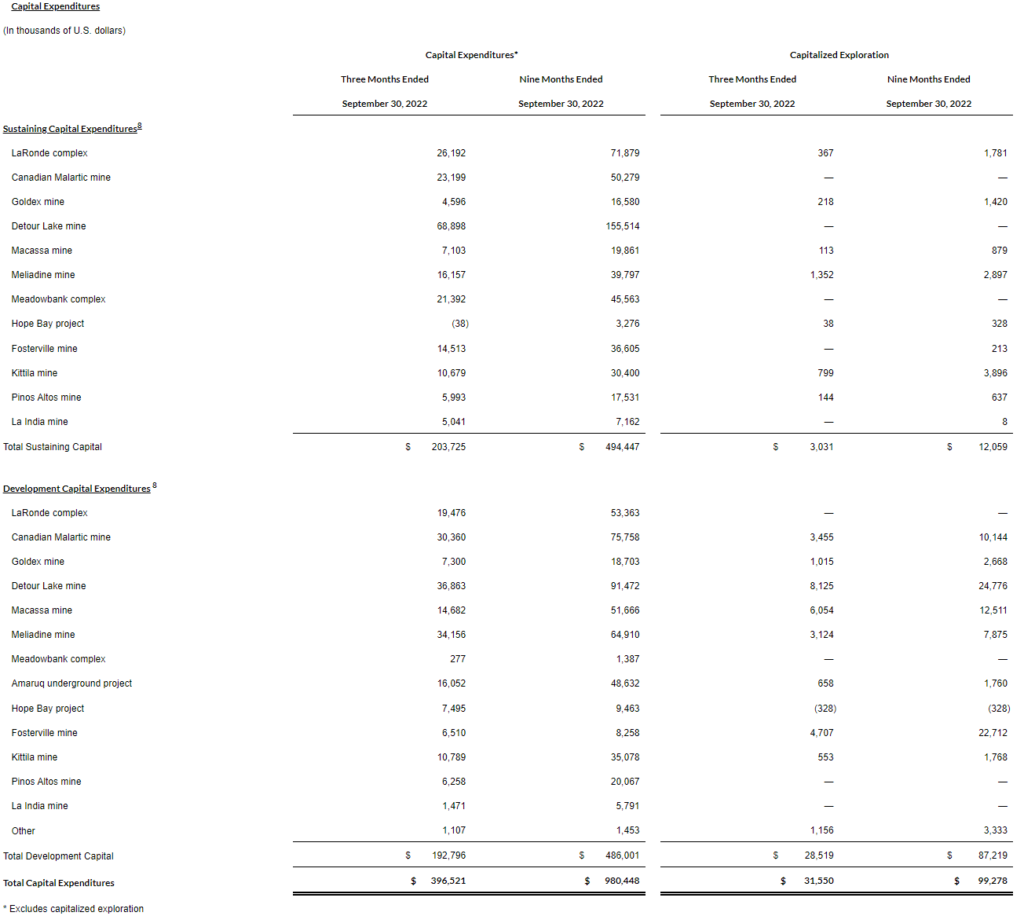
* Excludes capitalized exploration
| 8 | Sustaining capital expenditures and development capital expenditures are non-GAAP measures that are not standardized financial measures under the financial reporting framework used to prepare the Company’s financial statements. See “Note Regarding Certain Measures of Performance” and “Reconciliation of Non-GAAP Performance Measures – Reconciliation of Sustaining Capital Expenditures to Consolidated Statements of Cash Flow.” |
2022 Guidance Unchanged
Expected payable gold production in 2022 remains unchanged at between 3.2 and 3.4 million ounces with total cash costs per ounce and AISC per ounce expected to be near the top end of the guided ranges of $725 and $775 and $1,000 and $1,050, respectively, as a result of continued inflationary cost pressures.
Total expected capital expenditures (excluding capitalized exploration) for 2022 remain estimated to be approximately $1.4 billion. Guidance for 2022 includes production, costs and capital for the period commencing January 1, 2022 at the Detour Lake, Macassa and Fosterville mines.
The estimated 2022 depreciation and amortization expense provided on February 23, 2022 considered a preliminary fair value allocation to the Kirkland Lake Gold assets. The 2022 depreciation and amortization expense guidance is now expected to be closer to the bottom end of the range of $1.25 to $1.35 billion for the full year 2022. The finalization of the Purchase Price Allocation will take place within the twelve months following the acquisition date and, as such, the depreciation estimate is subject to change.
Cost Inflation
Overall, inflation on production costs is estimated to be in the range of 5% to 7% for 2022, mainly driven by higher input prices on key consumables (such as fuel, cyanide, steel) which have experienced increases above the 5% to 7% general inflation rate. In the third quarter of 2022, the Company continued to partially offset these costs pressures with solid operational performance, the pooling of resources within the regions in which the Company operates, optimization and cost-saving initiatives, synergies resulting from the Merger and positive foreign exchange impacts. In addition, the Company’s active fuel hedging program has also helped reduce the impact of rising costs.
With the Nunavut sea-lift season complete and key consumables arriving on site, the inventory will provide price stability for any short-term price fluctuations on key consumables until the 2023 sea-lift season.
While the Company believes there are positive signs with respect to the easing of current inflationary pressures, such as below-peak fuel prices and global supply chain relief, the Company expects these pressures could still be challenging in the fourth quarter of 2022 and into 2023. The Company now expects full-year costs to be closer to the top end of the guidance range. The Company’s focus will continue to be on increasing operational efficiencies and cost optimization at all mining operations and managing its currency and diesel price risks by opportunistically adding currency and fuel hedges. Beyond 2022, the Company anticipates that the potential synergies associated with the Merger will help mitigate potential future cost increases.
Demonstrating Strong Environmental, Social and Governance (“ESG”) Performance
The Company is committed to providing a safe place to work and to maintaining the highest health and safety standards for its employees. In 2020, Agnico Eagle launched its Towards Zero Accident initiative, a two-pronged approach focused on understanding and improving safety to create an accident-free environment at all its sites. The Company achieved a significant milestone in the third quarter of 2022 by recording the best safety performance in its 65 year history.
By working together with its business partners, communities and other stakeholders, the Company continuously strives to achieve its sustainability goals and further enhance its leadership in ESG. In the third quarter of 2022, these efforts and contributions continued to be recognized by outside organizations, including:
- LaRonde – Human Resources award at the Quebec Mining Association congress for its innovative development of virtual training modules for underground mining and processing facilities that improved learning and engagement
- Goldex – Production and Transformation Award at the 42nd edition of the Val-d’Or Chamber of Commerce’s Corporate Gala for its long-term productivity and growth through technology
- Mexico – Agnico Eagle Mexico was awarded 17th place among the Top 100 of the best companies to work for in Mexico by Great Place to Work®
- La India – Distinction of Socially Responsible Company, a distinction granted by the Mexican Center for Philanthropy (Centro Mexicano para la Filantropía) and the Foundation for Sustainability and Equity (Alianza por la Responsabilidad Social Empresarial en México) to recognize companies for their commitment to ensuring the well-being of employees, operating with superior business ethics, community outreach and environmental care and preservation
- Fosterville – Two of Fosterville’s employees, an exploration geologist and the director of environment and government relations, were recognized by the Council of Australia with the 2022 Exceptional Young Woman in Victorian Resources Award and the 2022 Exceptional Woman in Victorian Resources Award, respectively
The Company continues to be committed to addressing climate-change and reaching net-zero by 2050. Supporting this commitment, the Board approved adopting an interim target to reduce greenhouse gas emissions by 30% by 2030. In the third quarter of 2022, the corporate and minesite climate change working groups completed climate-change related risks, resilience and adaptation assessments for all of the Company’s operations. With the compilation of these assessments, the Company is establishing an action plan to meet its commitment to a net-zero future. The Company will be releasing a Climate Action report in the fourth quarter of 2022.
Teck and Agnico Eagle Agreement on the San Nicolás Copper-Zinc Project located in Zacatecas, Mexico
On September 16, 2022, the Company and Teck Resources Limited (“Teck”) announced that the Company has agreed to subscribe for a 50% interest in Minas de San Nicolás, S.A.P.I. de C.V. (“MSN”), a wholly-owned Teck subsidiary which owns the San Nicolás copper-zinc development project located in Zacatecas, Mexico (the “Transaction”). As a result of the Transaction, Teck and Agnico Eagle will become 50/50 joint venture partners at San Nicolás.
Closing of the Transaction is subject to customary conditions precedent, including receipt of necessary regulatory approvals, and is expected to occur in the first half of 2023. For additional details with respect to the Transaction, please see the Company and Teck’s joint news release dated September 16, 2022.
Third Quarter 2022 Results Conference Call and Webcast Tomorrow
Agnico Eagle’s senior management will host a conference call on Thursday, October 27, 2022 at 11:00 AM (E.D.T.) to discuss the Company’s third quarter of 2022 financial and operating results.
Via Webcast:
A live audio webcast of the conference call will be available on the Company’s website www.agnicoeagle.com.
Via Telephone:
For those preferring to listen by telephone, please dial 1-416-764-8659 or toll-free 1-888-664-6392. To ensure your participation, please call approximately five minutes prior to the scheduled start of the call.
Replay archive:
Please dial 1-416-764-8677 or toll-free 1-888-390-0541, access code 837255#. The conference call replay will expire on November 27, 2022.
The webcast, along with presentation slides, will be archived for 180 days on the Company’s website.
ABITIBI REGION, QUEBEC
Agnico Eagle is Quebec’s largest gold producer with a 100% interest in the LaRonde complex (which includes the LaRonde and LaRonde Zone 5 (“LZ5”) mines), the Goldex mine and a 50% interest in the Canadian Malartic mine. These mines are located within 50 kilometres of each other, which provides operating synergies and allows for the sharing of technical expertise.
LaRonde Complex – Operational Challenges Affect Development and Production in the Third Quarter of 2022
The 100% owned LaRonde mine in northwestern Quebec achieved commercial production in 1988. The LZ5 property lies adjacent to and west of the LaRonde mine and previous operators exploited the zone by open pit mining. The LZ5 mine achieved commercial production in June 2018.
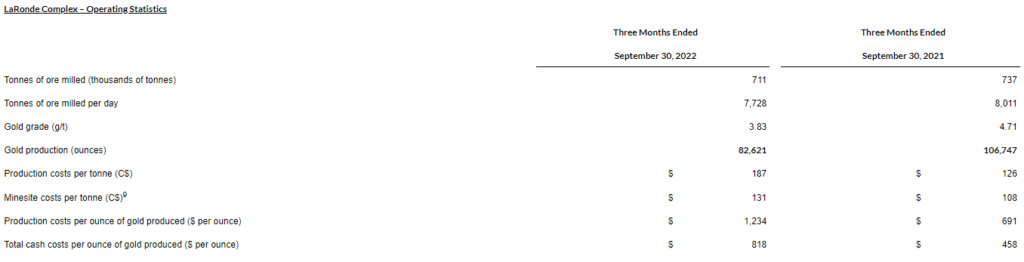
Gold production in the third quarter of 2022 decreased when compared to the prior-year period primarily due to lower gold grades and lower processing volumes related to changes in the mining sequence at the LaRonde mine as explained below.
Production costs per tonne in the third quarter of 2022 increased when compared to the prior-year period primarily as a result of the timing of unsold concentrate inventory, higher unit costs for fuel, materials and reagents and lower throughput levels. Production costs per ounce in the third quarter of 2022 increased when compared to the prior-year period primarily as a result of the timing of unsold concentrate inventory, lower gold production and higher unit costs for fuel, materials and reagents.
Minesite costs per tonne in the third quarter of 2022 increased when compared to the prior-year period primarily due to higher unit costs for fuel, materials and reagents and lower throughput levels. Total cash costs per ounce in the third quarter of 2022 increased when compared to the prior-year period primarily due to higher minesite costs per tonne, lower by-product revenues from lower mill throughput and lower gold production.
| 9 | Minesite costs per tonne is a non-GAAP measure that does not have a standardized meaning under the financial reporting framework used to prepare the Company’s financial statements. For a reconciliation to production costs see “Reconciliation of Non-GAAP Performance Measures” below. See also “Note Regarding Certain Measures of Performance”. |
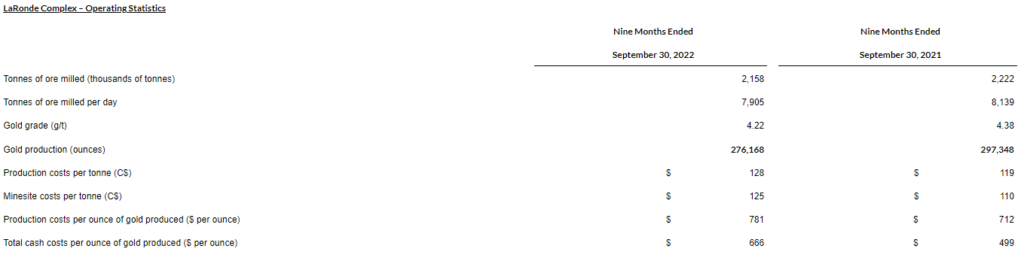
Gold production in the first nine months of 2022 decreased when compared to the prior-year period due to lower gold grades and lower mill throughput. The lower mill throughput resulted from lower mine productivity due to slower than expected development which was revised in the second quarter of 2022 and unplanned maintenance to the ore pass and lower mechanical availability from the automated equipment due to supply chain issues.
Production costs per tonne in the first nine months of 2022 increased when compared to the prior-year period primarily as a result of lower throughput levels and higher unit costs for fuel, materials and reagents. Production costs per ounce in the first nine months of 2022 increased when compared to the prior-year period primarily as a result of higher production costs per tonne and lower gold production.
Minesite costs per tonne in the first nine months of 2022 increased when compared to the prior-year period primarily due to lower throughput levels and higher unit costs for fuel, materials and reagents. Total cash costs per ounce in the first nine months of 2022 increased when compared to the prior-year period primarily due to higher minesite costs per tonne, lower by-product revenues from lower mill throughput and lower gold production.
Operational Highlights
- In the third quarter of 2022, the development rate continued to be lower than the forecast because of supplemental ground support requirements at the East mine and revised seismic protocols. This delay in lateral development affected the mining sequence and the mining rate the LaRonde mine
- Production was further affected by maintenance to the coarse ore conveyor ore pass that took longer than anticipated and lower mechanical availability from the automated equipment due to delays in delivering spare parts. In the fourth quarter of 2022, the LaRonde complex is now expected to operate at a similar run-rate as in the third quarter of 2022
Project Highlights
- The construction of the drystack tailings facilities continued to progress on schedule. The commissioning of the filtration plant is expected to begin in the fourth quarter of 2022 and the new deposition method for tailings is expected to commence in the fourth quarter of 2022
Exploration Highlights
- In the third quarter of 2022, exploration drilling from Level 317 at the LaRonde mine returned a highlight intersection of 9.5 g/t gold, 22 g/t silver and 0.70% copper over 15.6 metres at 3,410 metres depth in hole LR-317-011 in the East mine area of Zone 20N. These results are expected to have a positive impact on the inferred mineral resource estimate at year-end 2022
- In the third quarter of 2022, progress continued to be made in extending the exploration drift on Level 215 towards the west. Drilling from the drift will test several targets between the LaRonde and LZ5 mines below the historical Bousquet 1 & 2 mines
- At the LZ5 mine, results from recent exploration drilling into Zone 3 and Zone 5 are expected during the fourth quarter of 2022
Canadian Malartic – Gold Production In-line with Forecast; Underground Development and Surface Construction Activities at Odyssey Remain on Schedule for Pre-Commercial Production in March 2023
In June 2014, Agnico Eagle and Yamana Gold Inc. (“Yamana”) acquired Osisko Mining Corporation (now Canadian Malartic Corporation) and created the Partnership. The Partnership owns the Canadian Malartic mine in northwestern Quebec and operates it through a joint management committee. Each of Agnico Eagle and Yamana has a direct and indirect 50% ownership interest in the Partnership. All volume data in this section reflect the Company’s 50% interest in the Canadian Malartic mine, except as otherwise indicated. The Odyssey underground project was approved for construction in February 2021.
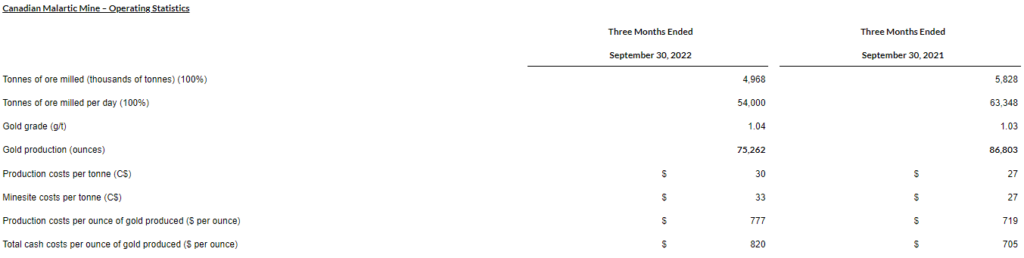
Gold production in the third quarter of 2022 decreased when compared to the prior-year period primarily due to lower mill throughput, partially offset by higher metallurgical recovery. As planned, starting in February 2022, the mill throughput levels were reduced to approximately 51,500 tonnes per day (“tpd”) (on a 100% basis) in an effort to optimize the production profile and cash flows during the transition to processing ore from the underground Odyssey project. The mill throughput is forecast to return to full capacity of approximately 60,000 tpd (on a 100% basis) in the second half of 2024.
Production costs per tonne in the third quarter of 2022 increased when compared to the prior-year period primarily due to inventory adjustments resulting from the consumption of ore stockpile and higher mining and milling costs from lower throughput and higher fuel prices, partially offset by a higher deferred stripping adjustment. Production costs per ounce in the third quarter of 2022 increased when compared to the prior-year period primarily due to higher production costs per tonne, partially offset by the weakening of the Canadian dollar against the U.S. dollar and higher gold grades.
Minesite costs per tonne in the third quarter of 2022 increased when compared to the prior-year period primarily due to inventory adjustments resulting from the consumption of ore stockpile and higher mining costs from lower throughput and higher fuel prices, partially offset by a higher deferred stripping adjustment. Total cash costs per ounce in the third quarter of 2022 increased when compared to the prior-year period primarily due to higher minesite costs per tonne, partially offset by the weakening of the Canadian dollar against the U.S. dollar.
Gold production in the first nine months of 2022 decreased when compared to the prior-year period primarily due to the planned reduction of mill throughput to approximately 51,500 tpd (100% basis) starting in February 2022, partially offset by higher metallurgical recovery and higher gold grades.
Production costs per tonne in the first nine months of 2022 increased when compared to the prior-year period primarily due to higher mine and mill production costs resulting from lower throughput levels, higher fuel costs and a lower deferred stripping adjustment. Production costs per ounce in the first nine months of 2022 increased when compared to the prior-year period primarily due to higher production costs per tonne, partially offset by higher gold grades.
Minesite costs per tonne in the first nine months of 2022 increased when compared to the prior-year period primarily due to higher mine and mill production costs resulting from lower throughput levels, higher fuel costs and a lower deferred stripping adjustment. Total cash costs per ounce in the first nine months of 2022 increased when compared to the prior-year period primarily due to higher production costs per tonne, partially offset by higher gold grades.
Operational Highlights
- Solid overall operating performance resulted in gold production and unit costs on target in the third quarter of 2022
Project and Exploration Highlights
- An update on Odyssey project development, construction and exploration highlights is set out in the Key Value Drivers section above
Goldex – Increased Productivity from the South Zone Helps Drive Higher Gold Production; Surface Work Now Underway at Akasaba West Project
The 100% owned Goldex mine in northwestern Quebec began production from the M and E zones in September 2013. Commercial production from the Deep 1 Zone commenced on July 1, 2017. The Company approved the development of the Akasaba West project, located less than 30 kilometres from Goldex, in July 2022.
| Goldex Mine – Operating Statistics | ||||
| Three Months Ended | Three Months Ended | |||
| September 30, 2022 | September 30, 2021 | |||
| Tonnes of ore milled (thousands of tonnes) | 710 | 695 | ||
| Tonnes of ore milled per day | 7,717 | 7,554 | ||
| Gold grade (g/t) | 1.67 | 1.40 | ||
| Gold production (ounces) | 33,889 | 28,823 | ||
| Production costs per tonne (C$) | $ 48 | $ 42 | ||
| Minesite costs per tonne (C$) | $ 49 | $ 41 | ||
| Production costs per ounce of gold produced ($ per ounce) | $ 776 | $ 806 | ||
| Total cash costs per ounce of gold produced ($ per ounce) | $ 804 | $ 762 |
Gold production in the third quarter of 2022 increased when compared to the prior-year period primarily due to higher gold grades and higher throughput levels resulting from higher productivity from the higher grade South Zone and higher throughput from the Rail-Veyor system.
Production costs per tonne in the third quarter of 2022 increased when compared to the prior-year period primarily due to higher mine development and production costs resulting from increased development and production from the South Zone and higher mill costs resulting from higher unit costs for reagents and grinding media. Production costs per ounce in the third quarter of 2022 decreased when compared to the prior-year period primarily due to higher gold grades and the weakening of the Canadian dollar against the U.S. dollar, partially offset by higher production costs per tonne.
Minesite costs per tonne in the third quarter of 2022 increased when compared to the prior-year period due to the same factors causing a higher production cost per tonne. Total cash costs per ounce in the third quarter of 2022 increased when compared to the prior-year period due to higher minesite costs per tonne, partially offset by higher gold grades resulting in higher gold production.
| Goldex Mine – Operating Statistics | ||||
| Nine Months Ended | Nine Months Ended | |||
| September 30, 2022 | September 30, 2021 | |||
| Tonnes of ore milled (thousands of tonnes) | 2,192 | 2,145 | ||
| Tonnes of ore milled per day | 8,029 | 7,857 | ||
| Gold grade (g/t) | 1.68 | 1.57 | ||
| Gold production (ounces) | 105,211 | 98,132 | ||
| Production costs per tonne (C$) | $ 46 | $ 41 | ||
| Minesite costs per tonne (C$) | $ 47 | $ 41 | ||
| Production costs per ounce of gold produced ($ per ounce) | $ 751 | $ 723 | ||
| Total cash costs per ounce of gold produced ($ per ounce) | $ 765 | $ 686 |
Gold production in the first nine months of 2022 increased when compared to the prior-year period primarily due to higher gold grades and higher throughput levels. In the first nine months of 2022, the Goldex mine continued to deliver solid performance in line with the production plan and included increased production from the higher grade South Zone and higher throughput from the Rail-Veyor system.
Production costs per tonne in the first nine months of 2022 increased when compared to the prior-year period primarily due to higher mine development and production costs resulting from higher ground support costs, increased development and production from the South Zone and higher mill costs resulting from higher unit costs for reagents and grinding media. Production costs per ounce in the first nine months of 2022 increased when compared to the prior-year period primarily due to higher production costs per tonne, partially offset by higher gold grades and the weakening of the Canadian dollar against the U.S. dollar.
Minesite costs per tonne in the first nine months of 2022 increased when compared to the prior-year period primarily due to the same factors causing a higher production costs per tonne. Total cash costs per ounce in the first nine months of 2022 increased when compared to the prior-year period due to higher minesite costs per tonne, partially offset by higher gold grades resulting in higher gold production.
Operational Highlights
- In the third quarter of 2022, the mining rate in the South Zone continued to be higher than anticipated, with lower dilution and higher mining recovery. This performance resulted in the processing of higher gold grades
- In the third quarter of 2022, underground ore tonnage mined was lower than forecast due to low stope availability in the Main Zone in August and resulted in slightly lower mill throughput than anticipated
- A new geological interpretation of South Zone Sector #3 is currently under review with the potential to contribute additional gold mineral reserves
Akasaba West Project
- Work commenced at the approved Akasaba West project in September 2022. The main contractor was mobilized and initiated clearing activities. The removal of overburden and the installation of surface infrastructure (offices, water treatment installation) are expected to commence in the fourth quarter of 2022
ABITIBI REGION, ONTARIO
Agnico Eagle acquired the Detour Lake and Macassa mines on February 8, 2022 as a result of the Merger with Kirkland Lake Gold. With the inclusion of these two assets in its portfolio, the Company is now Ontario’s largest gold producer. Furthermore, the proximity of these mines to the Company’s operations located in the Abitibi region of Quebec provides operating synergies and allows for the sharing of technical expertise.
Detour Lake – Solid Operational and Cost Performance; Commissioning of Secondary Crusher Screen on Line 2 Resulted in Increased Daily Mill Throughput
The Detour Lake mine is located in northeastern Ontario, approximately 300 kilometres northeast of Timmins and 185 kilometres by road northeast of Cochrane, within the northernmost portion of the Abitibi Greenstone Belt.
In 1987, Placer Dome Inc. began underground gold production at the Detour Lake property and during the initial 12 years of mining (from 1987 to 1999) production was approximately 1.7 million ounces of gold from approximately 14.3 million tonnes grading 3.82 g/t gold. In 2013, Detour Gold Corporation restarted gold production via open pit mining. The Detour Lake mine is now the largest gold producing mine in Canada with the largest gold reserves and substantial growth potential. It has an estimated mine life of approximately 30 years.
| Detour Lake – Operating Statistics* | ||||
| Three Months Ended | Nine Months Ended | |||
| September 30, 2022 | September 30, 2022 | |||
| Tonnes of ore milled (thousands of tonnes) | 6,505 | 16,294 | ||
| Tonnes of ore milled per day | 70,701 | 69,334 | ||
| Gold grade (g/t) | 0.91 | 0.98 | ||
| Gold production (ounces) | 175,487 | 471,445 | ||
| Production costs per tonne (C$) | $ 23 | $ 29 | ||
| Minesite costs per tonne (C$) | $ 25 | $ 24 | ||
| Production costs per ounce of gold produced ($ per ounce) | $ 648 | $ 787 | ||
| Total cash costs per ounce of gold produced ($ per ounce) | $ 691 | $ 650 | ||
*In the first nine months of 2022, the operating statistics are reported for the period from February 8, 2022 to September 30, 2022.
In the third quarter of 2022, gold production at the Detour Lake mine was 175,487 ounces, with production costs per tonne of C$23, production costs per ounce of $648, minesite costs per tonne of C$25 and total cash costs per ounce of $691.
For the period from February 8, 2022 to September 30, 2022, gold production at the Detour Lake mine was 471,445 ounces, with production costs per tonne of C$29, production costs per ounce of $787, minesite costs per tonne of C$24 and total cash costs per ounce of $650.
In the first nine months of 2022, the difference between production costs per tonne and minesite costs per tonne and the difference between production costs per ounce and total cash costs per ounce are primarily due to the inventory re-valuation at the forecast gold price in the period the inventory was expected to be sold, which was done as part of the Purchase Price Allocation following the completion of the Merger.
Operational Highlights
- For the complete first nine months of 2022 including the period before the Merger, total gold production at the Detour Lake mine was ahead of forecast at 552,835 ounces, resulting from solid operational execution and a positive grade reconciliation
- In the third quarter of 2022, the Company continued to deliver solid operational performance at the mine, with high equipment availability and productivity
- Tonnage milled was slightly lower than forecast in July and August 2022. Mill throughput was affected by a 32 hour power outage and the installation of the screens before the secondary crusher on the second mill circuit, originally scheduled to be done in the second quarter of 2022. Mill throughput was higher than anticipated in September 2022 following the commissioning of the crusher screens on the second mill circuit. The installation and commissioning of screens before the secondary crusher on the first mill circuit is expected to be completed in the fourth quarter of 2022
- In the third quarter of 2022, despite cost pressures primarily related to energy prices, the Detour Lake mine achieved lower total cash costs per ounce than anticipated primarily due to higher gold grade
Project and Exploration Highlights
- An update on the multiple initiatives to increase mill throughput to 28 Mtpa by 2025, potential expansion scenarios and exploration highlights is set out in the Key Value Drivers section above
Macassa – Sustained Productivity Improvements Drive Strong Operational and Cost Performance; Shaft #4 Project and Ventilation Upgrade on Schedule to Commence Commissioning in Late 2022
The Macassa mine, located in northeastern Ontario, began production in 1933. Operations have been continuous except for a brief period, when they were suspended in 1999 due to low gold prices. Underground mining restarted in 2002 and over the last 10 years production has been predominately from two production areas: the South Mine Complex and the Main Break.
| Macassa Mine – Operating Statistics* | ||||
| Three Months Ended | Nine Months Ended | |||
| September 30, 2022 | September 30, 2022 | |||
| Tonnes of ore milled (thousands of tonnes) | 75 | 210 | ||
| Tonnes of ore milled per day | 814 | 894 | ||
| Gold grade (g/t) | 21.89 | 20.77 | ||
| Gold production (ounces) | 51,775 | 137,525 | ||
| Production costs per tonne (C$) | $ 588 | $ 605 | ||
| Minesite costs per tonne (C$) | $ 628 | $ 559 | ||
| Production costs per ounce of gold produced ($ per ounce) | $ 648 | $ 719 | ||
| Total cash costs per ounce of gold produced ($ per ounce) | $ 689 | $ 659 | ||
*In the first nine months of 2022, the operating statistics are reported for the period from February 8, 2022 to September 30, 2022.
In the third quarter of 2022, gold production at the Macassa mine was 51,775 ounces, with production costs per tonne of C$588, production costs per ounce of $648, minesite costs per tonne of C$628 and total cash costs per ounce of $689.
For the period from February 8, 2022 to September 30, 2022, gold production at the Macassa mine was 137,525 ounces, with production costs per tonne of C$605, production costs per ounce of $719, minesite costs per tonne of C$559 and total cash costs per ounce of $659.
In the first nine months of 2022, the difference between production costs per tonne and minesite costs per tonne and the difference between production costs per ounce and total cash costs per ounce are primarily due to the inventory re-valuation at the forecast gold price in the period the inventory was expected to be sold, which was done as part of the Purchase Price Allocation following the completion of the Merger.
Operational Highlights
- For the complete first nine months of 2022 including the period before the Merger, total gold production at the Macassa mine was 156,980 ounces, ahead of forecast primarily due to higher than planned mined and milled tonnage
- Improved ventilation in the deep mine, resulting from the connection of Shaft #4 to the existing mine infrastructure, contributed to lowering air temperatures and improved working conditions underground. The improved ventilation also allowed for increased diesel truck utilization to supplement the battery powered equipment fleet
- The productivity gains resulting from improved ventilation, better adherence to plan and other operational efficiencies were sustained through the third quarter of 2022 and drove strong operational performance
- In the third quarter of 2022, the Macassa mine achieved lower minesite costs per tonne and total cash costs per ounce than forecast primarily due to higher productivity and higher than forecast mill throughput
Project and Exploration Highlights
- An update on the various infrastructure projects associated with Shaft #4, ramping-up production and exploration highlights is set out in the Key Value Drivers section above
NUNAVUT
Agnico Eagle considers Nunavut a politically attractive and stable jurisdiction with enormous geological potential. With the Company’s Meliadine mine and Meadowbank complex (including the Amaruq satellite deposit), together with the Hope Bay project and other exploration projects, Nunavut has the potential to be a strategic operating platform for the Company with the ability to generate strong gold production and cash flows over several decades.
In December 2021, as a result of the increase in COVID-19 cases at its Nunavut operations, the Company took the precautionary step to send home the Nunavut based workforce and reduce site activities. All site activities ramped back to normal operating levels from mid-January into February 2022. The return of the Nunavut based workforce started on March 14, 2022, after consultation with the Nunavut Government and other local stakeholders. The reintegration was completed in early April 2022.
Meliadine Mine – Planned Mill Shutdown Affected Gold Production; Solid Mine Operational Performance; Ramping-up Usage of Autonomous Haulage
Located near Rankin Inlet in the Kivalliq District of Nunavut, Canada, the Meliadine project was acquired in July 2010. The Company owns 100% of the 98,222-hectare property. In February 2017, the Company’s Board of Directors approved the construction of the Meliadine project and commercial production was declared on May 14, 2019.
| Meliadine Mine – Operating Statistics* | ||||
| All metrics exclude pre-commercial production tonnes and ounces | Three Months Ended | Three Months Ended | ||
| September 30, 2022 | September 30, 2021 | |||
| Tonnes of ore milled (thousands of tonnes) | 401 | 377 | ||
| Tonnes of ore milled per day** | 4,359 | 4,572 | ||
| Gold grade (g/t) | 7.33 | 7.58 | ||
| Gold production (ounces) | 91,201 | 90,143 | ||
| Production costs per tonne (C$) | $ 229 | $ 187 | ||
| Minesite costs per tonne (C$) | $ 226 | $ 202 | ||
| Production costs per ounce of gold produced ($ per ounce) | $ 788 | $ 624 | ||
| Total cash costs per ounce of gold produced ($ per ounce) | $ 777 | $ 634 | ||
*In the third quarter of 2021, the Tiriganiaq open pit had 6,881 ounces of pre-commercial gold production.
**Excluding tonnes milled on a pre-commercial production basis, the mill operated for an equivalent of 82 days in the third quarter of 2021
Gold production in the third quarter of 2022 increased when compared to the prior-year period (excluding pre-commercial production). Gold production decreased in the third quarter of 2022 when compared to the prior year period (including pre-commercial production) primarily due to lower throughput levels resulting from lower mill availability and lower gold grades resulting from an increase in tonnage sourced from the open pit.
Production costs per tonne in the third quarter of 2022 increased when compared to the prior-year period due to inventory adjustments resulting from the timing of unsold inventory, higher services costs related to inflationary pressures on transportation and higher mining and general site unit costs resulting from lower throughput levels, partially offset by a higher mining rate resulting in a positive stockpile adjustment. Production costs per ounce in the third quarter of 2022 increased when compared to the prior-year period due to lower gold grades and higher production costs per tonne and the timing of unsold inventory.
Minesite costs per tonne in the third quarter of 2022 increased when compared to the prior-year period primarily due to higher services costs related to inflationary pressures on transportation and higher mining and general site unit costs resulting from lower throughput levels, partially offset by a higher mining rate resulting in a positive stockpile adjustment. Total cash costs per ounce in the third quarter of 2022 increased when compared to the prior-year period due to lower gold grades and higher minesite costs per tonne.
| Meliadine Mine – Operating Statistics* | ||||
| All metrics exclude pre-commercial production tonnes and ounces | Nine Months Ended | Nine Months Ended | ||
| September 30, 2022 | September 30, 2021 | |||
| Tonnes of ore milled (thousands of tonnes) | 1,282 | 1,039 | ||
| Tonnes of ore milled per day** | 4,696 | 4,590 | ||
| Gold grade (g/t) | 6.77 | 7.51 | ||
| Gold production (ounces) | 269,477 | 265,787 | ||
| Production costs per tonne (C$) | $ 235 | $ 220 | ||
| Minesite costs per tonne (C$) | $ 234 | $ 214 | ||
| Production costs per ounce of gold produced ($ per ounce) | $ 879 | $ 683 | ||
| Total cash costs per ounce of gold produced ($ per ounce) | $ 866 | $ 626 | ||
*In the first nine months of 2021, the Tiriganiaq open pit had 24,057 ounces of pre-commercial gold production.
**Excluding tonnes milled on a pre-commercial production basis, the mill operated for an equivalent of 226 days in the first nine months of 2021
Gold production in the first nine months of 2022 increased when compared to the prior-year period (excluding pre-commercial production). Gold production in the first nine months of 2022 decreased when compared to prior year period (including pre-commercial production) primarily due to lower gold grades resulting from increased ore tonnes sourced from the open pit and the lower grade stockpiles, partially offset by higher throughput levels resulting from the planned expansion of the mill to 4,800 tpd. The COVID-19 pandemic affected the underground mine activities, particularly in January 2022. To compensate for the shortfall in mine production in the first six months of 2022, low-grade stockpile ore was used to feed to the mill.
Production costs per tonne in the first nine months of 2022 increased when compared to the prior-year period due to inventory adjustments resulting from the consumption of the low-grade stockpile, partially offset by higher throughput levels and a higher deferred stripping adjustment. Production costs per ounce in the first nine months of 2022 increased when compared to the prior-year period due to lower gold grades and higher production costs per tonne.
Minesite costs per tonne in the first nine months of 2022 increased when compared to the prior-year period primarily due to inventory adjustments resulting from the consumption of the low-grade stockpile, the timing of unsold concentrate inventory and higher open pit mining costs, partially offset by higher throughput levels and a higher deferred stripping adjustment. Total cash costs per ounce in the first nine months of 2022 increased when compared to the prior-year period due to lower gold grades and higher minesite costs per tonne.
Operational Highlights
- In the third quarter of 2022, underground development was lower than forecast primarily due to the caribou migration in July, lower equipment availability and a planned electrical shutdown that lasted longer than anticipated. The delay in development is not expected to impact the mining sequence in the fourth quarter of 2022
- In the third quarter of 2022, mill throughput was affected by a planned mill shutdown. The SAG mill liners were replaced, which resulted in a slower mill ramp-up than anticipated. In addition, filter press 3 was overhauled over a three week period, limiting the mill throughput at 200 tonnes per hour. Finally, a planned shutdown of the crusher also limited the mill throughput to 210 tonnes per hour over a two week period. In September 2022, the mill throughput was back to normalized levels
- In the third quarter of 2022, the Company continued to implement automated mucking and haulage activities between shifts and saw a steady increase in reliability and productivity. Automation was used on 83% of days in the quarter
- The sealift activities for the 2022 season were successfully completed in October 2022
Projects
- The Phase 2 mill expansion is expected to be completed in mid-2024 when the processing rate is forecast to increase to 6,000 tpd. Engineering work and procurement activities are progressing according to plan. The construction of the CIL, filter-press and power plant facilities has commenced, with piling completed and architectural work expected to start in the fourth quarter of 2022
Exploration Highlights
- Exploration drilling at Meliadine in the third quarter of 2022 focused on the Tiriganiaq, Wesmeg, Normeg and F-Zone deposits
- Conversion drilling at Tiriganiaq returned a highlight intercept of 9.7 g/t gold over 4.2 metres at 124 metres depth in Lode 1000 in hole ML425-9732-D9
- Conversion drilling at Wesmeg returned a highlight intercept of 8.7 g/t gold over 2.6 metres at 160 metres depth in Lode 650 in hole ML450-9290-D5
- The Company has developed a new litho-structural model for Normeg that has led to further drilling success, including highlight hole ML375-96641-U4, which returned 5.1 g/t gold over 18.3 metres at 137 metres depth in Lode 903
- Exploration drilling at the F-Zone is expected to have a positive impact on the inferred mineral resource estimate at year-end 2022, with a recent highlight intercept in hole M22-3436 of 6.8 g/t gold over 4.1 metres at 379 metres depth
Meadowbank Complex – Record Quarterly Gold Production from Higher Throughput and Higher Gold Grades; Four Millionth Gold Ounce Poured; Amaruq Underground Project Completed on Schedule and on Budget with Commercial Production Achieved on August 1, 2022
The 100% owned Meadowbank complex is located approximately 110 kilometres by road north of Baker Lake in the Kivalliq District of Nunavut, Canada. The complex consists of the Meadowbank mine and mill and the Amaruq satellite deposit, which is located 50 kilometres northwest of the Meadowbank mine. The Meadowbank mine achieved commercial production in March 2010, and mining activities at the site were completed by the fourth quarter of 2019.
The Amaruq mining operation uses the infrastructure at the Meadowbank minesite. Additional infrastructure has also been built at the Amaruq site. Amaruq ore is transported using long haul off-road type trucks to the mill at the Meadowbank site for processing. The Amaruq satellite deposit achieved commercial production on September 30, 2019.
| Meadowbank Complex – Operating Statistics | ||||
| Three Months Ended | Three Months Ended | |||
| September 30, 2022 | September 30, 2021 | |||
| Tonnes of ore milled (thousands of tonnes) | 1,031 | 971 | ||
| Tonnes of ore milled per day | 11,207 | 10,554 | ||
| Gold grade (g/t) | 4.11 | 3.13 | ||
| Gold production (ounces) | 122,994 | 89,706 | ||
| Production costs per tonne (C$) | $ 135 | $ 142 | ||
| Minesite costs per tonne (C$) | $ 144 | $ 144 | ||
| Production costs per ounce of gold produced ($ per ounce) | $ 894 | $ 1,242 | ||
| Total cash costs per ounce of gold produced ($ per ounce) | $ 930 | $ 1,214 |
In the third quarter of 2022, gold production increased when compared to the prior-year period primarily due to higher throughput resulting from solid operational performance and higher gold grades resulting from a higher than anticipated grade sequence in the Whale Tail and IVR open pits.
Production costs per tonne in the third quarter of 2022 decreased when compared to the prior-year period primarily due to the build-up of the stockpile resulting in a favourable stockpile adjustment and the timing of unsold inventory, partially offset by higher services costs related to inflationary pressures on transportation and a lower deferred stripping adjustment. Production costs per ounce in the third quarter of 2022 decreased when compared to the prior-year period due to higher gold grades and mill throughput levels and the timing of unsold inventory.
Minesite costs per tonne in the third quarter of 2022 were the same when compared to the prior-year period primarily due to inventory adjustments resulting from the build-up of the stockpile and higher throughput levels, partially offset by higher site services costs related to inflationary pressures on transportation and a lower deferred stripping adjustment. Total cash costs per ounce in the third quarter of 2022 decreased when compared to the prior-year period primarily due to higher gold grades and higher mill throughput.
| Meadowbank Complex – Operating Statistics | ||||
| Nine Months Ended | Nine Months Ended | |||
| September 30, 2022 | September 30, 2021 | |||
| Tonnes of ore milled (thousands of tonnes) | 2,816 | 2,774 | ||
| Tonnes of ore milled per day | 10,315 | 10,168 | ||
| Gold grade (g/t) | 3.37 | 3.12 | ||
| Gold production (ounces) | 279,457 | 255,222 | ||
| Production costs per tonne (C$) | $ 141 | $ 134 | ||
| Minesite costs per tonne (C$) | $ 147 | $ 137 | ||
| Production costs per ounce of gold produced ($ per ounce) | $ 1,124 | $ 1,156 | ||
| Total cash costs per ounce of gold produced ($ per ounce) | $ 1,140 | $ 1,139 |
In the first nine months of 2022, gold production increased when compared to the prior-year period primarily due to higher gold grades and higher tonnage resulting from a strong operating performance and higher gold grades resulting from a higher than anticipated grade sequence in the Whale Tail and IVR open pits.
Production costs per tonne in the first nine months of 2022 increased when compared to the prior-year period primarily due to higher site services costs related to inflationary pressures on transportation and the COVID-19 pandemic, partially offset by inventory adjustments resulting from the build-up of stockpile. Production costs per ounce in the first nine months of 2022 decreased when compared to the prior-year period due to higher gold grades and higher mill throughput, partially offset by higher production costs per tonne.
Minesite costs per tonne in the first nine months of 2022 increased when compared to the prior-year period primarily due to the factors described above. Total cash costs per ounce in the first nine months of 2022 were essentially the same when compared to the prior-year period as higher gold grades and mill throughput were essentially offset by higher minesite costs per tonne.
Operational Highlights
- In the third quarter of 2022, and for the second quarter in a row, Amaruq set a new quarterly record for gold production since declaring commercial production on September 30, 2019
- The open pit operations delivered a solid performance despite challenges related to workforce and equipment parts availability. Higher gold grades than anticipated from the Whale Tail and IVR open pits largely offset a slight shortfall in ore tonnes mined
- Mill availability and throughput was slightly lower than forecast due to the extended commissioning of the high pressure grinding rolls. With the commissioning of the high pressure grinding rolls now completed, and combined with the optimization projects carried out at the mill, the Company expects to continue to maximize the mill throughput for the remainder of the year
- In the third quarter of 2022, mill recovery was slightly lower than forecast due to higher sulphur content in the ore feed
- The sealift activities for the 2022 season were successfully completed in October 2022
- The Company expects production to be lower in the fourth quarter of 2022 due the mining of a lower grade portion of the pit
Underground Project Highlights
- Commercial production at Amaruq underground was achieved in the third quarter of 2022 and, with some infrastructure projects ongoing, the project remains on budget. The first three stopes were mined in the third quarter of 2022
- The ventilation raise and surface fan installation were completed in the third quarter of 2022. Commissioning of the cemented rockfill plant is ongoing. A temporary system using mobile equipment is currently being used while the ramp-up progresses
Exploration Highlights
- At the Amaruq mine site, 9,100 metres were drilled in the third quarter of 2022 (27,600 metres year to date)
- Deep drilling in the third quarter of 2022 targeted the IVR, Whale Tail and Mammoth zones, with results demonstrating extensions with similar grades and widths within IVR and Whale Tail
- Highlights include: 9.5 g/t gold over 4.8 metres at 722 metres depth and 7.1 g/t gold over 7.2 metres at 747 metres depth in the deepest extension of the IVR Zone in hole AMQ22-2813A; and 9.1 g/t gold over 10.8 metres at 848 metres depth in the deepest extension of the Whale Tail Zone in hole AMQ22-2852
Hope Bay Project – Drilling Activities Continued in the Third Quarter of 2022; Larger Production Scenarios Continue to be Evaluated
Located in the Kitikmeot District of Nunavut, Canada, approximately 125 kilometres southwest of Cambridge Bay, the Hope Bay project was acquired in February 2021. The Company owns 100% of the 191,342-hectare property, which includes portions of the Hope Bay and Elu greenstone belts. The 80-kilometre long Hope Bay greenstone belt hosts three gold deposits (Doris, Madrid and Boston) with mineral reserves and mineral resources and over 90 regional exploration targets. At the time the Hope Bay project was acquired, construction at the Doris deposit was complete and commercial production had been achieved in the second quarter of 2017.
On February 18, 2022, the Company announced that it decided to maintain the suspension of production activities at the Doris mine in order to dedicate the infrastructure of the Hope Bay site to exploration activities. An update on exploration carried out in the third quarter of 2022 is presented in the Key Value Drivers section above.
AUSTRALIA
Agnico Eagle acquired the Fosterville mine on February 8, 2022 as a result of the Merger with Kirkland Lake Gold. As the largest gold mine in the state of Victoria, Australia. Fosterville is a 100% owned high-grade underground gold mine, located 20 kilometres from the city of Bendigo. The operation features low-cost gold production, as well as extensive in-mine and district scale exploration potential.
Fosterville – Solid Operational and Cost Performance Continues; Positive Drill Results from the Down-Plunge Extension of the Lower Phoenix/Cardinal Splay
Gold production at the Fosterville mine commenced in 1991 from shallow oxide open pits and heap-leaching operations and was suspended in 2001 subsequent to the depletion of oxide ore. In 2005, gold production restarted as an open pit, sulphide mining operation, with mining activities progressively transitioning to underground. Based on exploration success, in particular the discovery of the high grade Eagle and Swan mineralized zones, the Fosterville mine output increased rapidly year over year from 2016 to 2020. Exploration activities continue to expand its mineral reserves and mineral resources as the deposit remains open at depth in the Harrier, Lower Phoenix and Robbins Hill areas.
| Fosterville Mine – Operating Statistics* | ||||
| Three Months Ended | Nine Months Ended | |||
| September 30, 2022 | September 30, 2022 | |||
| Tonnes of ore milled (thousands of tonnes) | 172 | 3 | ||
| Tonnes of ore milled per day | 1,868 | 1,640 | ||
| Gold grade (g/t) | 15.11 | 20.46 | ||
| Gold production (ounces) | 81,801 | 249,693 | ||
| Production costs per tonne (A$) | $ 306 | $ 627 | ||
| Minesite costs per tonne (A$) | $ 305 | $ 340 | ||
| Production costs per ounce of gold produced ($ per ounce) | $ 418 | $ 683 | ||
| Total cash costs per ounce of gold produced ($ per ounce) | $ 435 | $ 365 | ||
*In the first nine months of 2022, the operating statistics are reported for the period from February 8, 2022 to September 30, 2022.
In the third quarter of 2022, gold production at the Fosterville mine was 81,801 ounces, with production costs per tonne of A$306, production costs per ounce of $418, minesite costs per tonne of A$305 and total cash costs per ounce of $435.
For the period from February 8, 2022 to September 30, 2022, gold production at the Fosterville mine was 249,693 ounces, with production costs per tonne of A$628, production costs per ounce of $683, minesite costs per tonne of A$340 and total cash costs per ounce of $365.
In the first nine months of 2022, the difference between production costs per tonne and minesite costs per tonne and the difference between production costs per ounce and total cash costs per ounce are primarily due to the inventory re-valuation at the forecasted gold price in the period the inventory was expected to be sold, which was done as part of the Purchase Price Allocation following the completion of the Merger.
Operational Highlights
- For the complete first nine months of 2022 including the period before the Merger/1, the Fosterville mine delivered solid operational performance with total gold production of 294,573 ounces, which was above forecast
- Mine production continues to be affected by primary ventilation operating restrictions related to low frequency noise constraints. In the third quarter and the first nine months of 2022, the Company has successfully adjusted the mining sequence to offset production impacts
- The Company remains focused on reducing the regenerative noise from the existing main ventilation fans’ silencers. In the third quarter of 2022, the Company completed the modification of the silencers. The Company will continue to work towards a resolution into 2023, while also evaluating the potential installation of the primary fans underground in the longer term
- In the third quarter of 2022, the Fosterville mine achieved lower total cash costs per ounce than forecast due to higher gold grades, lower consumption of inputs than anticipated and a weaker Australian dollar compared to the US dollar, partially offset by the increase in minesite costs per tonne related to the lower throughput levels
- Based on the expected timing of mining higher-grade stopes, the Fosterville mine is expected to have a strong fourth quarter of 2022
Project Highlights
- Four underground ventilation raises are planned to be excavated at Lower Phoenix and Harrier to upgrade the ventilation system and extend the service of the surface primary fans. The pilot hole for the first ventilation raise was completed in the third quarter of 2022 and back reaming commenced. Completion of the full ventilation upgrade project is expected in the first half of 2024
- In the third quarter of 2022, the seventh raise of the flotation tailings storage facility was initiated. The wall raise is expected to provide an additional 17 months of tailings storage capacity and be completed in the first half of 2023
Exploration Highlights
- Exploration drilling on the Fosterville mining lease and exploration licenses has totalled 118,085 metres year to date versus a budget of 203,400 metres for the full year
- In the third quarter of 2022, drilling produced significant results in the down-plunge extension of the Lower Phoenix-Cardinal splay with highlights of: 365.5 g/t gold over 1.1 metres with visible gold at 1,682 metres depth in hole UDH4413, approximately 100 metres down-plunge of the Lower Phoenix mineral resource; 226.2 g/t gold over 1.4 metres with visible gold at 1,716 metres depth in hole UDH4372A; and 168.6 g/t gold over 2.9 metres at 1,682 metres depth in hole UDH4415. The intercepts are 70 to 130 metres laterally south from the Lower Phoenix mineral reserves
- The intercepts for hole UDH4413 and hole UDH4372A were previously reported on August 11, 2022 as being in the Lower Phoenix zone, and are now attributed to the Cardinal Fault, which is a hanging wall splay of the Lower Phoenix mineralization
- Significant drill intercepts in the Lower Phoenix zone include 14.6 g/t gold over 10.6 metres at 1,828 metres depth in hole UDH4518 and 5.5 g/t gold over 21.9 metres at 1,777 metres depth in hole UDH4372, with the holes located approximately 150 metres down-plunge from Lower Phoenix mineral reserves
- At Robbins Hill, the decline is now complete, and infill and extension drilling are underway. In the third quarter of 2022, a new mineralized structure (Hoffman Fault) was identified in the hanging wall of the Curie Fault. Significant visible-gold intercepts for the Hoffman Fault include 58.0 g/t gold over 1.8 metres at 661 metres depth in hole UDH4446, with the intercept previously attributed to the Curie zone as reported on August 11, 2022
- Step-out drilling at Robbins Hill has identified sulphide-hosted gold mineralization approximately 2.5 kilometres down-plunge from the Curie mineral reserves with a highlight of 5.6 g/t gold over 3.8 metres at 1,323 metres depth in hole UDR020
FINLAND
Agnico Eagle’s Kittila mine in Finland is the largest primary gold producer in Europe. The expansion of the Kittila mill to 2.0 million tonnes per year was completed in the fourth quarter of 2020. An underground shaft is under construction and is expected to be commissioned in early 2023. Exploration activities continue to expand the mineral reserves and mineral resources at the Kittila mine. Near mine exploration remains the main focus as the deposit remains open at depth and laterally.
Kittila – Strong Mine Performance, Mill Throughput Affected by Autoclave Availability; Shaft Sinking Completed with Commissioning Expected to Start in the Fourth Quarter of 2022
The 100% owned Kittila mine in northern Finland achieved commercial production in 2009.
| Kittila Mine – Operating Statistics | ||||
| Three Months Ended | Three Months Ended | |||
| September 30, 2022 | September 30, 2021 | |||
| Tonnes of ore milled (thousands of tonnes) | 487 | 549 | ||
| Tonnes of ore milled per day | 5,293 | 5,967 | ||
| Gold grade (g/t) | 4.56 | 4.03 | ||
| Gold production (ounces) | 61,901 | 62,089 | ||
| Production costs per tonne (EUR) | € 104 | € 79 | ||
| Minesite costs per tonne (EUR) | € 100 | € 79 | ||
| Production costs per ounce of gold produced ($ per ounce) | $ 834 | $ 824 | ||
| Total cash costs per ounce of gold produced ($ per ounce) | $ 843 | $ 826 |
Gold production in the third quarter of 2022 was essentially unchanged when compared to the prior-year period as lower mill throughput was offset by higher gold grades as expected by the mining sequence. In the third quarter of 2022, the mill throughput was affected by higher than normal sulphur content in the ore, a temporary failure of the mill feed conveyor and scale build-up in the autoclave.
Production costs per tonne in the third quarter of 2022 increased when compared to the prior-year period primarily due to higher mine and mill production costs resulting from higher unit costs for fuel, power, ground support and reagents, lower throughput levels and the timing of unsold inventory, partially offset by inventory adjustments resulting from the build-up of the stockpile. Production costs per ounce in the third quarter of 2022 increased when compared to the prior-year period due to higher production costs per tonne, partially offset by the weakening of the Euro against the U.S. dollar and higher gold grades.
Minesite costs per tonne in the third quarter of 2022 increased when compared to the prior-year period primarily due to higher mine and mill production costs resulting from higher unit costs for fuel, power, ground support and reagents, and lower throughput levels, partially offset by inventory adjustments resulting from the build-up of the stockpile. Total cash costs per ounce in the third quarter of 2022 increased when compared to the prior-year period due to higher minesite costs per tonne, partially offset by the weakening of the Euro against the U.S. dollar and higher gold grades.
| Kittila Mine – Operating Statistics | ||||
| Nine Months Ended | Nine Months Ended | |||
| September 30, 2022 | September 30, 2021 | |||
| Tonnes of ore milled (thousands of tonnes) | 1,504 | 1,526 | ||
| Tonnes of ore milled per day | 5,509 | 5,590 | ||
| Gold grade (g/t) | 4.19 | 4.12 | ||
| Gold production (ounces) | 172,223 | 176,068 | ||
| Production costs per tonne (EUR) | € 96 | € 81 | ||
| Minesite costs per tonne (EUR) | € 92 | € 81 | ||
| Production costs per ounce of gold produced ($ per ounce) | $ 896 | $ 839 | ||
| Total cash costs per ounce of gold produced ($ per ounce) | $ 889 | $ 843 |
Gold production in the first nine months of 2022 decreased when compared to the prior-year period primarily due to lower metallurgical recoveries, resulting from high sulphur content in the feed and scale build-up in the autoclave, and lower throughput levels, partially offset by higher gold grades as per the mining sequence.
Production costs per tonne in the first nine months of 2022 increased when compared to the prior-year period primarily due to higher mine and mill production costs resulting from higher unit costs for fuel, power, ground support and reagents, lower throughput levels and the timing of unsold inventory, partially offset by inventory adjustments resulting from the build-up of the stockpile. Production costs per ounce in the first nine months of 2022 increased when compared to the prior-year period due to higher production costs per tonne and the timing of unsold inventory, partially offset by the weakening of the Euro against the U.S. dollar and higher gold grades.
Minesite costs per tonne in the first nine months of 2022 increased when compared to the prior-year period primarily due to higher mine and mill production costs resulting from higher unit costs for fuel, power, ground support and reagents, and lower throughput levels, partially offset by inventory adjustments resulting from the build-up of the stockpile. Total cash costs per ounce in the first nine months of 2022 increased when compared to the prior-year period due to higher production costs per tonne, partially offset by the weakening of the Euro against the U.S. dollar.
Operational Highlights
- In the third quarter of 2022, the Kittila underground mine continued to deliver strong operational performance with the optimization of the mining sequence resulting in higher gold grades and improved operational efficiencies contributing to exceeding the underground production
- In the third quarter of 2022, mill throughput and metallurgical recovery were affected by lower availability of the autoclave early in the quarter and higher sulphur content in the autoclave feed. A planned five-day mill shut down to reduce scale build-up in the autoclave was completed in the quarter to address the issue
- The upgrade of the network to 5G is progressing as planned. In the third quarter of 2022, the physical build of the network was completed, with testing of the mobile fleet connectivity and commissioning expected to be completed in the fourth quarter of 2022. The Kittila mine is expected to be the first underground mine in the world equipped with a 5G network. As part of this initiative, the Company continues to evaluate future automation opportunities while collaborating with equipment manufacturers
- In the fourth quarter of 2022, there will be a planned eleven-day shutdown at the Kittila mill for regular yearly maintenance on the process plant
Permitting
- In 2020, the Regional State Administrative Agency of Northern Finland granted Agnico Eagle Finland Oy (“Agnico Finland”) environmental and water permits that would allow Agnico Finland to enlarge the CIL2 tailings storage facility, expand the operations of the Kittila mine to 2.0 Mtpa and build a new discharge waterline. The permits were subsequently appealed to the Vaasa Administrative Court in Finland. The appeals were granted, in part, in July 2022 with the result that the permits were returned for reconsideration by the Regional State Administrative Agency of Northern Finland
- In August 2022, the Company appealed the decisions of the Vaasa Administrative Court to the Supreme Administrative Court of Finland (“SAC”) and requested that the SAC restore the permits through an interim decision pending the ultimate result of Agnico Finland’s appeal
- Applicable Finnish authorities have submitted statements to the SAC that the Company believes to be favourable to the Company. Agnico Finland has also received positive support from local stakeholders
- The Company expects a final decision from the SAC by late 2023
Project Highlights
- In the third quarter of 2022, shaft sinking was completed and the Galloway was decommissioned. In the fourth quarter of 2022, the shaft sinking team is expected to be demobilized and the focus will shift to the installation of the production and service hoists and the completion of the S1000 level. The commissioning of the production hoist is expected to be completed in the first quarter of 2023
- In the third quarter of 2022, the construction of a nitrogen removal plant was completed and the carrier material and bacteria were introduced in the reactors. The Company is now focused on ramping-up and stabilizing the process. Commissioning is expected to be completed by the end of the fourth quarter of 2022
Exploration Highlights
- Exploration drilling at Kittila totals 50,244 metres year to date of a planned 69,600 metres in 2022 and continues to prioritize targets located near existing infrastructure
- In the third quarter of 2022, positive results were obtained from the Roura vertical extension near the shaft that is under development, with highlights of: hole ROU22-608 intersecting 13.2 g/t gold over 10.2 metres at 1,106 metres depth in the Sisar zone, and located beyond current mineral resources; and hole RUG22-503 intersecting 9.3 g/t gold over 10.3 metres at 1,087 metres depth, partly inside the mineral reserves in the Main Zone, and 7.9 g/t gold over 6.9 metres at 1,107 metres depth, beyond current mineral resources in the Sisar Zone
MEXICO
Agnico Eagle’s Mexican operations have been a solid source of precious metals production (gold and silver) with solid free cash flow generation since 2009.
Pinos Altos – Backlog in Development Continued to Affect Stope Availability and Gold Production; Open Pit Production from Reyna de Plata Ramping-up
The 100% owned Pinos Altos mine in northern Mexico achieved commercial production in November 2009.
| Pinos Altos Mine – Operating Statistics | ||||
| Three Months Ended | Three Months Ended | |||
| September 30, 2022 | September 30, 2021 | |||
| Tonnes of ore processed (thousands of tonnes) | 378 | 444 | ||
| Tonnes of ore processed per day | 4,109 | 4,826 | ||
| Gold grade (g/t) | 1.98 | 2.440 | ||
| Gold production (ounces) | 23,041 | 32,402 | ||
| Production costs per tonne | $ 91 | $ 84 | ||
| Minesite costs per tonne | $ 92 | $ 78 | ||
| Production costs per ounce of gold produced ($ per ounce) | $ 1,498 | $ 1,156 | ||
| Total cash costs per ounce of gold produced ($ per ounce) | $ 1,295 | $ 854 |
Gold production in the third quarter of 2022 decreased when compared to the prior-year period primarily due to lower gold grades resulting from increased sourcing from the lower grade Reyna de Plata open pit and lower throughput levels resulting from lower underground productivity related to lower stope availability at the Santo Niño and Cerro Colorado zones.
Production costs per tonne in the third quarter of 2022 increased when compared to the prior-year period primarily due to lower throughput levels, partially offset by the timing of unsold inventory. Production costs per ounce in the third quarter of 2022 increased when compared to the prior-year period due to lower gold grades and higher production costs per tonne, partially offset by the timing of unsold inventory.
Minesite costs per tonne in the third quarter of 2022 increased when compared to the prior-year period primarily due to lower throughput levels. Total cash costs per ounce in the third quarter of 2022 increased when compared to the prior-year period due to lower gold grades, higher minesite costs per tonne and lower by-product revenues from lower silver sales.
| Pinos Altos Mine – Operating Statistics | ||||
| Nine Months Ended | Nine Months Ended | |||
| September 30, 2022 | September 30, 2021 | |||
| Tonnes of ore processed (thousands of tonnes) | 1,128 | 1,458 | ||
| Tonnes of ore processed per day | 4,132 | 5,341 | ||
| Gold grade (g/t) | 2.05 | 2.1 | ||
| Gold production (ounces) | 71,231 | 94,191 | ||
| Production costs per tonne | $ 95 | $ 75 | ||
| Minesite costs per tonne | $ 93 | $ 72 | ||
| Production costs per ounce of gold produced ($ per ounce) | $ 1,501 | $ 1,155 | ||
| Total cash costs per ounce of gold produced ($ per ounce) | $ 1,247 | $ 847 |
Gold production in the first nine months of 2022 decreased when compared to the prior-year period primarily due to lower throughput levels resulting from lower underground productivity related to the higher rehabilitation requirements at the Santo Niño and Cerro Colorado zones and lower gold grades resulting from the mining sequence, partially offset by higher metallurgical recoveries.
Production costs per tonne in the first nine months of 2022 increased when compared to the prior-year period primarily due to lower throughput levels, higher mining costs resulting from higher ground support requirements and higher processing costs related to higher unit prices for reagents and grinding media, partially offset by lower open pit costs. Production costs per ounce in the first nine months of 2022 increased when compared to the prior-year period due to higher production costs per tonne and lower gold grades, partially offset by the timing of inventory sales.
Minesite costs per tonne in the first nine months of 2022 increased when compared to the prior-year period primarily due to reasons described above. Total cash costs per ounce in the first nine months of 2022 increased when compared to the prior-year period due to higher minesite costs per tonne, lower by-product revenues from lower silver sales and lower gold grades.
Operational Highlights
- The backlog in underground development at the Santo Niño and Cerro Colorado areas, resulting from the higher than anticipated rehabilitation work in the first six months of 2022, continued to affect the stope availability and ore delivery to the mill in the third quarter of 2022
- In the third quarter of 2022, the Company adjusted the mining sequence and mining rate according to the current mining conditions and established a plan to improve the mining recovery and reduce dilution. With these initiatives in place, the Company expects to see improvements in the production rate in the fourth quarter of 2022
- At Reyna de Plata, open pit pre-stripping activities at Pit 1 progressed as planned and are expected to be completed in the fourth quarter of 2022. Ore production from the lower section of Pit 2 is ramping-up, with a 26% increase quarter over quarter
- At Creston Mascota, residual recovery from the heap leach pad continued throughout the third quarter of 2022 and resulted in a production of 538 ounces of gold at production costs per ounce of $644 and total cash costs of $641 per ounce. Irrigation of the heap leach pad and residual leaching will continue throughout the fourth quarter of 2022
Project Highlights
- Pre-production activities at the Cubiro deposit continued in the third quarter of 2022 and initial production is expected in the second half of 2023. Once production commences, Cubiro is expected to provide additional production flexibility to the Pinos Altos operations
Exploration Highlights
- In the third quarter of 2022, exploration drilling at Pinos Altos confirmed the presence of a high-grade block with dimensions of 100 by 100 metres and at least 4 metres wide located 100 metres below the lowest production level, with previously reported highlight hole UG-22-283 returning 3.1 g/t gold and 122 g/t silver over 11.6 metres at 649 metres depth, including 4.1 g/t gold and 200 g/t silver over 5.8 metres at 648 metres depth. This extension of mineralization at depth is expected to result in an increase to mineral reserves in the year-end 2022 estimate
- At the Cubiro deposit under development at Pinos Altos, hole CBUG-22-179 returned 3.3 g/t gold over 9.2 metres at 153 metres depth in the western limits of the main Cubiro Corridor. This result confirms the continuity of high-grade mineralization in this portion of the deposit, which remains open laterally and up-dip, and is expected to result in an increase to mineral reserves and mineral resources in the year-end 2022 estimate
La India – Operational Performance Affected by Heavy Rains; Ore Production Transitioned to the La India and El Realito Pits as the Main Zone Pit Depleted
The 100% owned La India mine in Sonora, Mexico, located approximately 70 kilometres northwest of the Company’s Pinos Altos mine, achieved commercial production in February 2014.
| La India Mine – Operating Statistics | ||||
| Three Months Ended | Three Months Ended | |||
| September 30, 2022 | September 30, 2021 | |||
| Tonnes of ore processed (thousands of tonnes) | 1,045 | 1,233 | ||
| Tonnes of ore processed per day | 11,359 | 13,402 | ||
| Gold grade (g/t) | 0.72 | 0.62 | ||
| Gold production (ounces) | 16,285 | 17,124 | ||
| Production costs per tonne | $ 19 | $ 13 | ||
| Minesite costs per tonne | $ 19 | $ 13 | ||
| Production costs per ounce of gold produced ($ per ounce) | $ 1,246 | $ 931 | ||
| Total cash costs per ounce of gold produced ($ per ounce) | $ 1,196 | $ 971 |
Gold production in the third quarter of 2022 was essentially unchanged when compared to the prior-year period as the fewer ore tonnes placed on the heap leach were essentially offset by higher gold grades as the mining transitioned from the Main Zone pit to the El Realito and La India pits. In the third quarter of 2022, mine production and ore tonnes placed on the heap leach were affected by heavy rains that resulted in lower mine productivity.
Production costs per tonne in the third quarter of 2022 increased when compared to the prior-year period primarily due to higher open pit production costs resulting from lower productivity, higher heap leach production costs resulting from lower tonnes placed on the heap leach and higher cement and cyanide consumption related to the high clay content of the ore, partially offset by higher deferred costs resulting from a higher stripping ratio as the mine transitioned from the Main Zone pit to the La India and El Realito pits. Production costs per ounce in the third quarter of 2022 increased when compared to the prior-year period due to higher production costs per tonne, partially offset by higher gold grades.
Minesite costs per tonne in the third quarter of 2022 increased when compared to the prior-year period primarily due to the reasons described above. Total cash costs per ounce in the third quarter of 2022 increased when compared to the prior-year period due to higher mine site costs, partially offset by higher gold grades.
| La India Mine – Operating Statistics | ||||
| Nine Months Ended | Nine Months Ended | |||
| September 30, 2022 | September 30, 2021 | |||
| Tonnes of ore processed (thousands of tonnes) | 3,964 | 4,620 | ||
| Tonnes of ore processed per day | 14,520 | 16,923 | ||
| Gold grade (g/t) | 0.59 | 0.49 | ||
| Gold production (ounces) | 58,003 | 38,869 | ||
| Production costs per tonne | $ 14 | $ 8 | ||
| Minesite costs per tonne | $ 14 | $ 9 | ||
| Production costs per ounce of gold produced ($ per ounce) | $ 956 | $ 992 | ||
| Total cash costs per ounce of gold produced ($ per ounce) | $ 966 | $ 1,001 |
Gold production in the first nine months of 2022 increased when compared to the prior-year period primarily due to higher heap leach recovery and higher gold grades, partially offset by fewer tonnes placed on the heap leach due to heavy rains and low mine productivity in the third quarter of 2022. In the first nine months of 2022 the heap leach operated at normal levels, while in the prior-year period, irrigation of the heap leach was significantly reduced from March to June 2021 due to low local water availability, affecting heap leach recovery.
Production costs per tonne in the first nine months of 2022 increased when compared to the prior-year period primarily due to inventory adjustments and higher heap leach and open pit production costs in the third quarter of 2022. Production costs per ounce in the first nine months of 2022 decreased when compared to the prior-year period due to higher gold grades, partially offset by higher production costs per tonne.
Minesite costs per tonne in the first nine months of 2022 increased when compared to the prior-year period primarily due to reasons described above. Total cash costs per ounce in the first nine months of 2022 decreased when compared to the prior-year period due to higher gold production and higher by-product revenues from higher silver sales, partially offset by higher minesite costs per tonne.
Operational Highlights
- In the third quarter of 2022, the Main Zone pit was depleted and ore production transitioned to the La India and El Realito pits, resulting in higher gold grades and a higher stripping ratio. With an increase in mine haulage for ore and waste, mine productivity decreased and affected unit costs
- In the third quarter of 2022, the quantity of ore tonnes placed on the heap leach was below forecast due to lower mine productivity and heavy rains affecting the stacking system
Project Highlights
- Pre-stripping of the El Realito pit was completed in the third quarter of 2022
About Agnico Eagle
Agnico Eagle is a senior Canadian gold mining company, producing precious metals from operations in Canada, Australia, Finland and Mexico. It has a pipeline of high-quality exploration and development projects in these countries as well as in the United States and Colombia. Agnico Eagle is a partner of choice within the mining industry, recognized globally for its leading environmental, social and governance practices. The Company was founded in 1957 and has consistently created value for its shareholders, declaring a cash dividend every year since 1983.
Note Regarding Certain Measures of Performance
This news release discloses certain financial performance measures, including “total cash costs per ounce”, “all-in sustaining costs per ounce”, “minesite costs per tonne”, “net debt”, “adjusted net income”, “adjusted net income per share”, “sustaining capital expenditures”, “development capital expenditures” and “operating margin” that are not standardized measures under IFRS. These measures may not be comparable to similar measures reported by other gold mining companies. For a reconciliation of these measures to the most directly comparable financial information reported in the consolidated financial statements prepared in accordance with IFRS, other than adjusted net income, see “Reconciliation of Non-GAAP Financial Performance Measures” below.
The total cash costs per ounce of gold produced is reported on both a by-product basis (deducting by-product metal revenues from production costs) and co-product basis (without deducting by-product metal revenues). The total cash costs per ounce of gold produced on a by-product basis is calculated by adjusting production costs as recorded in the consolidated statements of income (loss) for by-product revenues, inventory production costs, operational care and maintenance costs due to COVID-19, realized gains and losses on hedges of production costs and other adjustments, which include smelting, refining and marketing charges and then dividing by the number of ounces of gold produced excluding production prior to the achievement of commercial production. Certain line items such as operational care and maintenance costs due to COVID-19 and realized gains and losses on hedges of production costs were previously classified as “other adjustments” and are now disclosed separately to provide additional detail on the reconciliation, allowing investors to better understand the impacts of such events on the cash operating costs per ounce and minesite costs per tonne. In addition, given the extraordinary nature of the fair value adjustment on inventory related to the Merger and the use of the total cash costs per ounce measure to reflect the cash generating capabilities of the Company’s operations, the calculation of total cash costs per ounce for the Detour, Macassa and Fosterville mines have been adjusted for this purchase price allocation. The total cash costs per ounce of gold produced on a co-product basis is calculated in the same manner as the total cash costs per ounce of gold produced on a by-product basis, except that no adjustment is made for by-product metal revenues. Accordingly, the calculation of total cash costs per ounce of gold produced on a co-product basis does not reflect a reduction in production costs or smelting, refining and marketing charges associated with the production and sale of by-product metals. The total cash costs per ounce of gold produced is intended to provide information about the cash-generating capabilities of the Company’s mining operations. Management also uses this measure to, and believes it is helpful to investors so they can, understand and monitor the performance of the Company’s mining operations. The Company believes that total cash costs per ounce is useful to help investors understand the costs associated with producing gold and the economics of gold mining. As market prices for gold are quoted on a per ounce basis, using the total cash costs per ounce of gold produced on a by-product basis measure allows management and investors to assess a mine’s cash-generating capabilities at various gold prices. Management is aware, and investors should note, that these per ounce measures of performance can be affected by fluctuations in exchange rates and, in the case of total cash costs per ounce of gold produced on a by-product basis, by-product metal prices. Management compensates for these inherent limitations by using, and investors should also consider, these measures in conjunction with minesite costs per tonne as well as other data prepared in accordance with IFRS. Management also performs sensitivity analysis in order to quantify the effects of fluctuating metal prices and exchange rates. Investors should note that total cash costs per ounce are not reflective of all cash expenditures as they do not include income tax payments, interest costs or dividend payments. This measure also does not include depreciation or amortization.
Agnico Eagle’s primary business is gold production and the focus of its current operations and future development is on maximizing returns from gold production, with other metal production being incidental to the gold production process. Accordingly, all metals other than gold are considered by-products.
Total cash costs per ounce of gold produced is reported on a by-product basis because (i) the majority of the Company’s revenues are from gold, (ii) the Company mines ore, which contains gold, silver, zinc, copper and other metals, (iii) it is not possible to specifically assign all costs to revenues from the gold, silver, zinc, copper and other metals the Company produces, (iv) it is a method used by management and the Board of Directors to monitor operations, and (v) many other gold producers disclose similar measures on a by-product rather than a co-product basis. Investors should also consider these measures in conjunction with other data prepared in accordance with IFRS.
All-in sustaining costs per ounce of gold produced on a by-product basis is calculated as the aggregate of total cash costs on a by-product basis, sustaining capital expenditures (including capitalized exploration), general and administrative expenses (including stock options), lease payments related to sustaining assets and reclamation expenses, and then dividing by the number of ounces of gold produced (excluding production prior to the achievement of commercial production). These additional costs reflect the additional expenditures that are required to be made to maintain current production levels. The AISC per ounce of gold produced on a co-product basis is calculated in the same manner as the AISC per ounce of gold produced on a by-product basis, except that the total cash costs on a co-product basis are used, meaning no adjustment is made for by-product metal revenues. AISC per ounce seeks to reflect total sustaining expenditures of producing and selling an ounce of gold while maintaining current operations. Management is aware, and investors should note, that these per ounce measures of performance can be affected by fluctuations in foreign exchange rates and, in the case of total cash costs per ounce and AISC of gold produced on a by-product basis, by-product metal prices. Management compensates for these inherent limitations by using these measures in conjunction with minesite costs per tonne as well as other data prepared in accordance with IFRS. Investors should note that AISC per ounce is not reflective of all cash expenditures as it does not include income tax payments, interest costs or dividend payments. This measure also does not include depreciation or amortization.
The World Gold Council (“WGC”) is a non-regulatory market development organization for the gold industry. Although the WGC is not a mining industry regulatory organization, it has worked closely with its member companies to develop relevant non-GAAP measures. The Company follows the guidance on all-in sustaining costs released by the WGC in November 2018. Adoption of the AISC metric is voluntary and, notwithstanding the Company’s adoption of the WGC’s guidance, AISC per ounce of gold produced reported by the Company may not be comparable to data reported by other gold mining companies. The Company believes that this measure provides helpful information about operating performance. However, this non-GAAP measure should be considered together with other data prepared in accordance with IFRS as it is not necessarily indicative of operating costs or cash flow measures prepared in accordance with IFRS.
Minesite costs per tonne are calculated by adjusting production costs as recorded in the consolidated statements of income (loss) for inventory production costs, operational care and maintenance costs due to COVID-19, and other adjustments, and then dividing by tonnage of ore processed (excluding the tonnage processed prior to the achievement of commercial production). As the total cash costs per ounce of gold produced can be affected by fluctuations in by‑product metal prices and foreign exchange rates, management believes, and investors should note, that minesite costs per tonne is useful to investors in providing additional information regarding the performance of mining operations, eliminating the impact of varying production levels. Management also uses this measure to determine the economic viability of mining blocks. As each mining block is evaluated based on the net realizable value of each tonne mined, in order to be economically viable the estimated revenue on a per tonne basis must be in excess of the minesite costs per tonne. Management is aware, and investors should note, that this per tonne measure of performance can be affected by fluctuations in processing levels. This inherent limitation may be partially mitigated by using this measure in conjunction with production costs prepared in accordance with IFRS.
Net debt is calculated by adjusting the total of the current portion of long-term debt and non-current long-term debt as recorded on the consolidated balance sheet for deferred financing costs and cash and cash equivalents. Management believes the measure of net debt is useful to help investors to determine the Company’s overall debt position and to evaluate future debt capacity of the Company.
Adjusted net income and adjusted net income per share are calculated by adjusting the net income as recorded in the consolidated statements of income (loss) for the effects of certain items that the Company believes are not reflective of the Company’s underlying performance for the reporting period, including foreign currency translation gains or losses, realized and unrealized gains or losses on derivative financial instruments, impairment loss charges and reversals, environmental remediation, income and mining taxes adjustments as well as other non-recurring, unusual items (which includes changes in estimates of asset retirement obligations at closed sites and gains and losses on the disposal of assets). Adjusted net income per share is calculated by dividing adjusted net income by the number of shares outstanding on a basic and diluted basis. The Company believes that these generally accepted industry measures allow for the evaluation of the results of continuing operations and are useful in making comparisons between periods. Adjusted net income and adjusted net income per share are intended to provide investors with information about the Company’s continuing income generating capabilities. Management uses these measures to, and believes it is helpful to investors so they can, understand and monitor for the operating performance of the Company in conjunction with other data prepared in accordance with IFRS.
Operating margin is calculated by deducting production costs from revenue from mining operations. In order to reconcile operating margin to net income as recorded in the consolidated financial statements, the Company adds the following items to the operating margin: income and mining taxes expense; other expenses (income); foreign currency translation (gain) loss; gain (loss) on derivative financial instruments; finance costs; general and administrative expenses; amortization of property, plant and mine development; exploration and corporate development expenses; and impairment losses (reversals). The Company believes that operating margin is a useful measure that represents the operating performance of its individual mines associated with the ongoing production and sale of gold and by-product metals without allocating Company-wide overhead, including exploration and corporate development expenses, amortization of property, plant and mine development, general and administrative expenses, finance costs, gain and losses on derivative financial instruments, environmental remediation costs, foreign currency translation gains and losses, other expenses and income and mining tax expenses. Management uses this measure internally to plan and forecast future operating results. This measure is intended to provide investors with additional information about the Company’s underlying operating results and should be evaluated in conjunction with other data prepared in accordance with IFRS.
Sustaining capital expenditures are expenditures incurred during the production phase to sustain and maintain the existing assets so they can achieve constant expected levels of production from which the Company will derive economic benefits. Sustaining capital expenditures include expenditure for assets to retain their existing productive capacity as well as to enhance performance and reliability of the operations. Development capital expenditures represents the spending at new projects and/or expenditure at existing operations that is undertaken with the intention to increase production levels or mine life above the current plans. Management uses these measures in the capital allocation process and to assess the effectiveness of its investments. Management believes these measures are useful so investors can assess the purpose and effectiveness of the capital expenditures in each reporting period. The classification between sustaining and development capital expenditures does not have a standardized definition in accordance with IFRS and other companies may classify expenditures in a different manner.
This news release also contains information as to estimated future total cash costs per ounce, AISC per ounce and minesite costs per tonne. The estimates are based upon the total cash costs per ounce, AISC per ounce and minesite costs per tonne that the Company expects to incur to mine gold at its mines and projects and, consistent with the reconciliation of these actual costs referred to above, do not include production costs attributable to accretion expense and other asset retirement costs, which will vary over time as each project is developed and mined. It is therefore not practicable to reconcile these forward-looking non-GAAP financial measures to the most comparable IFRS measure.
Forward-Looking Statements
The information in this news release has been prepared as at October 26, 2022. Certain statements contained in this news release constitute “forward-looking statements” within the meaning of the United States Private Securities Litigation Reform Act of 1995 and “forward-looking information” under the provisions of Canadian provincial securities laws and are referred to herein as “forward-looking statements”. All statements, other than statements of historical fact, that address circumstances, events, activities or developments that could, or may or will occur are forward looking statements. When used in this news release, the words “anticipate”, “could”, “estimate”, “expect”, “forecast”, “future”, “plan”, “possible”, “potential”, “will” and similar expressions are intended to identify forward-looking statements. Such statements include, without limitation: statements regarding the impact of the COVID-19 pandemic and measures taken to reduce the spread of COVID-19 on the Company’s future operations, including its employees and overall business; the Company’s forward-looking guidance, including metal production, estimated ore grades, recovery rates, project timelines, drilling results, life of mine estimates, total cash costs per ounce, AISC per ounce, minesite costs per tonne, other expenses and cash flows; statements relating to the expected outcomes of the Merger including synergies arising therefrom and their expected quantum and timing; the estimated timing and conclusions of technical studies and evaluations; the methods by which ore will be extracted or processed; statements concerning the Company’s expansion plans at Detour, Kittila, Meliadine Phase 2, the Amaruq underground project and the Odyssey project, including the timing, funding, completion and commissioning thereof and production therefrom; statements about the Company’s plans at the Hope Bay project; statements concerning other expansion projects, recovery rates, mill throughput, optimization and projected exploration, including costs and other estimates upon which such projections are based; statements regarding timing and amounts of capital expenditures, other expenditures and other cash needs, and expectations as to the funding thereof; estimates of future mineral reserves, mineral resources, mineral production and sales; the projected development of certain ore deposits, including estimates of exploration, development and production and other capital costs and estimates of the timing of such exploration, development and production or decisions with respect to such exploration, development and production; statements regarding anticipated cost inflation and its effect on the Company’s costs; estimates of mineral reserves and mineral resources and the effect of drill results on future mineral reserves and mineral resources; statements regarding the Company’s ability to obtain the necessary permits and authorizations in connection with its proposed or current exploration, development and mining operations and the anticipated timing thereof; statements regarding operations at and expansion of the Kitilla mine following the decision of the Vaasa Administrative Court; statements regarding future exploration; the anticipated timing of events with respect to the Company’s mine sites; statements regarding the sufficiency of the Company’s cash resources; statements regarding the Company’s plans with respect to hedging; statements regarding future activity with respect to the Company’s unsecured revolving bank credit facility; statements regarding future dividend amounts and payment dates; and statements regarding anticipated trends with respect to the Company’s operations, exploration and the funding thereof. Such statements reflect the Company’s views as at the date of this news release and are subject to certain risks, uncertainties and assumptions, and undue reliance should not be placed on such statements. Forward-looking statements are necessarily based upon a number of factors and assumptions that, while considered reasonable by Agnico Eagle as of the date of such statements, are inherently subject to significant business, economic and competitive uncertainties and contingencies. The material factors and assumptions used in the preparation of the forward looking statements contained herein, which may prove to be incorrect, include, but are not limited to, the assumptions set forth herein and in management’s discussion and analysis (“MD&A”) and the Company’s Annual Information Form (“AIF”) for the year ended December 31, 2021 filed with Canadian securities regulators and that are included in its Annual Report on Form 40-F for the year ended December 31, 2021 (“Form 40-F”) filed with the U.S. Securities and Exchange Commission (the “SEC”) as well as: that governments, the Company or others do not take additional measures in response to the COVID-19 pandemic or otherwise that, individually or in the aggregate, materially affect the Company’s ability to operate its business; that cautionary measures taken in connection with the COVID-19 pandemic do not affect productivity; that measures taken relating to, or other effects of, the COVID-19 pandemic do not affect the Company’s ability to obtain necessary supplies and deliver them to its mine sites; that there are no significant disruptions affecting operations; that production, permitting, development, expansion and the ramp-up of operations at each of Agnico Eagle’s properties proceeds on a basis consistent with current expectations and plans; that the environmental and water permits granted for the Kittila mine are restored by the SAC and the decisions of the Vaasa Administrative Court have no material impact on the Kittila mine’s operations; that the relevant metal prices, foreign exchange rates and prices for key mining and construction supplies (including labour) will be consistent with Agnico Eagle’s expectations; the ability to realize the anticipated benefits of the Merger or implementing the business plan for the combined company, including as a result of difficulty in integrating the businesses of the companies involved; the ability to realize synergies and cost savings at the times, and to the extent, anticipated; that Agnico Eagle’s current estimates of mineral reserves, mineral resources, mineral grades and metal recovery are accurate; that there are no material delays in the timing for completion of ongoing growth projects; that seismic activity at the Company’s operations at LaRonde, Goldex and other properties is as expected by the Company; that the Company’s current plans to optimize production are successful; and that there are no material variations in the current tax and regulatory environment. Many factors, known and unknown, could cause the actual results to be materially different from those expressed or implied by such forward looking statements. Such risks include, but are not limited to: the extent and manner to which COVID-19, and measures taken by governments, the Company or others to attempt to reduce the spread of COVID-19 may affect the Company, whether directly or through effects on employee health, workforce productivity and availability (including the ability to transport personnel to fly-in/fly-out camps), travel restrictions, contractor availability, supply availability, ability to sell or deliver gold dore bars or concentrate, availability of insurance and the cost thereof, the ability to procure inputs required for the Company’s operations and projects or other aspects of the Company’s business; uncertainties with respect to the effect on the global economy associated with the COVID-19 pandemic and measures taken to reduce the spread of COVID-19, any of which could negatively affect financial markets, including the trading price of the Company’s shares and the price of gold, and could adversely affect the Company’s ability to raise capital; the ability to realize the anticipated benefits of the Merger or implementing the business plan for Agnico Eagle following the Merger, including as a result of a delay or difficulty in integrating the businesses of the companies involved; the volatility of prices of gold and other metals; uncertainty of mineral reserves, mineral resources, mineral grades and mineral recovery estimates; uncertainty of future production, project development, capital expenditures and other costs; foreign exchange rate fluctuations; inflationary pressures; financing of additional capital requirements; cost of exploration and development programs; seismic activity at the Company’s operations, including the LaRonde complex and Goldex mine; mining risks; community protests, including by First Nations groups; risks associated with foreign operations; governmental and environmental regulation; the volatility of the Company’s stock price; and risks associated with the Company’s currency, fuel and by-product metal derivative strategies. For a more detailed discussion of such risks and other factors that may affect the Company’s ability to achieve the expectations set forth in the forward-looking statements contained in this news release, see the AIF and MD&A filed on SEDAR at www.sedar.com and included in the Form 40-F filed on EDGAR at www.sec.gov, as well as the Company’s other filings with the Canadian securities regulators and the SEC. Other than as required by law, the Company does not intend, and does not assume any obligation, to update these forward-looking statements.
Notes to Investors Regarding the Use of Mineral Resources
The mineral reserve and mineral resource estimates contained in this news release have been prepared in accordance with the Canadian securities administrators’ (the “CSA”) National Instrument 43-101 – Standards of Disclosure for Mineral Projects (“NI 43-101”).
For United States reporting purposes, the SEC adopted amendments to its disclosure rules (the “SEC Modernization Rules”) to modernize the mining property disclosure requirements for issuers whose securities are registered with the SEC under the United States Securities Exchange Act of 1934, as amended (the “Exchange Act”), which became effective February 25, 2019. The SEC Modernization Rules more closely align the SEC’s disclosure requirements and policies for mining properties with current industry and global regulatory practices and standards, including NI 43-101, and replace the historical property disclosure requirements for mining registrants that were included in SEC Industry Guide 7. Issuers were required to comply with the SEC Modernization Rules in their first fiscal year beginning on or after January 1, 2021, though Canadian issuers that report in the United States using the Multijurisdictional Disclosure System (“MJDS”) may still use NI 43-101 rather than the SEC Modernization Rules when using the SEC’s MJDS registration statement and annual report forms. Accordingly, mineral reserve and mineral resource information contained in this news release may not be comparable to similar information disclosed by United States companies.
As a result of the adoption of the SEC Modernization Rules, the SEC now recognizes estimates of “measured mineral resources”, “indicated mineral resources” and “inferred mineral resources.” In addition, the SEC has amended definitions of “proven mineral reserves” and “probable mineral reserves” in the SEC Modernization Rules, with definitions that are substantially similar to those used in NI 43-101.
Investors are cautioned that while the SEC now recognizes “measured mineral resources”, “indicated mineral resources” and “inferred mineral resources”, investors should not assume that any part or all of the mineral deposits in these categories will ever be converted into a higher category of mineral resources or into mineral reserves. These terms have a great amount of uncertainty as to their economic and legal feasibility. Under Canadian regulations, estimates of inferred mineral resources may not form the basis of feasibility or pre-feasibility studies, except in limited circumstances. Investors are cautioned not to assume that any “measured mineral resources”, “indicated mineral resources”, or “inferred mineral resources” that the Company reports in this news release are or will be economically or legally mineable.
Further, “inferred mineral resources” have a great amount of uncertainty as to their existence and as to their economic and legal feasibility. It cannot be assumed that any part or all of an inferred mineral resource will ever be upgraded to a higher category.
The mineral reserve and mineral resource data set out in this news release are estimates, and no assurance can be given that the anticipated tonnages and grades will be achieved or that the indicated level of recovery will be realized. The Company does not include equivalent gold ounces for by-product metals contained in mineral reserves in its calculation of contained ounces and mineral reserves are not reported as a subset of mineral resources.
Scientific and Technical Information
The scientific and technical information contained in this news release relating to Quebec operations has been approved by Daniel Paré, P.Eng., Vice-President, Quebec; relating to Nunavut and Finland operations has been approved by Dominique Girard, Eng., Executive Vice President & Chief Operating Officer – Nunavut, Quebec & Europe; relating to Ontario, Australia and Mexico operations has been approved by Natasha Vaz, Executive Vice President & Chief Operating Officer – Ontario, Australia & Mexico; relating to exploration, mineral reserves and mineral resources have been approved by Guy Gosselin, Eng. and P.Geo., Executive Vice President, Exploration and Eric Kallio, P.Geo, Executive Vice President, Exploration Strategy & Growth, each of whom is a “Qualified Person” for the purposes of NI 43-101.
Assumptions used for the December 31, 2021 mineral reserves estimate at all mines and advanced projects held by Agnico Eagle on December 31, 2021
| Metal prices | Exchange rates | ||||||
| Gold (US$/oz) | Silver (US$/oz) | Copper (US$/lb) | Zinc(US$/lb) | C$ per US$1.00 | Mexican Peso per US$1.00 | US$ per €1.00 | |
| Operations and projects | $1,250 | $18 | $3.00 | $1.00 | $1.30 | MXP18.00 | EUR1.15 |
| Hammond Reef | $1,350 | Not applicable | Not applicable | Not applicable | $1.30 | Not applicable | Not applicable |
| Upper Beaver | $1,200 | Not applicable | $2.75 | Not applicable | $1.25 | Not applicable | Not applicable |
NI 43-101 requires mining companies to disclose mineral reserves and mineral resources using the subcategories of “proven mineral reserves”, “probable mineral reserves”, “measured mineral resources”, “indicated mineral resources” and “inferred mineral resources”. Mineral resources that are not mineral reserves do not have demonstrated economic viability.
Assumptions used for the December 31, 2021 mineral reserves estimate at all mines and advanced projects held by Kirkland Lake Gold on December 31, 2021
| Gold(US$/oz) | C$ perUS$1.00 | AUS$ per US$1.00 | |
| Mineral Reserves | $1,300 | $1.31 | $1.36 |
The above metal price assumptions are below the three-year historic gold price average (from January 1, 2019 to December 31, 2021) of approximately $1,654 per ounce.
Assumptions used for the March 31, 2022 mineral reserves estimate at the Detour Lake mine
| Gold(US$/oz) | C$ perUS$1.00 | |
| Mineral Reserves | $1,300 | $1.30 |
The above metal price assumptions are below the three-year historic gold price average (from January 1, 2019 to December 31, 2021) of approximately $1,654 per ounce.
A mineral reserve is the economically mineable part of a measured and/or indicated mineral resource. It includes diluting materials and allowances for losses, which may occur when the material is mined or extracted and is defined by studies at pre-feasibility or feasibility level as appropriate that include application of modifying factors. Such studies demonstrate that, at the time of reporting, extraction could reasonably be justified. The mineral reserves presented in this news release are separate from and not a portion of the mineral resources.
Modifying factors are considerations used to convert mineral resources to mineral reserves. These include, but are not restricted to, mining, processing, metallurgical, infrastructure, economic, marketing, legal, environmental, social and governmental factors.
A proven mineral reserve is the economically mineable part of a measured mineral resource. A proven mineral reserve implies a high degree of confidence in the modifying factors. A probable mineral reserve is the economically mineable part of an indicated and, in some circumstances, a measured mineral resource. The confidence in the modifying factors applying to a probable mineral reserve is lower than that applying to a proven mineral reserve.
A mineral resource is a concentration or occurrence of solid material of economic interest in or on the Earth’s crust in such form, grade or quality and quantity that there are reasonable prospects for eventual economic extraction. The location, quantity, grade or quality, continuity and other geological characteristics of a mineral resource are known, estimated or interpreted from specific geological evidence and knowledge, including sampling.
A measured mineral resource is that part of a mineral resource for which quantity, grade or quality, densities, shape and physical characteristics are estimated with confidence sufficient to allow the application of modifying factors to support detailed mine planning and final evaluation of the economic viability of the deposit. Geological evidence is derived from detailed and reliable exploration, sampling and testing and is sufficient to confirm geological and grade or quality continuity between points of observation. An indicated mineral resource is that part of a mineral resource for which quantity, grade or quality, densities, shape and physical characteristics are estimated with sufficient confidence to allow the application of modifying factors in sufficient detail to support mine planning and evaluation of the economic viability of the deposit. Geological evidence is derived from adequately detailed and reliable exploration, sampling and testing and is sufficient to assume geological and grade or quality continuity between points of observation. An inferred mineral resource is that part of a mineral resource for which quantity and grade or quality are estimated on the basis of limited geological evidence and sampling. Geological evidence is sufficient to imply but not verify geological and grade or quality continuity.
Investors are cautioned not to assume that part or all of an inferred mineral resource exists, or is economically or legally mineable.
A feasibility study is a comprehensive technical and economic study of the selected development option for a mineral project that includes appropriately detailed assessments of applicable modifying factors, together with any other relevant operational factors and detailed financial analysis that are necessary to demonstrate, at the time of reporting, that extraction is reasonably justified (economically mineable). The results of the study may reasonably serve as the basis for a final decision by a proponent or financial institution to proceed with, or finance, the development of the project. The confidence level of the study will be higher than that of a pre-feasibility study.
Additional Information
Additional information about each of the Company’s material mineral projects as at June 30, 2022, including information regarding data verification, key assumptions, parameters and methods used to estimate mineral reserves and mineral resources and the risks that could materially affect the development of the mineral reserves and mineral resources required by sections 3.2 and 3.3 and paragraphs 3.4(a), (c) and (d) of NI 43-101 can be found in the Company’s AIF and MD&A filed on SEDAR each of which forms a part of the Company’s Form 40-F filed with the SEC on EDGAR and in the following technical reports filed on SEDAR in respect of the Company’s material mineral properties: 2005 LaRonde Mineral Resource & Mineral Reserve Estimate Agnico-Eagle Mines Ltd. LaRonde Division (March 23, 2005); NI 43-101 Technical Report Canadian Malartic Mine, Québec, Canada (March 25, 2021); Technical Report on the Mineral Resources and Mineral Reserves at Meadowbank Gold Complex including the Amaruq Satellite Mine Development, Nunavut, Canada as at December 31, 2017 (February 14, 2018); the Updated Technical Report on the Meliadine Gold Project, Nunavut, Canada (February 11, 2015); the Detour Lake Operation Ontario, Canada NI 43-101 Technical report as at July 26, 2021 (October 15, 2021); and the Updated NI 43-101 Technical Report Fosterville Gold Mine in the State of Victoria, Australia as at December 31, 2018 (April 1, 2019).


