DENVER–(BUSINESS WIRE)–Newmont Corporation (NYSE: NEM, TSX: NGT, ASX: NEM, PNGX: NEM) (Newmont or the Company) today announced first quarter 2024 results and declared a first quarter dividend of $0.25 per share.
“Newmont delivered a strong first quarter operational performance, producing 2.2 million gold equivalent ounces and generating over $1.4 billion in cash from operations before working capital changes,” said Tom Palmer, Newmont’s President and Chief Executive Officer. “Underpinned by the gold industry’s leading portfolio of Tier 1 gold and copper operations, we remain well-positioned to achieve our full-year guidance and deliver meaningful synergies and productivity improvements from the combined portfolio. We remain focused on delivering on the commitments we laid out at the beginning of this year, creating an attractive value proposition for new and existing investors during this unique time in the gold industry.”
Q1 2024 Results1
- Delivered $288 million in dividends to shareholders; declared a dividend of $0.25 per share of common stock for the first quarter of 20242
- Announced sale of the Lundin Gold stream credit facility and offtake agreement (“Lundin Gold Financing Facilities”) for $330 million, further monetizing Newmont’s non-core assets while maintaining its equity interest in Lundin Gold
- Produced 1.7 million attributable gold ounces and 489 thousand gold equivalent ounces (GEOs)3 from copper, silver, lead and zinc; primarily driven by production of 1.4 million gold ounces from Newmont’s Tier 1 Portfolio4
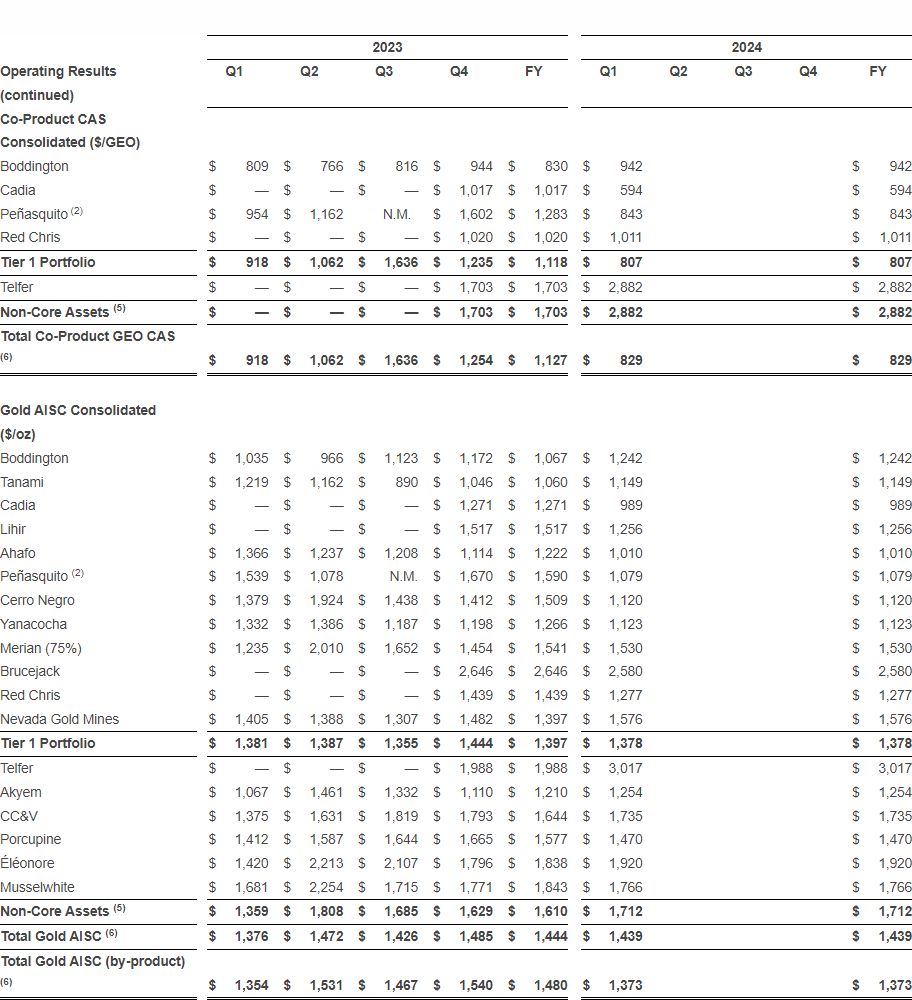
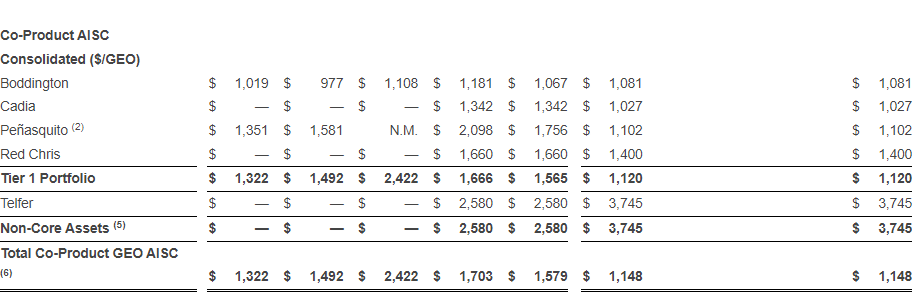
- Reported gold Costs Applicable to Sales (CAS) per ounce of $1,057 and gold All-In Sustaining Costs (AISC) per ounce of $1,439; Newmont’s Tier 1 Portfolio reported CAS of $1,000 per ounce and AISC of $1,378 per ounce5
- Generated $776 million of cash from operating activities, net of working capital changes of $(666) million; reported $(74) million in Free Cash Flownet of working capital changes and $850 million of capital reinvestment to sustain current operations and advance high-return projects; excluding the stamp duty payment in connection with the Newcrest transaction, Newmont generated Free Cash Flow of $217 million5
- Reported Net Income of $179 million, Adjusted Net Income (ANI)of $0.55 per share and Adjusted EBITDA of $1.7 billion for the quarter5
- Delivered $105 million in synergies to date from the Newcrest acquisition; on track to realize $500 million in annual synergies by the end of 20256
- Firmly on track to deliver 2024 guidance for production, costs and capital spend; full-year production expected to be second-half weighted as previously indicated7
- Classified six non-core assets and one project as held for sale, resulting in a non-cash impairment of $485 million
- Refinanced approximately $2 billion of debt acquired from the Newcrest acquisition; targeting a $1 billion debt reduction
- Published 20th Annual Sustainability Report and 3rd Annual Taxes and Royalties Contribution Report, providing a transparent review of Newmont’s ESG performance, tax strategy and economic contributions
1 Newmont’s actual condensed consolidated financial results remain subject to completion and final review by management and external auditors for the quarter ended March 31, 2024. Newmont intends to file its Q1 2024 Form 10-Q on or about the close of business on April 29, 2024. See notes at the end of this release.
2 Newmont’s Board of Directors declared a dividend of $0.25 per share of common stock for the first quarter of 2024, payable on June 27, 2024 to holders of record at the close of business on June 4, 2024.
3 Gold equivalent ounces (GEOs) calculated using Gold ($1,400/oz.), Copper ($3.50/lb.), Silver ($20.00/oz.), Lead ($1.00/lb.) and Zinc ($1.20/lb.) pricing for 2024.
4 Newmont’s go-forward portfolio is focused on Tier 1 assets, consisting of (1) six managed Tier 1 assets (Boddington, Tanami, Cadia, Lihir, Peñasquito and Ahafo), (2) assets owned through two non-managed joint ventures at Nevada Gold Mines and Pueblo Viejo, including four Tier 1 assets (Carlin, Cortez, Turquoise Ridge and Pueblo Viejo), (3) three emerging Tier 1 assets (Merian, Cerro Negro and Yanacocha), which do not currently meet the criteria for Tier 1 Asset, and (4) an emerging Tier 1 district in the Golden Triangle in British Columbia (Red Chris and Brucejack), which does not currently meet the criteria for Tier 1 Asset. Newmont’s Tier 1 portfolio also includes attributable production from the Company’s equity interest in Lundin Gold (Fruta del Norte). Tier 1 Portfolio cost and capital metrics include the proportional share of the Company’s interest in the Nevada Gold Mines joint venture.
5 Non-GAAP metrics; see reconciliations at the end of this release.
6 Synergies are a management estimate provided for illustrative purposes and should not be considered a GAAP or non-GAAP financial measure. Synergies represent management’s combined estimate of pre-tax synergies, supply chain efficiencies and Full Potential improvements, as a result of the integration of Newmont’s and Newcrest’s businesses that have been monetized for the purposes of the estimation. Such estimates are necessarily imprecise and are based on numerous judgments and assumptions. See cautionary statement at the end of this release regarding forward-looking statements.
7 See discussion of outlook and cautionary statement at the end of this release regarding forward-looking statements.
Advancing Portfolio Optimization with Sale of Lundin Gold Financing Facilities
Newmont announced today that Lundin Gold Inc. (Lundin Gold) has agreed to buy out 100 percent of the balance of the stream credit facility agreement and offtake agreement for the Fruta del Norte gold mine in Ecuador for total consideration of $330 million, payable in cash in two tranches: $180 million as of the expected closing date of June 28, 2024, and the remaining $150 million by September 30, 2024. Newmont has maintained its exposure to the Fruta del Norte operation through its equity interest in Lundin Gold.
In connection with the acquisition of Newcrest and the Company’s strategy to create lasting value, Newmont committed to delivering at least $2 billion in near-term cash improvements through portfolio optimization within the first two years. The early repayment of the facilities is another step in delivering on this commitment as Newmont continues to build a more profitable and resilient future for the business.
Summary of First Quarter Results
FIRST QUARTER 2024 FINANCIAL AND PRODUCTION SUMMARY
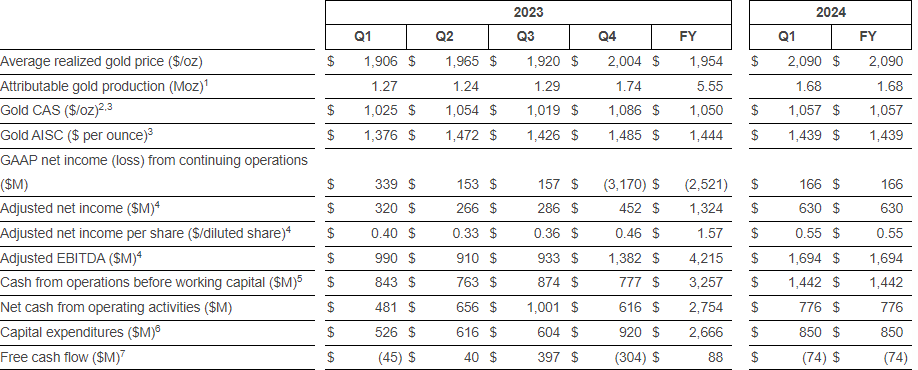
Attributable gold production1 decreased 4 percent to 1,675 thousand ounces from the prior quarter primarily due to lower production at Tanami due to a planned mill shutdown and seasonal rainfall impacts, and the ongoing stripping campaigns at Boddington and Akyem. In addition, lower production was delivered from the non-managed joint venture at Nevada Gold Mines. This unfavorable impact was partially offset by higher production at Peñasquito and Yanacocha, as well as a full quarter of ownership of the sites acquired in the Newcrest transaction. Full year production for 2024 is expected to be second-half weighted as previously indicated.
Looking ahead, operations at Cerro Negro are currently suspended as a full investigation is conducted following the tragic fatalities of two members of the Newmont workforce on April 9, 2024. In addition, operations are temporarily suspended at Telfer, one of Newmont’s non-core assets, as further work is completed to remediate the safe operation of the tailings storage facility.
Average realized gold price was $2,090, an increase of $86 per ounce over the prior quarter. Average realized gold price includes $2,082 per ounce of gross price received, a favorable impact of $19 per ounce mark-to-market on provisionally-priced sales and reductions of $11 per ounce for treatment and refining charges.
Gold CAS2 totaled $1.7 billion for the quarter. Gold CAS per ounce3 was largely in line with the prior quarter at $1,057 per ounce.
Gold AISC per ounce3 was largely in line with the prior quarter at $1,439 per ounce, with a slight improvement from lower sustaining capital spend.
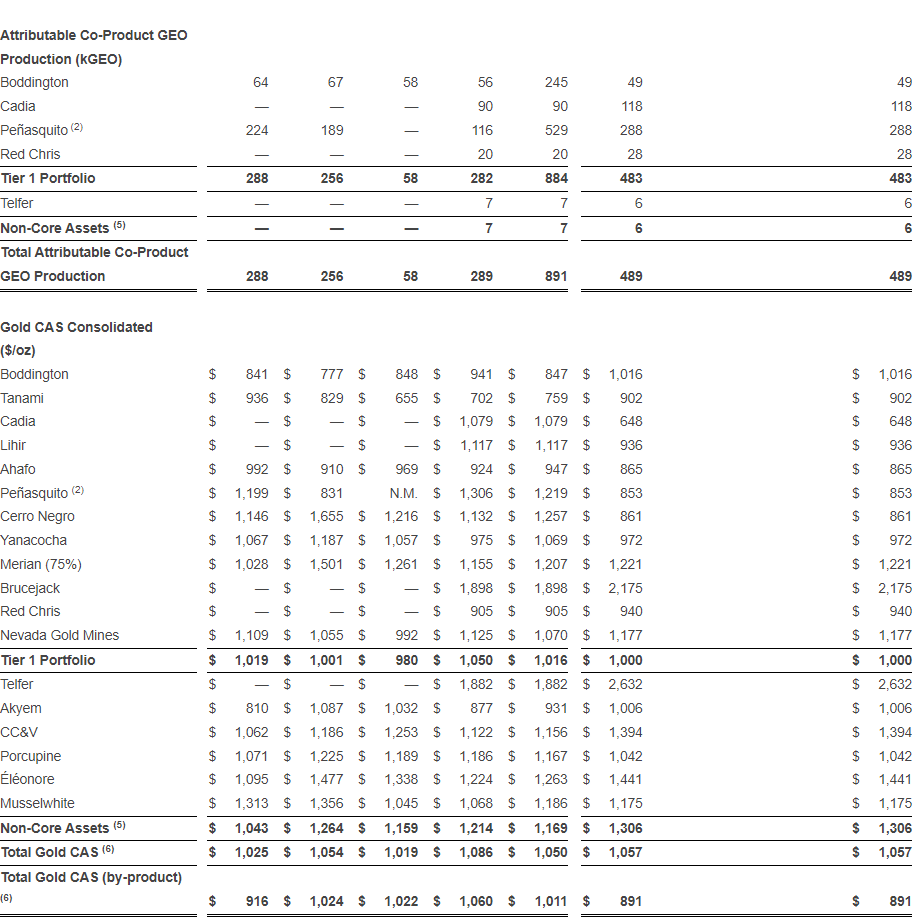
Attributable gold equivalent ounce (GEO) production from other metals increased 69 percent to 489 thousand ounces from the prior quarter primarily due to the ramp-up of Peñasquito to full operations after the resolution of the labor strike in the fourth quarter of 2023, combined with higher co-product grades from the Chile Colorado pit. In addition, Cadia delivered higher copper production.
CAS from other metals2 totaled $416 million for the quarter. CAS per GEO3 decreased 34 percent to $829 per ounce from the prior quarter primarily due to higher other metal sales as a result of the increased volumes at Peñasquito.
AISC per GEO3 decreased 33 percent to $1,148 per ounce compared to the prior quarter primarily due to lower CAS per GEO as a result of the increased volumes at Peñasquito, as well as lower sustaining capital spend.
Net income from continuing operations attributable to Newmont stockholders was $166 million or $0.15 per diluted share, an increase of $3.3 billion from the prior quarter primarily due to the recognition of impairment charges and higher reclamation and remediation expense during the fourth quarter of 2023, as well as higher average realized gold prices and lower CAS in the first quarter of 2024.
Adjusted net income4 was $630 million or $0.55 per diluted share,compared to $452 million or $0.46 per diluted share in the prior quarter. Primary adjustments to first quarter net income include a loss on assets held for sale of $485 million, changes in the fair value of investments of $31 million, Newcrest transaction and integration costs of $29 million and settlement costs of $21 million.
Adjusted EBITDA4 increased 23 percent to $1,694 million for the quarter, compared to $1,382 million for the prior quarter.
Consolidated cash from operations before working capital5 increased 86 percent from the prior quarter to $1.4 billion primarily due to higher realized gold prices, lower CAS and lower Newcrest transaction and integration costs.
Consolidated net cash from operating activities increased 26 percent from the prior quarter to $776 million primarily due to the improvement in cash from operations described above, partially offset by a $666 million reduction in operating cash flow due to changes in working capital, including a $291 million stamp duty payment in connection with the Newcrest acquisition, a build in inventories, stockpiles and ore on leach pads of $193 million, a build in accounts receivable of $84 million and reclamation spend of $59 million, primarily related to the construction of the Yanacocha water treatment facilities.
Free Cash Flow7 was $(74) million compared to $(304) million in the prior quarter primarily due to lower sustaining and development capital expenditures.
Capital expenditures6 decreased 8 percent from the prior quarter to $850 million primarily due to lower sustaining and development capital spend. Development capital expenditures in 2024 primarily relate to Ahafo North, Tanami Expansion 2, Cadia Block Caves and Cerro Negro expansion projects.
Balance sheet and liquidity remained strong in the first quarter, ending the quarter with $2.3 billion of consolidated cash, cash of $342 million included in Current assets held for sale, with approximately $6.7 billion of total liquidity; reported net debt to adjusted EBITDA of 1.2x8.
NON-MANAGED JOINT VENTURE AND EQUITY METHOD INVESTMENTS9
Nevada Gold Mines (NGM) attributable gold production was 264 thousand ounces, with CAS of $1,177 per ounce3 and AISC of $1,576 per ounce3 for the first quarter.
Pueblo Viejo (PV) attributable gold production was 54 thousand ounces for the quarter. Cash distributions received for the Company’s equity method investment in Pueblo Viejo totaled $45 million in the first quarter. Capital contributions of $9 million were made during the quarter related to the expansion project at Pueblo Viejo.
Fruta del Norte attributable gold production is reported on a quarter lag. Production reported in the first quarter of 2024 was 21 thousand ounces. Cash distributions received from the Company’s equity method investment in Fruta del Norte were $8 million for the first quarter.
1 Attributable gold production includes ounces from the Company’s equity method investment in Pueblo Viejo (40%) and in Lundin Gold (31.9%).
2 Consolidated Costs applicable to sales (CAS) excludes Depreciation and amortization and Reclamation and remediation.
3 Non-GAAP measure. See end of this release for reconciliation to Costs applicable to sales.
4 Non-GAAP measure. See end of this release for reconciliation to Net income (loss) attributable to Newmont stockholders.
5 Cash from operations before working capital is a non-GAAP metric with the most directly comparable GAAP financial metric being to Net cash provided by (used in) operating activities, as shown reconciled in the Condensed Consolidated Statements of Cash Flows.
6 Capital expenditures refers to Additions to property plant and mine development from the Consolidated Statements of Cash Flows.
7 Non-GAAP measure. See end of this release for reconciliation to Net cash provided by operating activities. Excluding the stamp duty payment in connection with the Newcrest transaction, Newmont generated Free Cash Flow of $217 million.
8 Non-GAAP measure. See end of this release for reconciliation.
9 Newmont has a 38.5% interest in Nevada Gold Mines, which is accounted for using the proportionate consolidation method. In addition, Newmont has a 40% interest in Pueblo Viejo, which is accounted for as an equity method investment, as well as a 31.9% interest in Lundin Gold, who wholly owns and operates the Fruta del Norte mine, which is accounted for as an equity method investment on a quarter lag.
Key Projects in Execution
Newmont’s project pipeline supports stable production with improving margins and mine life1. Newmont’s 2024 outlook includes current development capital costs and production related to the key projects of Tanami Expansion 2, Ahafo North and Cadia Block Caves.
- Tanami Expansion 2 (Australia) secures Tanami’s future as a long-life, low-cost producer by extending mine life beyond 2040 through the addition of a 1,460 meter hoisting shaft and supporting infrastructure to process 3.3 million tonnes per year and provide a platform for future growth. The expansion is expected to increase average annual gold production by approximately 150 to 200 thousand ounces per year for the first five years and reduce operating costs by approximately 30 percent, bringing average all-in sustaining costs to $900 to $1,000 per ounce for Tanami (2028 – 2032). As a result of the identification of required overbreak and underbreak remediation, commercial production for the project is now expected in the second half of 2027. Total capital costs are now estimated to be between $1.7 and $1.8 billion, incorporating the required remediation work. Development costs (excluding capitalized interest) since approval were $806 million, of which $54 million related to 2024.
- Ahafo North (Ghana) expands our existing footprint in Ghana with four open pit mines and a stand-alone mill located approximately 30 kilometers from the Company’s Ahafo South operations. The project is expected to add between 275 and 325 thousand ounces per year with all-in sustaining costs of $800 to $900 per ounce for the first five full years of production (2026 – 2030). Ahafo North is the best unmined gold deposit in West Africa with approximately 4.1 million ounces of Reserves and 1.3 million ounces of Measured, Indicated and Inferred Resources2 and significant upside potential to extend beyond Ahafo North’s current 13-year mine life. Commercial production for the project is expected in the second half of 2025. Total capital costs are estimated to be between $950 and $1,050 million. Development costs (excluding capitalized interest) since approval were $434 million, of which $59 million related to 2024.
- Cadia Block Caves (Australia) includes two existing panel caves to recover approximately 5.9 million ounces of Gold Reserves as well as 1.3 million tonnes of Copper Reserves. First ore has been delivered from the first panel cave (PC2-3), and development is underway at the second panel cave (PC1-2). The newly-acquired project is currently under review, and a more fulsome update on the anticipated metrics is expected to be provided in the second half of 2024. Development capital costs (excluding capitalized interest) since approval were $76 million, of which $40 million related to 2024.
Committed to Concurrent Reclamation
Since mines operate for a finite period, careful closure planning is crucial to address the diverse social, economic, environmental and regulatory impacts associated with the end of mining operations. Newmont’s global Closure Strategy integrates closure planning throughout each operation’s lifespan, aiming to create enduring positive and sustainable legacies that last long after mining ceases. Newmont continues to accrue to reclamation and remediation spend through the year. Newmont expects to incur a cash outflow of approximately $600 million in 2024 and $700 million in 2025, primarily related to the construction of two new water treatment plants and post-closure management at Yanacocha. The operation’s ongoing closure planning study advanced to the feasibility state in December 2023 and continues to address several complex closure issues, including water management, social impacts and tailings. A long-term water management solution will replace five existing water treatment facilities with two, addressing the watersheds along the continental divide. Certain estimated costs remain subject to revision as ongoing study work and assessment of opportunities that incorporates the latest design considerations remain in progress.
1 Project estimates remain subject to change based upon uncertainties, including future market conditions, macroeconomic and geopolitical conditions, changes in interest rates, inflation, commodities and raw materials prices, supply chain disruptions, labor markets, engineering and mine plan assumptions, future funding decisions, consideration of strategic capital allocation and other factors, which may impact estimated capital expenditures, AISC and timing of projects. See end of this release for cautionary statement regarding forward-looking statements.
2 Total resources presented for Ahafo North includes Measured and Indicated resources of 1 million gold ounces and Inferred resources of 300 thousand gold ounces. See cautionary statement at the end of this release.
Newmont’s 2024 Outlook
For a more detailed discussion, see the Company’s 2024 Outlook released on February 22, 2024, available on Newmont.com. Please see the cautionary statement and footnotes for additional information.
| Guidance Metric | 2024E |
| Attributable Gold Production (Koz) | |
| Managed Tier 1 Portfolio | 4,100 |
| Non-Managed Tier 1 Portfolio | 1,530 |
| Total Tier 1 Portfolio | 5,630 |
| Non-Core Assets | 1,300 |
| Total Newmont Attributable Gold Production (Koz) | 6,930 |
| Attributable Gold CAS ($/oz) ($1,900/oz price assumption) | |
| Managed Tier 1 Portfolio | 980 |
| Non-Managed Tier 1 Portfolio | 1,130 |
| Total Tier 1 Portfolio | 1,000 |
| Non-Core Assets | 1,400 |
| Total Newmont Gold CAS ($/oz)a | 1,050 |
| Attributable Gold AISC ($/oz) ($1,900/oz price assumption) | |
| Managed Tier 1 Portfolio | 1,250 |
| Non-Managed Tier 1 Portfolio | 1,440 |
| Total Tier 1 Portfolio | 1,300 |
| Non-Core Assets | 1,750 |
| Total Newmont Gold AISC ($/oz)a | 1,400 |
| Copper ($8,818/tonne price assumption)a | |
| Copper Production – Tier 1 Portfolio (ktonne) | 144 |
| Copper Production – Non-Core Assets (ktonne) | 8 |
| Total Newmont Copper Production (ktonne) | 152 |
| Copper CAS – Tier 1 Portfolio ($/tonne) | $5,050 |
| Copper CAS – Non-Core Assets ($/tonne) | $11,050 |
| Total Newmont Copper CAS ($/tonne)b | $5,080 |
| Copper AISC – Tier 1 Portfolio ($/tonne) | $7,350 |
| Copper AISC – Non-Core Assets ($/tonne) | $12,540 |
| Total Newmont Copper AISC ($/tonne)b | $7,380 |
| Silver ($23.00/oz price assumption) | |
| Silver Production (Moz) | 34 |
| Silver CAS ($/oz)b | $11.00 |
| Silver AISC ($/oz)b | $15.40 |
| Lead ($2,205/tonne price assumption)a | |
| Lead Production (ktonne) | 95 |
| Lead CAS ($/tonne)b | $1,220 |
| Lead AISC ($/tonne)b | $1,570 |
| Zinc ($2,976/tonne price assumption)a | |
| Zinc Production (ktonne) | 245 |
| Zinc CAS ($/tonne)b | $1,550 |
| Zinc AISC ($/tonne)b | $2,300 |
| Attributable Capital | |
| Sustaining Capital($M)a | $1,800 |
| Development Capital($M)a | $1,300 |
| Consolidated Expenses | |
| Exploration & Advanced Projects ($M) | $450 |
| General & Administrative ($M) | $300 |
| Interest Expense ($M) | $365 |
| Depreciation & Amortization ($M) | $2,850 |
| Adjusted Tax Rate c,d | 34% |
aCo-product metal pricing assumptions in imperial units equate to Copper ($4.00/lb.), Lead ($1.00/lb.) and Zinc ($1.35/lb.).
bConsolidated basis
c The adjusted tax rate excludes certain items such as tax valuation allowance adjustments.
d Assuming average prices of $1,900 per ounce for gold, $4.00 per pound for copper, $23.00 per ounce for silver, $1.00 per pound for lead, and $1.35 per pound for zinc and achievement of current production, sales and cost estimates, we estimate our consolidated adjusted effective tax rate related to continuing operations for 2024 will be 34%.
2024 Site Outlooka
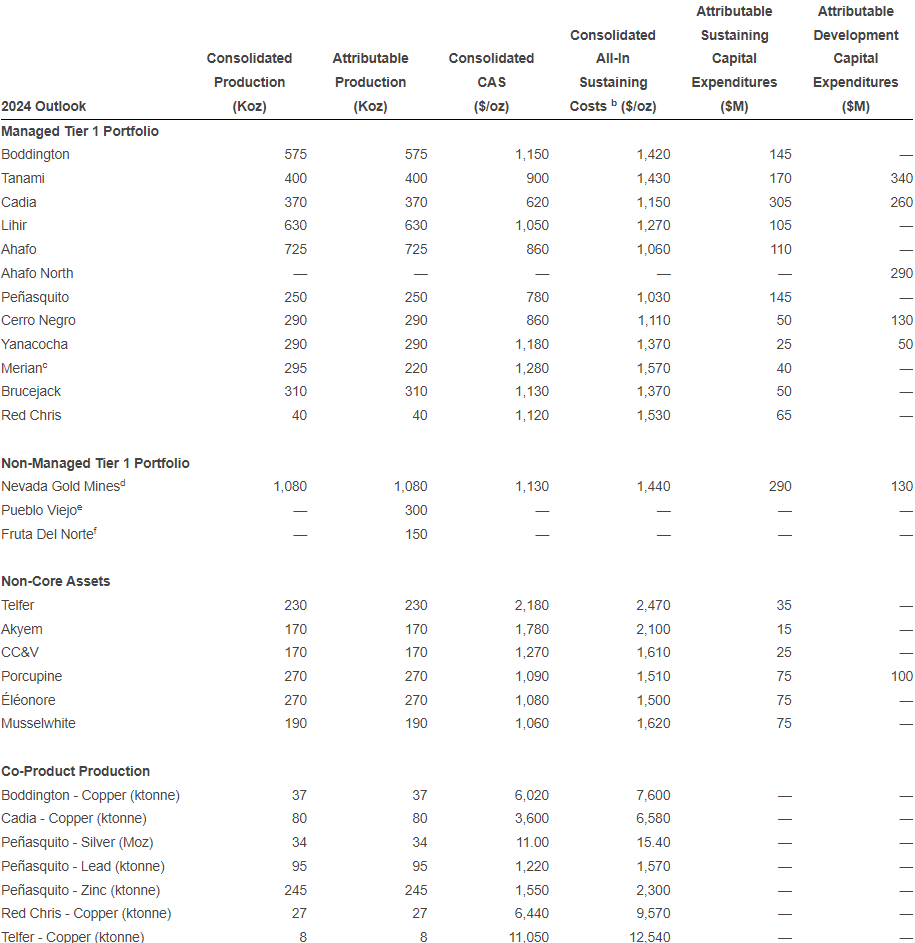
a 2024 outlook projections are considered forward-looking statements and represent management’s good faith estimates or expectations of future production results as of February 22, 2024. Outlook is based upon certain assumptions, including, but not limited to, metal prices, oil prices, certain exchange rates and other assumptions. For example, 2024 Outlook assumes $1,900/oz Au, $8,818/tonne Cu, $23.00/oz Ag, $2,976/tonne Zn, $2,205/tonne Pb, $0.70 AUD/USD exchange rate, $0.75 CAD/USD exchange rate and $90/barrel WTI. Production, CAS, AISC and capital estimates exclude projects that have not yet been approved. The potential impact on inventory valuation as a result of lower prices, input costs, and project decisions are not included as part of this Outlook. Assumptions used for purposes of Outlook may prove to be incorrect and actual results may differ from those anticipated, including variation beyond a +/-5% range. Outlook cannot be guaranteed. As such, investors are cautioned not to place undue reliance upon Outlook and forward-looking statements as there can be no assurance that the plans, assumptions or expectations upon which they are placed will occur. Amounts may not recalculate to totals due to rounding. See cautionary at the end of this release.
b All-in sustaining costs (AISC) as used in the Company’s Outlook is a non-GAAP metric; see below for further information and reconciliation to consolidated 2024 CAS outlook.
c Consolidated production for Merian is presented on a total production basis for the mine site; attributable production represents a 75% interest for Merian.
d Represents the ownership interest in the Nevada Gold Mines (NGM) joint venture. NGM is owned 38.5% by Newmont and owned 61.5% and operated by Barrick. The Company accounts for its interest in NGM using the proportionate consolidation method, thereby recognizing its pro-rata share of the assets, liabilities and operations of NGM.
e Attributable production includes Newmont’s 40% interest in Pueblo Viejo, which is accounted for as an equity method investment.
f Attributable production includes Newmont’s 31.9% interest in Lundin Gold, who wholly owns and operates the Fruta del Norte mine, which is accounted for as an equity method investment on a quarter lag.
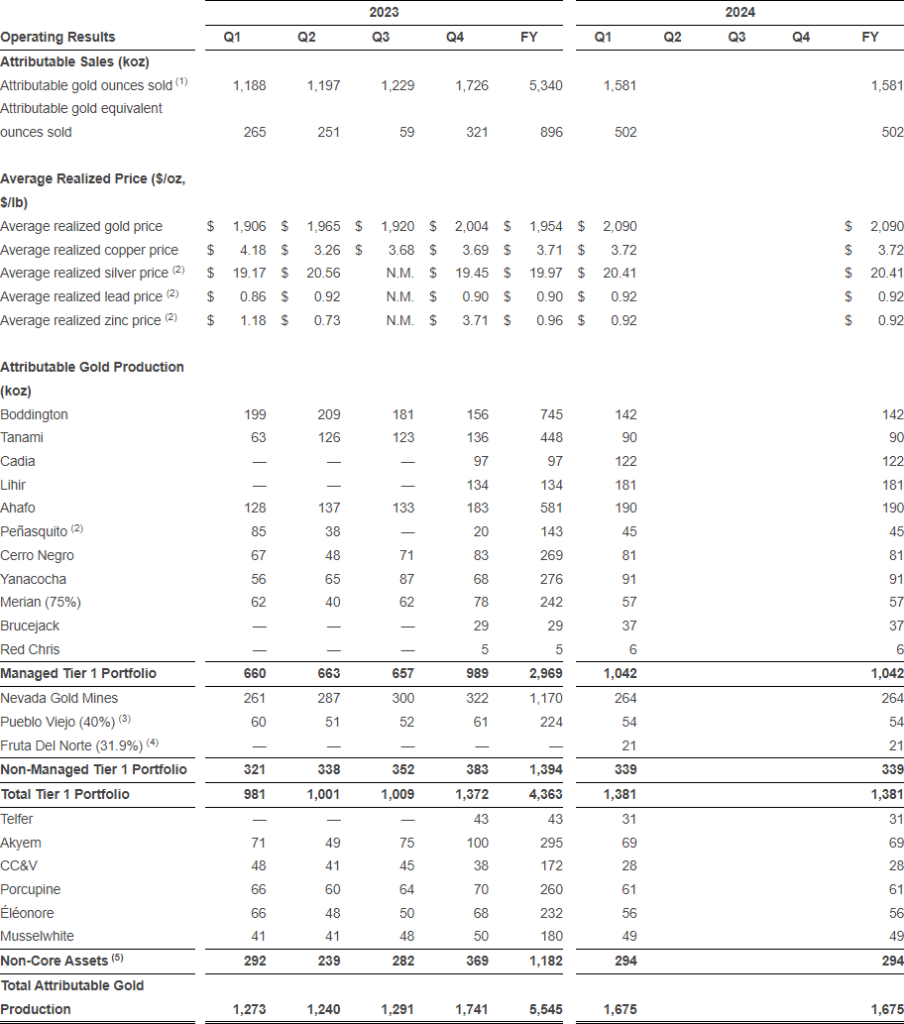
- Attributable gold ounces sold excludes ounces related to the Pueblo Viejo mine, which is 40% owned by Newmont and accounted for as an equity method investment, and the Fruta del Norte mine, which is wholly owned by Lundin Gold whom the Company holds a 31.9% interest and is accounted for as an equity method investment.
- For the three months ended June 30, 2023 and September 30, 2023, Peñasquito production was impacted due to the suspension of operations as a result of the Union labor strike. Sales activity recognized in the third quarter of 2023 was related to adjustments on provisionally price concentrate sales subject to final settlement. Consequently, price per ounce/pound metrics are not meaningful (“N.M”).
- Represents attributable gold from Newmont’s 40% interest in Pueblo Viejo, which is accounted for as an equity method investment. Attributable gold ounces produced at Pueblo Viejo are not included in attributable gold ounces sold, as noted in footnote (1). Income and expenses of equity method investments are included in Equity income (loss) of affiliates.
- Represents attributable gold from Newmont’s 31.9% interest in Lundin Gold, who wholly owns and operates the Fruta del Norte mine, which is accounted for on a quarterly-lag as an equity method investment. Attributable gold ounces produced by Lundin Gold represent prior quarter production and are not included in attributable gold ounces sold, as noted in footnote (1). Income and expenses of equity method investments are included in Equity income (loss) of affiliates.
- Sites are classified as held for sale as of March 31, 2024.
- Non-GAAP measure. See end of this release for reconciliation.
Contacts
Media Contact
Jennifer Pakradooni
[email protected]
Investor Contact – Global
Neil Backhouse
[email protected]
Investor Contact – Asia Pacific
Christopher Maitland
[email protected]
Original Article: https://www.businesswire.com/news/home/20240425686032/en/Newmont-Reports-First-Quarter-2024-Results


