Introduction
In an earlier article, we went over the true all-in costs to mine an ounce of gold in Q1FY13 and discussed one of the most important metrics to analyze the gold industry – the actual cost of mining an ounce of gold, which can help an investor figure out whether it is time to buy GLD and/or the gold miners. In that analysis, we used FY2012 financials to calculate the combined results of publicly traded gold companies and came up with a true all-in industry average cost of production to mine each ounce of gold.
In this analysis we will calculate the true costs of production of Goldcorp (GG), one of the largest gold companies in the world. GG produces gold, silver, copper, lead and zinc in countries located strictly in North and South America – an overview of its development projects and mines can be found here on the website.
Calculating the True Mining Cost of Gold – Our Methodology
In the previously mentioned article, we gave a thorough overview of the current way mining companies report their costs of production and why it is inaccurate and significantly underestimates total costs. Then we presented a more accurate methodology for investors to use to calculate the true costs of mining gold or silver. Please refer to that article for the details explaining this methodology, which is an important concept for all precious metals investors to understand.
Explanation of Our Metrics
Cost Per Gold-Equivalent Ounce – is the costs incurred for every payable gold-equivalent ounce. It is revenues minus net income, which will give an investor total costs. We use payable gold and not produced gold, because payable gold is the gold that the miner actually keeps and is more reflective of its production. Miners also use payable gold and not produced gold when calculating its cash costs, so this is pretty standard.
We then add Derivative Gains (or minus Derivative Losses), which will give investors total costs without the effects of derivatives. Finally, we add Foreign Exchange Gains (or minus Foreign Exchange Losses) to remove the effects of foreign exchange on the company’s costs.
Cost Per Gold-Equivalent Ounce Excluding Write-downs – is the above-mentioned “cost per gold-equivalent ounce” minus property/investment write-downs and asset sales. This provides investors with a metric that removes exceptional gains or losses due to write-downs and asset sales.
Cost Per Gold-Equivalent Ounce Excluding Write-downs and Adding Smelting and Refining Costs – is the above-mentioned “cost per gold-equivalent ounce excluding write-downs” adding in smelting, refining and all other necessary pre-revenue costs. This is a new metric that we are now introducing to our true all-in cost series because it will more accurately measure all-in costs and allow comparisons between miners.
Most investors are unaware that many miners will remove smelting, refining and other costs before reporting their total revenues figures and these pre-revenue costs are not reported in the income statement. The result of this is that it skews all-in costs higher for miners that refine themselves or include the costs in their income statement, while inaccurately showing lower costs for miners that remove it before reporting revenues.
A simple test can be done on any miner to see if there are any pre-revenue costs that are not reported in the income statement. Simply take payable production and multiply it by average realized sales price and this should come relatively close to the total revenues figure. If it gives you a number much higher than reported revenues then there are pre-revenue costs that are not being reported.
This line should alleviate these issues and allow comparisons on a fair basis.
True Costs of Production for GG
Let us use this methodology to take a look at GG’s results and come up with the true cost figures for each ounce of production. When applying our methodology for the most recent quarter and FY2012, we standardized the equivalent ounce conversion to use the average LBMA price for Q2FY13 which results in a silver-to-gold ratio of 61:1, copper-to-gold ratio of 436:1, lead-to-gold ratio of 1520:1, and a zinc-to-gold ratio of 1703:1. Since our conversions change with metal prices, this may influence the total equivalent ounces produced for past quarters – which will make current-to-past quarter comparisons much more relevant.
(click to enlarge)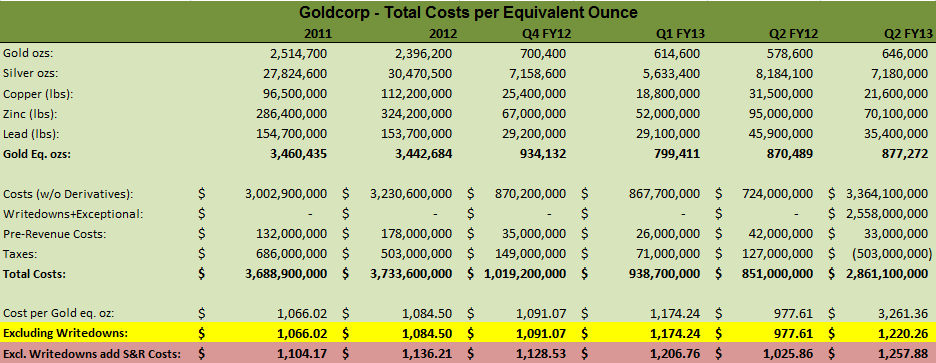
Notes about Goldcorp’s Revenues and Costs
Investors analyzing Goldcorp’s consolidated financial statements need to include the adjusted costs of Alumbrera and Pueblo Viejo when calculating GG’s true production costs. If they fail to do so they will incorporate production from these two mines while neglecting costs. In this analysis we have included both the production and costs of these mines that are attributable to GG in our cost figures.
Observations for GG Investors
Goldcorp’s second quarter true all-in costs numbers rose on a year-over-year and quarter-over-quarter basis to $1,258 per gold-equivalent ounce. Compared to the first quarter, this was around a $50 or 4% rise, while compared to the 2012 average of $1136 per ounce, Q2FY13 costs were 10% higher than the 2012 average. The rising true all-in costs are a negative sign, but this may be more of the law of averages asserting itself and bringing GG more in-line with the costs realized by other companies.
Even with rising Q2 costs, GG still has lower true all-in costs than many of its larger competitors’ Q1FY13 costs. Compared to Q1FY13 numbers of competitors such as Yamana Gold (AUY) (costs just over $1300), Kinross Gold (KGC) (costs above $1350), Silvercrest Mines (SVLC) (costs below $1100), Newmont Gold (NEM) (costs around $1300) Agnico-Eagle (AEM) (costs around $1400) and Barrick Gold (ABX) (costs around $1200).
Corporate Liquidity – Liquidity is very important for investors to monitor in this current low-price gold environment. As one of the largest miners in the world, Goldcorp has a very strong financial position of around $1.5 billion in cash, cash equivalents and money market funds, though the debt has grown to around $2 billion compared to under $1 billion a year ago. Even with the increasing debt load, GG should have no worries about liquidity.
Production Numbers – Goldcorp’s gold production numbers were a bright spot for the quarter. This was around a 10% rise year-over-year and a 4% rise sequentially – which is very good considering many miners are having trouble simply maintaining production levels. Gold-equivalent production was also up, as sequential production of silver and base metals all increased. If production numbers can keep at current levels, GG has an opportunity to beat excellent FY13 numbers.
Conclusion
We are starting to see true all-in costs at Goldcorp increasing to levels similar to major competitors such as ABX and NEM. This is a situation worth monitoring because there is a little bit of a premium built into GG shares compared to some of the other majors, and if GG’s cost structure changes then it may no longer justify the premium. In terms of production, GG’s Q2FY13 quarter was very good and the company is on pace to have a very good year in terms of production.
The company remains profitable at current gold prices, and the primary reason for its Q2FY13 loss was related to a non-cash write-down. Investors looking for a major that still has a relatively good cost structure and growing production numbers should consider giving GG a look.


