DENVER–(BUSINESS WIRE)–Newmont Corporation (NYSE: NEM, TSX: NGT) (Newmont or the Company) today announced third quarter 2023 results and declared a third quarter dividend of $0.40 per share.
Newmont Delivered a Stable Q3 Performance
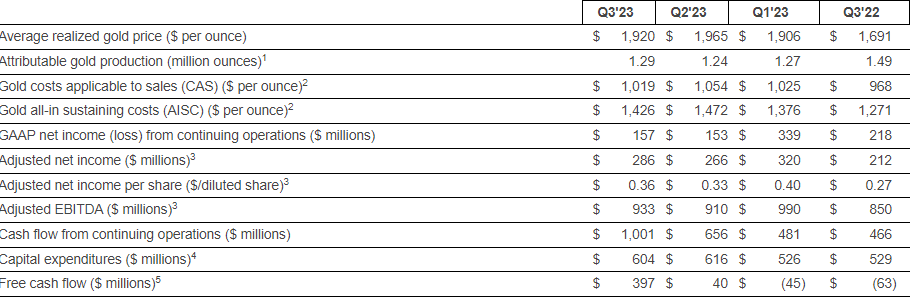
- Produced 1.3 million attributable gold ounces and 58 thousand co-product gold equivalent ounces (GEOs)* from copper; building momentum for improved production in the fourth quarter
- Reported gold Costs Applicable to Sales (CAS) per ounce** of $1,019 and gold All-In Sustaining Costs (AISC) per ounce** of $1,426; improvement driven by higher sales volumes compared to the prior quarter
- Revised 2023 outlook for the standalone Newmont portfolio to 5.3 million ounces of attributable production, CAS per ounce** of $1,000 and AISC per ounce** of $1,400; incorporates the impacts of the strike at Peñasquito, and lower production volumes from non-managed joint ventures (Nevada Gold Mines and Pueblo Viejo) and Ahafo***
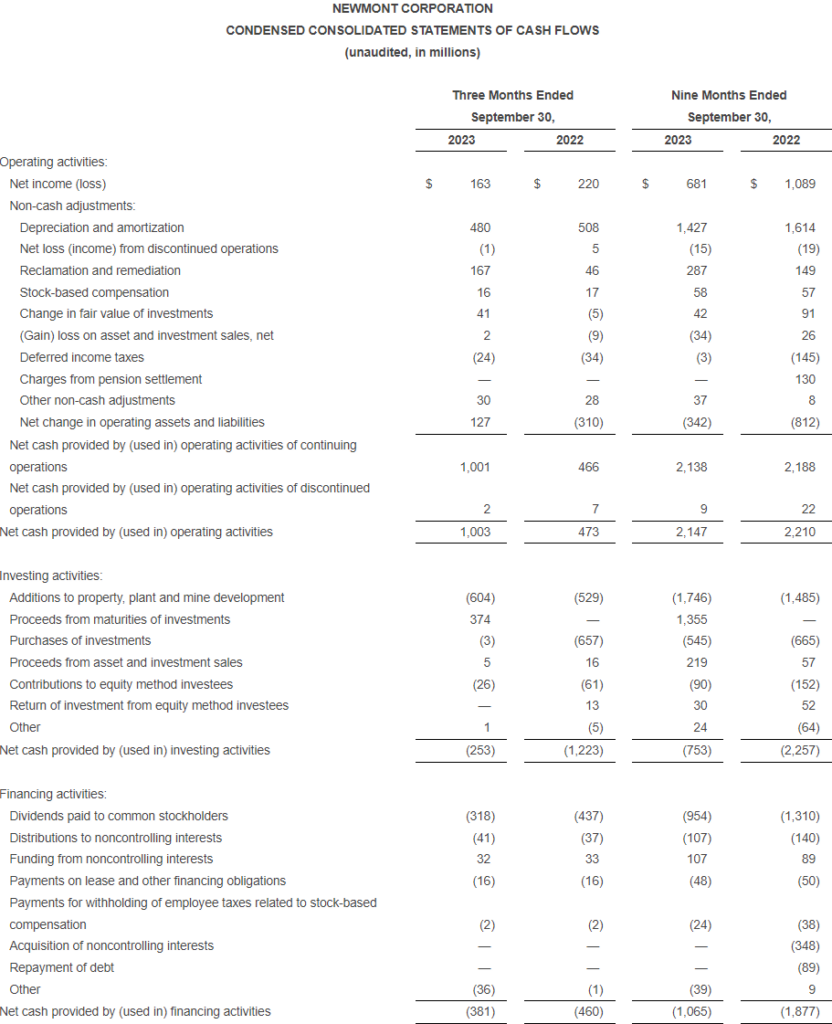
- Generated $1.0 billion of cash from continuing operations and reported $397 million of Free Cash Flow**; driven by favorable working capital changes, while continuing to reinvest in profitable projects
- Reported Net Income of $163 million, with Adjusted Net Income (ANI)** of $0.36 per diluted share and Adjusted EBITDA** of $933 million; driven by higher production volumes, strong gold prices and stable costs
- Ended the quarter with $3.2 billion of consolidated cash and $6.2 billion of liquidity; reported net debt to adjusted EBITDA ratio of 0.7x**
- Resolved the Union labor strike at Peñasquito; focused on the safe ramp-up of operations in the fourth quarter
- Received Full Funds approval for the Pamour project at Porcupine; on track to deliver first ore in 2024
- Declared commercial production at San Marcos; the first of six ore bodies in Cerro Negro District Expansion 1
- Assigned an A- rating with a stable outlook from Fitch; reflects Newmont’s ability to generate strong liquidity
- On track to close the pending acquisition of Newcrest Mining Limited (“Newcrest”) on November 6th; secured all government and regulatory approvals and shareholder votes
- Announced the addition of two Directors; welcoming Philip Aiken AM and Sally-Anne Layman from the Newcrest Board, with appointment to the Newmont Board of Directors effective upon close of the pending Newcrest transaction
Third Quarter Dividend Declared Within Established Framework****
- Board of Directors declared a dividend of $0.40 per share of common stock for the third quarter of 2023; payable on December 22, 2023 to holders of record at the close of business on November 30, 2023
- Annualized dividend payout range for 2023 of $1.40 to $1.80 per share****; subject to quarterly approval by Board of Directors
- Based on a sustainable base dividend of $1.00 per share payable at base reserves price and an incremental dividend payout of $0.60 per share; third quarter dividend payout calibrated at the mid-point of the $1,700 per ounce annualized payout range
“Newmont generated $1.0 billion of cash from continuing operations during the third quarter and continued to execute on our long-term strategic plan. As we look ahead to the closing of the Newcrest transaction, we are excited about the long-term value it will bring to both sets of stakeholders and our combined workforce. This transaction strengthens our position as the world’s leading gold company and sets the standard in safe, profitable and responsible mining. We look forward to closing the transaction on November 6th and providing our first integration update on the combined business in the first quarter of 2024.”
– Tom Palmer, Newmont President and Chief Executive Officer
* Gold equivalent ounces (GEOs) calculated using Gold ($1,400/oz.), Copper ($3.50/lb.), Silver ($20.00/oz.), Lead ($1.00/lb.) and Zinc ($1.20/lb.) pricing for 2023.
** Non-GAAP metrics; see reconciliations at the end of this release.
*** See discussion of outlook and cautionary statement at the end of this release regarding forward-looking statements. Revised outlook excludes Newcrest Mining Limited.
**** Expectations regarding 2023 dividend levels are forward-looking statements. The dividend framework is non-binding and an annualized dividend has not been declared by the Board. The declaration and payment of future quarterly dividends remains at the discretion of the Board of Directors and will depend on the Company’s financial results, cash flow and cash requirements, future prospects, and other factors deemed relevant by the Board. See cautionary statement at the end of this release.
Summary of Third Quarter Results
IMPROVED PRODUCTION AND CASH FLOWS DELIVERED IN THE THIRD QUARTER
In the third quarter, Newmont delivered improved production compared to the second quarter, despite navigating challenges at the sites noted below. Further improvements to production are expected in the fourth quarter.
- Peñasquito – Operations continued to be suspended at the site for the duration of the third quarter to focus on finding an appropriate and sustainable resolution to the dispute with the leadership of the National Union of Mine and Metal Workers of the Mexican Republic (“the Union”). On October 13, 2023, Newmont reached a resolution with the Union and has since begun the safe ramp-up of operations. Newmont expects to reach full operating capacity by the end of the fourth quarter.
- Ahafo – During the third quarter, the replacement conveyor at Ahafo was commissioned as planned. However, mill throughput was impacted when routine condition monitoring by Newmont’s Asset Management Team identified hairline fractures to one of the large grinding mill’s girth gears. To reduce any further deterioration to the gear and to avoid a major unplanned failure, Newmont made the decision to operate at less than full capacity. In October, the team optimized the processing circuit, bringing throughput to approximately 80 percent. Full processing rates are expected to be reached in the second quarter of 2024 when the girth gear is replaced.
- Cerro Negro – The site delivered higher ounces in the third quarter due to improved productivity compared to the second quarter. This improvement was tempered by supply chain disruptions as a result of import restrictions which impacted the ability to deliver key supplies to the site. Newmont will continue to work closely with suppliers to mitigate disruption in Argentina.
- Nevada Gold Mines and Pueblo Viejo6 – Lower than planned production was delivered from Newmont’s non-managed joint ventures.
Direct operating costs remained largely consistent with the second quarter as inflation pressures continued to stabilize, with improvements to pricing on commodities, as well lower direct costs as a result of the suspension of operations at Peñasquito. AISC was lower due to lower sustaining capital during the third quarter compared to the second quarter. Peñasquito incurred $78 million of operating costs and $53 million of depreciation and amortization while operations were suspended. These costs have not been adjusted from Newmont’s Non-GAAP financial metrics for the third quarter.
Cash flow from continuing operations was $1,001 million, which was favorable compared to the second quarter, primarily driven by favorable working capital changes, including the timing of accounts payable, draw-downs of lower cost inventory and lower cash tax payments. During the quarter, Newmont reinvested $604 million in capital spend, including $264 million in development capital spend to continue to progress near-term projects and $340 million in sustaining capital to progress site improvement projects.
THIRD QUARTER 2023 FINANCIAL AND PRODUCTION SUMMARY
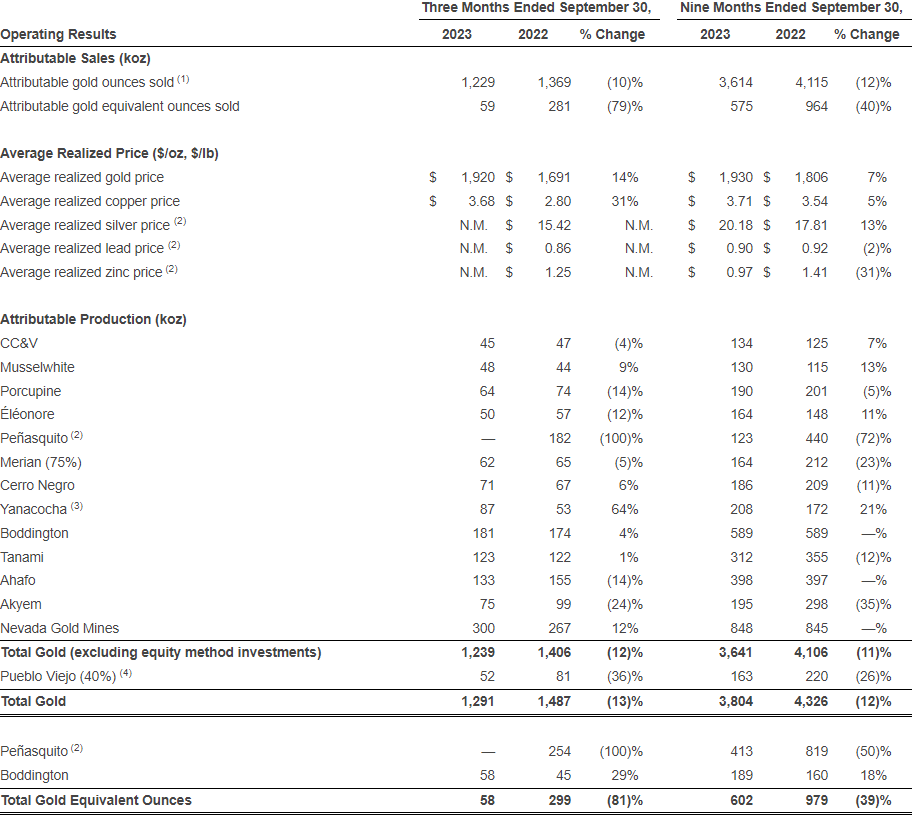
Attributable gold production1 decreased 13 percent to 1,291 thousand ounces from the prior year quarter primarily due to lower production at Peñasquito, Akyem and Ahafo. In addition, lower than planned production was delivered from the non-managed joint venture at Pueblo Viejo. This unfavorable impact was partially offset by higher production at Yanacocha. Gold sales were largely in line with production for the quarter.
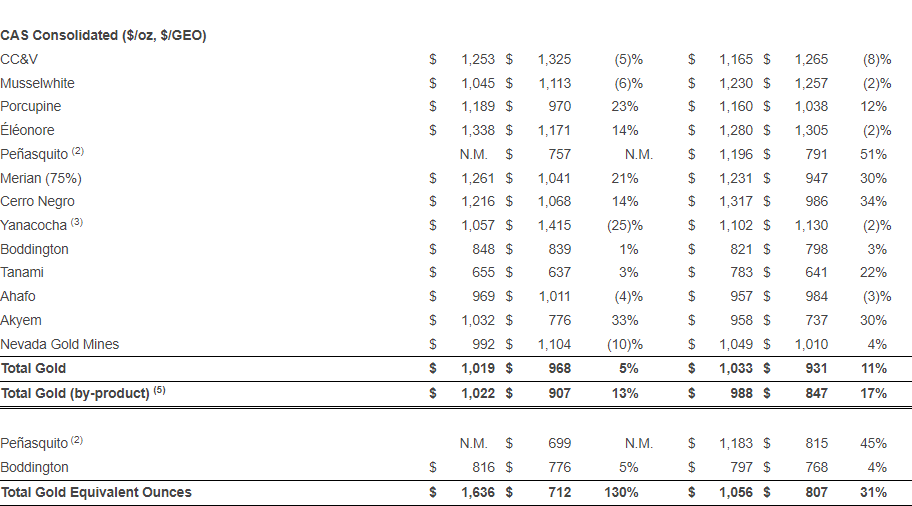
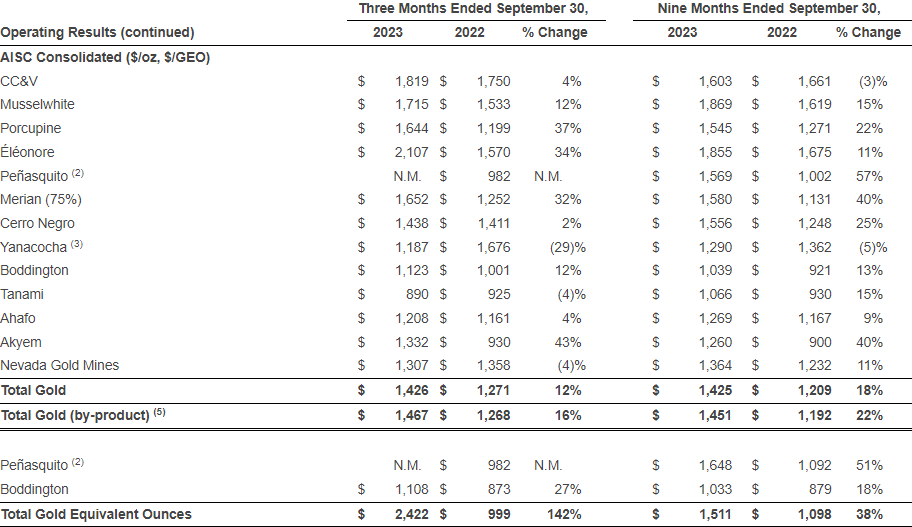
Gold CAS totaled $1.3 billion for the quarter. Gold CAS per ounce2 increased 5 percent to $1,019 per ounce from the prior year quarter primarily due to lower gold sales volumes as a result of the Peñasquito labor strike for the duration of the third quarter of 2023. This unfavorable impact was partially offset by lower energy, materials and contracted services costs at Peñasquito while operations were suspended.
Gold AISC per ounce2 increased 12 percent to $1,426 per ounce from the prior year quarter primarily due to higher CAS per gold ounce and higher sustaining capital spend.
Attributable gold equivalent ounce (GEO) production from other metals decreased 81 percent to 58 thousand ounces primarily due to the suspension of operations at Peñasquito, which were partially offset by higher copper production at Boddington. GEO sales were largely in line with production for the quarter.
CAS from other metals totaled $98 million for the quarter. CAS per GEO2 increased 130 percent to $1,636 per ounce from the prior year quarter primarily due to lower other metal sales as a result of the Peñasquito labor strike for the duration of the third quarter of 2023. This unfavorable impact was partially offset by lower energy, materials and contracted services costs at Peñasquito while operations were suspended.
AISC per GEO2 increased 142 percent to $2,422 per ounce primarily due to higher CAS per GEO as a result of the Peñasquito labor strike.
Average realized gold price was $1,920, an increase of $229 per ounce over the prior year quarter. Average realized gold price includes $1,929 per ounce of gross price received, an unfavorable impact of $4 per ounce mark-to-market on provisionally-priced sales and reductions of $5 per ounce for treatment and refining charges.
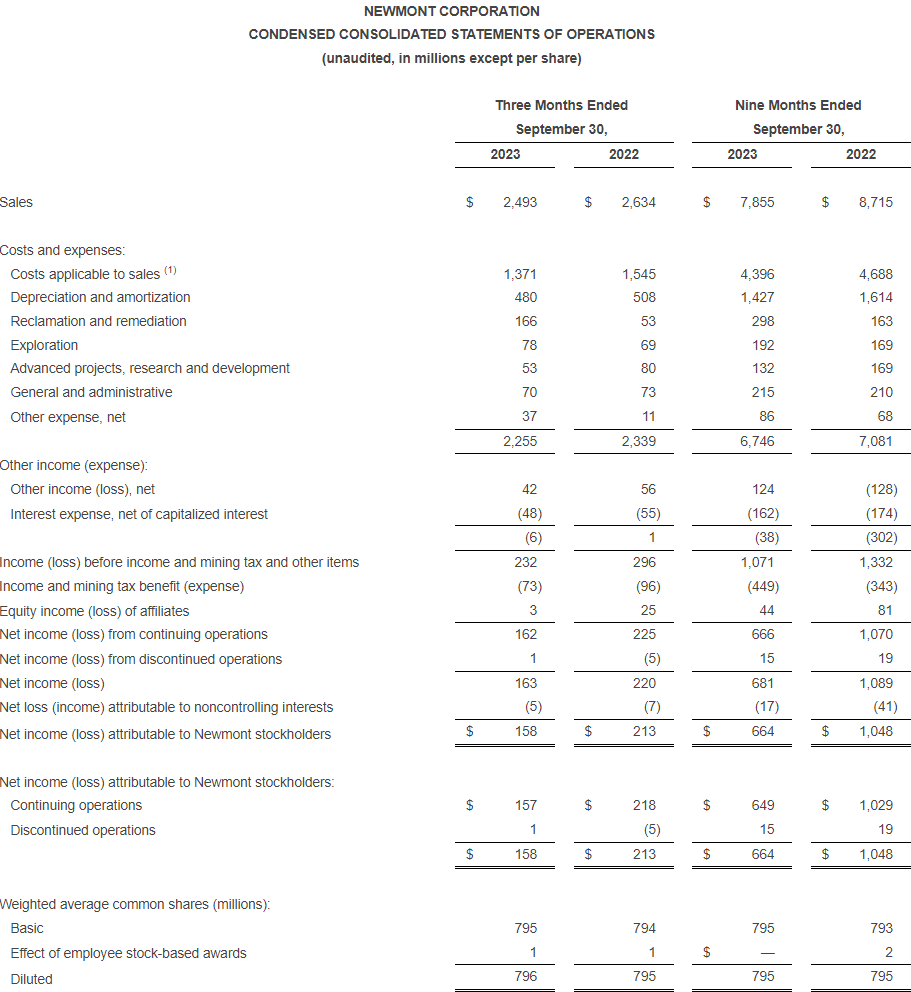
Revenue decreased 5 percent from the prior year quarter to $2.5 billion primarily due to lower sales volumes, partially offset by higher average realized gold and copper prices.
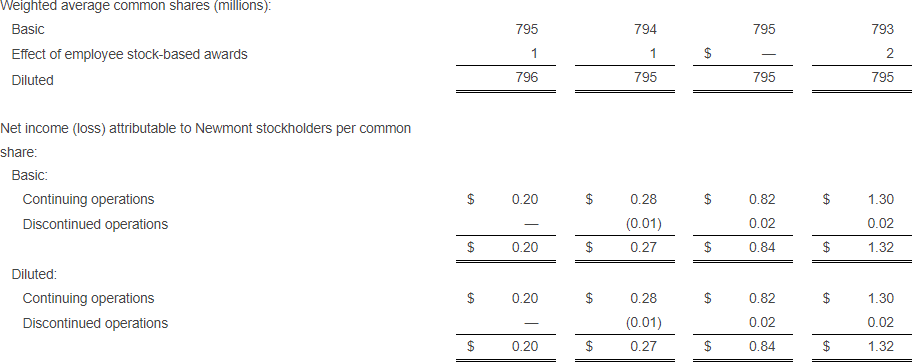
Net income from continuing operations attributable to Newmont stockholders was $157 million or $0.20 per diluted share, a decrease of $61 million from the prior year quarter primarily due to lower sales volumes as a result of the Peñasquito labor strike, as well as higher reclamation and remediation charges. These decreases were partially offset by higher average realized prices for gold and copper and lower CAS.
Adjusted net income3 was $286 million or $0.36 per diluted share,compared to $212 million or $0.27 per diluted share in the prior year quarter. Primary adjustments to third quarter net income include reclamation and remediation charges of $104 million, changes in the fair value of investments of $41 million, Newcrest transaction-related costs of $16 million and restructuring and severance costs of $7 million.
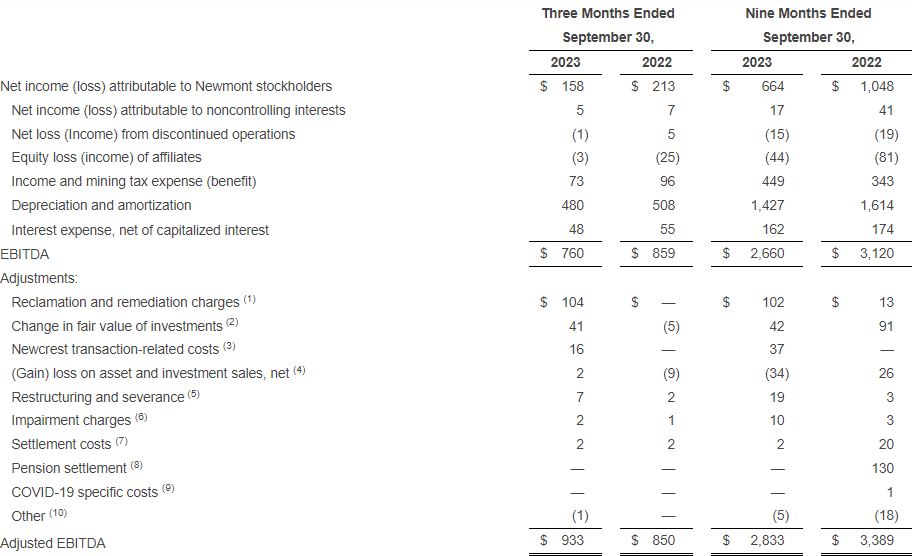
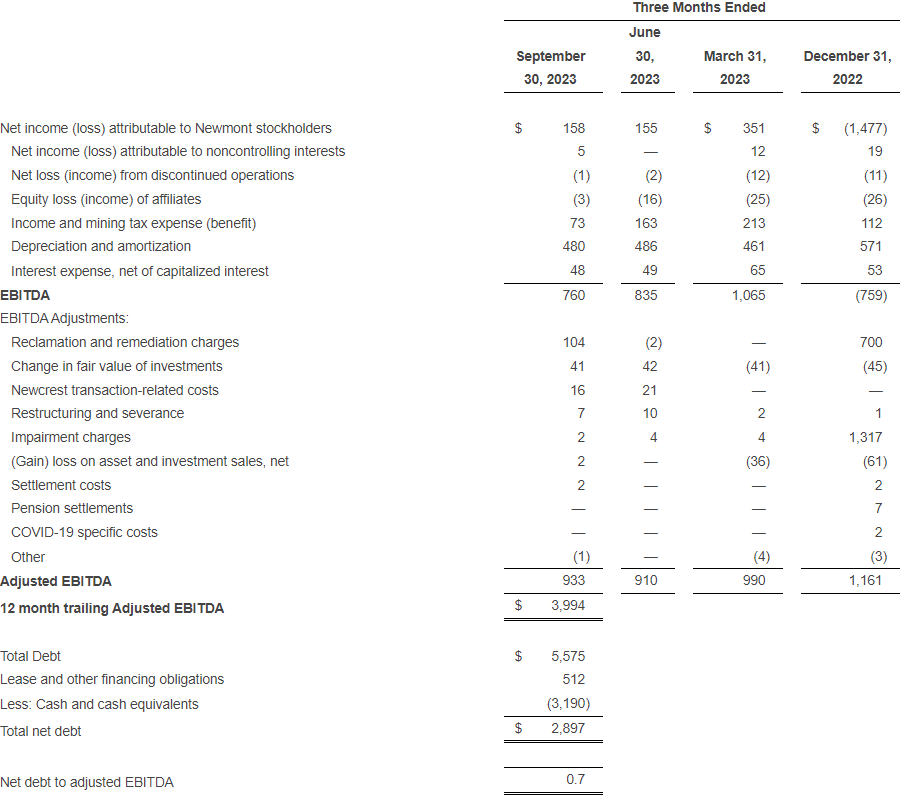
Adjusted EBITDA3 increased 10 percent to $933 million for the quarter, compared to $850 million for the prior year quarter.
Capital expenditures4 increased 14 percent from the prior year quarter to $604 million primarily due to higher sustaining capital spend. Development capital expenditures in 2023 primarily relate to Tanami Expansion 2, Ahafo North, Yanacocha Sulfides, Pamour and Cerro Negro District Expansion 1.
Consolidated operating cash flow from continuing operations increased 115 percent from the prior year quarter to $1,001 million primarily due to payments made in the third quarter of 2022 related to 2021 site performance for the Peñasquito Profit-Sharing Agreement, as well as the timing of accounts payable and prepaid taxes at Peñasquito, partially offset by a decrease in revenue due to lower sales volumes primarily as a result of the strike at Peñasquito.
Free Cash Flow5 increased to $397 million from $(63) million in the prior year quarter primarily due to higher operating cash flow, partially offset by higher capital expenditures.
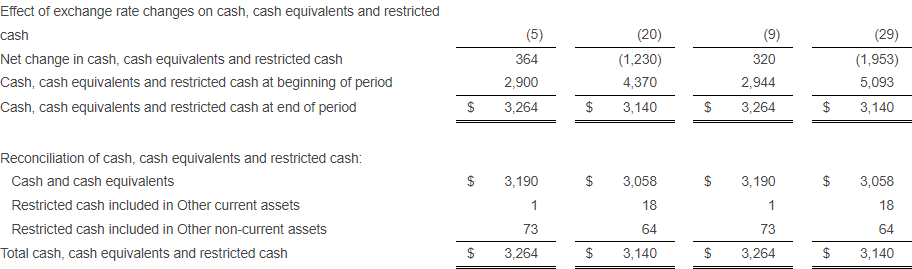
Balance sheet and liquidity remained strong in the third quarter, ending the quarter with $3.2 billion of consolidated cash, with approximately $6.2 billion of total liquidity; reported net debt to adjusted EBITDA of 0.7x7.
Nevada Gold Mines (NGM)6 attributable gold production was 300 thousand ounces, with CAS of $992 per ounce2 and AISC of $1,307 per ounce2 for the third quarter. NGM EBITDA7 was $263 million.
Pueblo Viejo (PV)6 attributable gold production was 52 thousand ounces for the quarter. Cash distributions received for the Company’s equity method investment in Pueblo Viejo totaled $32 million in the third quarter. Capital contributions of $23 million were made during the quarter related to the expansion project at Pueblo Viejo.
- Attributable gold production includes 52 thousand ounces for the third quarter of 2023, 51 thousand ounces for the second quarter of 2023, and 60 thousand ounces for the first quarter of 2023 and 81 thousand ounces for the third quarter of 2022 from the Company’s equity method investment in Pueblo Viejo (40%).
- Non-GAAP measure. See end of this release for reconciliation to Costs applicable to sales.
- Non-GAAP measure. See end of this release for reconciliation to Net income (loss) attributable to Newmont stockholders.
- Capital expenditures refers to Additions to property plant and mine development from the Consolidated Statements of Cash Flows.
- Non-GAAP measure. See end of this release for reconciliation to Net cash provided by operating activities.
- Newmont has a 38.5% interest in Nevada Gold Mines in the U.S., which is accounted for using the proportionate consolidation method. In addition, Newmont has a 40% interest in Pueblo Viejo, which is accounted for as an equity method investment.
- Non-GAAP measure. See end of this release for reconciliation.
Progressing Profitable Near-Term Projects from Unmatched Organic Pipeline
Newmont’s project pipeline supports stable production with improving margins and mine lives1. Newmont’s 2023 and longer-term outlook includes current development capital costs and production related to Tanami Expansion 2, Ahafo North, Pamour and Cerro Negro District Expansion 1. Development capital spend and all metal production for Yanacocha Sulfides has been excluded from longer-term outlook until an investment decision has been reached.
Additional projects not listed below represent incremental improvements to the Company’s outlook.
- Tanami Expansion 2 (Australia) secures Tanami’s future as a long-life, low-cost producer by extending mine life beyond 2040 through the addition of a 1,460 meter hoisting shaft and supporting infrastructure to process 3.3 million tonnes per year and provide a platform for future growth. The expansion is expected to increase average annual gold production by approximately 150,000 to 200,000 ounces per year for the first five years and reduce operating costs by approximately 10 percent, bringing average all-in sustaining costs to $900 to $1,000 per ounce for Tanami (2026-2030). Commercial production for the project is expected in the second half of 2025. Total capital costs are estimated to be between $1.2 and $1.3 billion. Development costs (excluding capitalized interest) since approval were $677 million, of which $178 million related to the nine months ended September 30, 2023.
- Ahafo North (Africa) expands our existing footprint in Ghana with four open pit mines and a stand-alone mill located approximately 30 kilometers from the Company’s Ahafo South operations. The project is expected to add between 275,000 and 325,000 ounces per year with all-in sustaining costs of $800 to $900 per ounce for the first five full years of production. Ahafo North is the best unmined gold deposit in West Africa with approximately 3.8 million ounces of Reserves and 1.4 million ounces of Measured, Indicated and Inferred Resources2 and significant upside potential to extend beyond Ahafo North’s current 13-year mine life. Commercial production for the project is expected in the second half of 2025. Total capital costs are estimated to be between $950 and $1,050 million. Development costs (excluding capitalized interest) since approval were $333 million, of which $121 million related to the nine months ended September 30, 2023.
- Pamour (North America) extends the life of Porcupine and maintains production beyond 2024. The project will optimize mill capacity, adding volume and supporting high grade ore from Borden and Hoyle Pond, while supporting further exploration in a highly prospective and proven mining district. An investment decision was reached in October of 2023, with first ore expected in 2024. Commercial production for the project is expected in the fourth quarter of 2025. Development capital costs are estimated to be between $350 and $450 million.
- Cerro Negro District Expansion 1 (South America) includes the simultaneous development of the Marianas and Eastern districts to extend the mine life of Cerro Negro beyond 2030. The project is expected to improve production and provides a platform for further exploration and future growth through additional expansions. Development capital costs for the project are estimated to be between $350 and $450 million. In the third quarter of 2023 Newmont declared commercial production for San Marcos, the first of six ore bodies associated with the expansion project.
- Yanacocha Sulfides (South America) has been deferred for at least two years from the previously planned investment decision date in 2024, representing the first step to Newmont delivering on its portfolio optimization strategy. Yanacocha Sulfides will develop the first phase of sulfide deposits and an integrated processing circuit, including an autoclave to produce 45% gold, 45% copper and 10% silver. The first phase focuses on developing the Yanacocha Verde and Chaquicocha deposits to extend Yanacocha’s operations beyond 2040 with second and third phases having the potential to extend life for multiple decades.
- Project estimates remain subject to change based upon uncertainties, including future market conditions, macroeconomic and geopolitical conditions, changes in interest rates, inflation, commodities and raw materials prices, supply chain disruptions, labor markets, engineering and mine plan assumptions, future funding decisions, consideration of strategic capital allocation and other factors, which may impact estimated capital expenditures, AISC and timing of projects. See end of this release for cautionary statement regarding forward-looking statements.
- Total resources presented for Ahafo North includes Measured and Indicated resources of 910 thousand gold ounces and Inferred resources of 490 thousand gold ounces. See cautionary statement at the end of this release.
Revised 2023 Outlook Incorporating the Resolution of the Peñasquito Strike
Newmont is providing a revised 2023 outlook for the standalone Newmont portfolio of 5.3 million ounces of attributable production to incorporate the impacts of the Peñasquito strike, lower production from the non-managed Nevada Gold Mines and Pueblo Viejo joint ventures, and lower production at Ahafo due to lower throughput following the decision to operate at less than full capacity to protect one of the grinding mill’s girth gears until it is replaced. As a result of these volume impacts, 2023 CAS is expected to be approximately $1,000 per ounce, with AISC of $1,400 per ounce. In addition, as a result of the Peñasquito strike, the outlook for silver, lead and zinc has been revised for the remainder of the year.
Sustaining capital is expected to be $1.4 billion for 2023, incorporating increased spend from the upgrading of camp conditions at Musselwhite, the addition of five new autonomous haulage trucks at Boddington to advance stripping in the North and South Pits and the replacement conveyor at Ahafo. Development capital is expected to be $1.1 billion for 2023, incorporating reduced spend at Yanacocha Sulfides and the timing of spend at Tanami Expansion 2 as a result of the rainfall event in the first quarter.
Copper guidance for Boddington remains unchanged for the year. In addition, consolidated expense guidance remains unchanged, with the exception of Depreciation and Amortization as a result of the lower production volumes for the year.
Please see the cautionary statement at the end of this release for additional information. For further discussion, investors are encouraged to attend Newmont’s Third Quarter 2023 Earnings Conference Call.
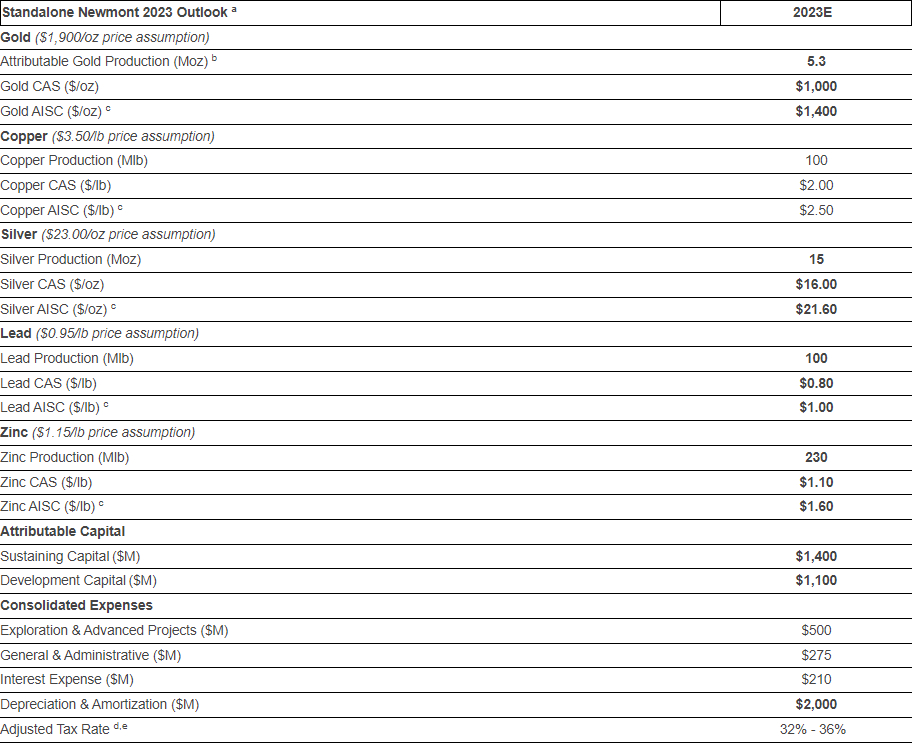
a. 2023 outlook projections are considered forward-looking statements and represent management’s good faith estimates or expectations of future production results as of October 26, 2023, excluding Newcrest Mining Limited. Outlook is based upon certain assumptions, including, but not limited to, metal prices, oil prices, certain exchange rates and other assumptions. For example, revised 2023 Outlook assumes $1,900/oz Au, $3.50/lb Cu, $23.00/oz Ag, $1.15/lb Zn, $0.95/lb Pb, $0.70 AUD/USD exchange rate, $0.75 CAD/USD exchange rate and $80/barrel WTI. Production, CAS, AISC and capital estimates exclude projects that have not yet been approved, except for Cerro Negro District Expansion 1 which is included in Outlook. The potential impact on inventory valuation as a result of lower prices, input costs, and project decisions are not included as part of this Outlook. Assumptions used for purposes of Outlook may prove to be incorrect and actual results may differ from those anticipated, including variation beyond a +/-5% range. Outlook cannot be guaranteed. As such, investors are cautioned not to place undue reliance upon Outlook and forward-looking statements as there can be no assurance that the plans, assumptions or expectations upon which they are placed will occur. Amounts may not recalculate to totals due to rounding. See cautionary statement at the end of this release.
b. Attributable production includes Newmont’s 40% interest in Pueblo Viejo, which is accounted for as an equity method investment.
c. All-in sustaining costs (AISC) as used in the Company’s Outlook is a non-GAAP metric; see below for further information and reconciliation to consolidated 2023 CAS outlook.
d. The adjusted tax rate excludes certain items such as tax valuation allowance adjustments.
e. Assuming average prices of $1,900 per ounce for gold, $3.50 per pound for copper, $23.00 per ounce for silver, $0.95 per pound for lead, and $1.15 per pound for zinc and achievement of current production, sales and cost estimates, we estimate our consolidated adjusted effective tax rate related to continuing operations for 2023 will be between 32%-36%.
- Attributable gold ounces from the Pueblo Viejo mine, an equity method investment, are not included in attributable gold ounces sold.
- For the three months ended September 30, 2023, Peñasquito had no production due to the suspension of operations as a result of the Union labor strike. Sales activity recognized in the third quarter of 2023 is related to adjustments on provisionally priced concentrate sales subject to final settlement. Consequently, price per ounce/pound metrics are not meaningful (“N.M.”).
- The Company recognized amounts attributable to noncontrolling interest for Yanacocha during the period prior to acquiring Sumitomo Corporation’s 5% interest in the second quarter of 2022.
- Represents attributable gold from Pueblo Viejo and does not include the Company’s other equity method investments. Attributable gold ounces produced at Pueblo Viejo are not included in attributable gold ounces sold, as noted in footnote 1. Income and expenses of equity method investments are included in Equity income (loss) of affiliates.
- Non-GAAP measure. See end of this release for reconciliation.
- Excludes Depreciation and amortization and Reclamation and remediation.


- Refer to Note 18 of the Condensed Consolidated Financial Statements for additional information.
Non-GAAP Financial Measures
Non-GAAP financial measures are intended to provide additional information only and do not have any standard meaning prescribed by GAAP. These measures should not be considered in isolation or as a substitute for measures of performance prepared in accordance with GAAP. Refer to Non-GAAP Financial Measures within Part II, Item 7 within our Form 10-K for the year ended December 31, 2022, filed with the SEC on February 23, 2023 for further information on the non-GAAP financial measures presented below, including why management believes that its presentation of non-GAAP financial measures provides useful information to investors.
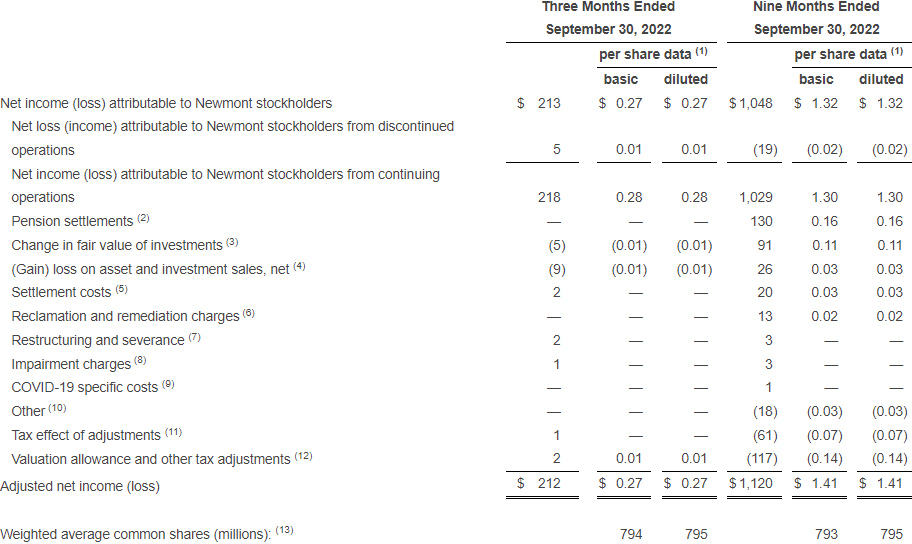
Adjusted net income (loss)
Net income (loss) attributable to Newmont stockholders is reconciled to Adjusted net income (loss) as follows:
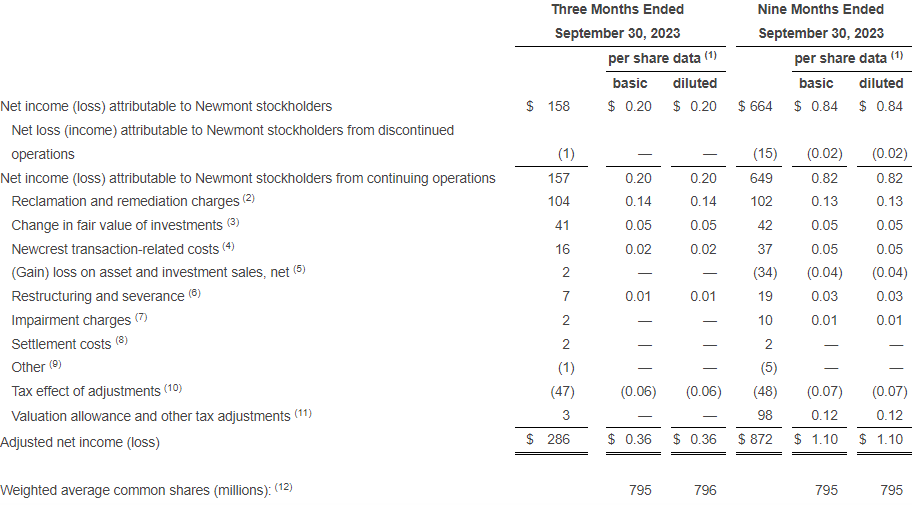
- Per share measures may not recalculate due to rounding.
- Reclamation and remediation charges, included in Reclamation and remediation, represent revisions to reclamation and remediation plans at the Company’s former operating properties and historic mining operations that have entered the closure phase and have no substantive future economic value. Refer to Note 5 of the Condensed Consolidated Financial Statement for further information.
- Change in fair value of investments, included in Other income (loss), net, primarily represents unrealized gains and losses related to the Company’s investment in current and non-current marketable equity securities.
- Newcrest transaction-related costs, included in Other expense, net, primarily represents costs incurred related to the Newcrest transaction. Refer to Note 1 of the Condensed Consolidated Financial Statements for further information.
- (Gain) loss on asset and investment sales, net, included in Other income (loss), net, primarily represents the net gain recognized on the exchange of the previously held Maverix investment for Triple Flag and the subsequent sale of the Triple Flag investment. Refer to Note 11 of the Condensed Consolidated Financial Statements for further information.
- Restructuring and severance, included in Other expense, net, primarily represents severance and related costs associated with significant organizational or operating model changes implemented by the Company.
- Impairment charges, included in Other expense, net, represents non-cash write-downs of various assets that are no longer in use and materials and supplies inventories.
- Settlement costs, included in Other expense, net, are primarily comprised of litigation expenses.
- Other represents income received on the favorable settlement of certain matters that were outstanding at the time of sale of the related investment in 2022. Amounts included in Other income (loss), net.
- The tax effect of adjustments, included in Income and mining tax benefit (expense), represents the tax effect of adjustments in footnotes (2) through (9), as described above, and are calculated using the applicable regional tax rate.
- Valuation allowance and other tax adjustments, included in Income and mining tax benefit (expense), is recorded for items such as foreign tax credits, capital losses, disallowed foreign losses, and the effects of changes in foreign currency exchange rates on deferred tax assets and deferred tax liabilities. The adjustment for the three and nine months ended September 30, 2023 reflects the net increase or (decrease) to net operating losses, capital losses, tax credit carryovers, and other deferred tax assets subject to valuation allowance of $69 and $126, the effects of changes in foreign exchange rates on deferred tax assets and liabilities of $(73) and $(52), net reductions to the reserve for uncertain tax positions of $4 and $18, other tax adjustments of $3 and $6. For further information on reductions to the reserve for uncertain tax positions, refer to Note 8 of the Condensed Consolidated Financial Statements.
- Adjusted net income (loss) per diluted share is calculated using diluted common shares in accordance with GAAP.
- Per share measures may not recalculate due to rounding.
- Pension settlement, included in Other income (loss), net, represent pension settlement charges in 2022 related to the annuitization of certain defined benefit plans. For further information, refer to Note 7 of the Condensed Consolidated Financial Statements.
- Change in fair value of investments, included in Other income (loss), net, primarily represents unrealized gains and losses related to the Company’s investment in current and non-current marketable and other equity securities.
- (Gain) loss on asset and investment sales, included in Other income (loss), net, primarily represents the loss recognized on the sale of the La Zanja equity method investment partially offset by a gain on the sale of a royalty in NGM during the third quarter of 2022. For further information, refer to Note 1 of the Condensed Consolidated Financial Statements.
- Settlement costs, included in Other expense, net, primarily are comprised of legal settlement and a voluntary contribution made to support humanitarian efforts in Ukraine.
- Reclamation and remediation charges, included in Reclamation and remediation, represent revisions to reclamation and remediation plans at the Company’s former operating properties and historic mining operations that have entered the closure phase and have no substantive future economic value. For further information, refer to Note 5 of the Condensed Consolidated Financial Statements.
- Restructuring and severance, included in Other expense, net, primarily represents severance and related costs associated with significant organizational or operating model changes implemented by the Company.
- Impairment charges, included in Other expense, net, represents non-cash write-downs of various assets that are no longer in use and materials and supplies inventories.
- COVID-19 specific costs, included in Other expense, net, primarily include amounts distributed from Newmont Global Community Support Fund to help host communities, governments and employees combat the COVID-19 pandemic.
- Primarily comprised of a reimbursement of certain historical Goldcorp operational expenses related to a legacy project that reached commercial production in the second quarter of 2022, included in Other income (loss), net.
- The tax effect of adjustments, included in Income and mining tax benefit (expense), represents the tax effect of adjustments in footnotes (2) through (10), as described above, and are calculated using the applicable regional tax rate.
- Valuation allowance and other tax adjustments, included in Income and mining tax benefit (expense), is recorded for items such as foreign tax credits, capital losses, disallowed foreign losses, and the effects of changes in foreign currency exchange rates on deferred tax assets and deferred tax liabilities. The adjustment for the three and nine months ended September 30, 2022 reflects the net increase or (decrease) to net operating losses, capital losses, tax credit carryovers, and other deferred tax assets subject to valuation allowance of $19 and $68, the effects of changes in foreign exchange rates on deferred tax assets and liabilities of $(22) and $(48), net reductions to the reserve for uncertain tax positions of $4 and $(13), other tax adjustments of $1 and $1, and a tax settlement in Mexico of $— and $(125). For further information on reductions to the reserve for uncertain tax positions, refer to Note 8 of the Condensed Consolidated Financial Statements.
- Adjusted net income (loss) per diluted share is calculated using diluted common shares in accordance with GAAP.
Earnings before interest, taxes, depreciation and amortization and Adjusted earnings before interest, taxes, depreciation and amortization
Net income (loss) attributable to Newmont stockholders is reconciled to EBITDA and Adjusted EBITDA as follows:
- Reclamation and remediation charges, included in Reclamation and remediation, represent revisions to reclamation and remediation plans at the Company’s former operating properties and historic mining operations that have entered the closure phase and have no substantive future economic value. For further information, refer to Note 5 of the Condensed Consolidated Financial Statements.
- Change in fair value of investments, included in Other income (loss), net, primarily represents unrealized gains and losses related to the Company’s investments in current and non-current marketable equity securities.
- Newcrest transaction-related costs, included in Other expense, net, primarily represents costs incurred related to the Newcrest transaction in 2023. Refer to Note 1 of the Condensed Consolidated Financial Statements for further information.
- (Gain) loss on asset and investment sales, net, included in Other income (loss), net, in 2023 is primarily comprised of the net gain recognized on the exchange of the previously held Maverix investment for Triple Flag and the subsequent sale of the Triple Flag investment. Refer to Note 11 of the Condensed Consolidated Financial Statements for further information. Amounts related to 2022 are primarily comprised of the loss recognized on the sale of the La Zanja equity method investment, partially offset by a gain on the sale of a royalty at NGM in the third quarter of 2022. Refer to Note 1 of the Condensed Consolidated Financial Statements for further information.
- Restructuring and severance, included in Other expense, net, primarily represents severance and related costs associated with significant organizational or operating model changes implemented by the Company for all periods presented.
- Impairment charges, included in Other expense, net, represents non-cash write-downs of various assets that are no longer in use and materials and supplies inventories.
- Settlement costs, included in Other expense, net, are primarily comprised of litigation expenses in 2023 and a legal settlement and a voluntary contribution made to support humanitarian efforts in Ukraine in 2022.
- Pension settlement, included in Other income (loss), net, represents pension settlement charges in 2022 related to the annuitization of certain defined benefit plans. For further information, refer to Note 7 of the Condensed Consolidated Financial Statements.
- COVID-19 specific costs, included in Other expense, net, primarily include amounts distributed from Newmont Global Community Support Fund to help host communities, governments and employees combat the COVID-19 pandemic.
- Other, included in Other income (loss), net,in 2023 represents income received during the first quarter of 2023, on the favorable settlement of certain matters that were outstanding at the time of sale of the related investment in 2022. Amounts related to 2022 are primarily comprised of a reimbursement of certain historical Goldcorp operational expenses related to a legacy project that reached commercial production in the second quarter of 2022.
Income (loss) before income and mining tax and other items is reconciled to Nevada Gold Mines (NGM) EBITDA as follows:
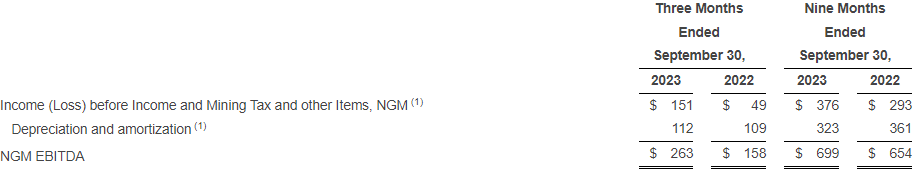
- Refer to Note 3 of the Condensed Consolidated Financial Statements.
Free Cash Flow
The following table sets forth a reconciliation of Free Cash Flow to Net cash provided by (used in) operating activities, which the Company believes to be the GAAP financial measure most directly comparable to Free Cash Flow, as well as information regarding Net cash provided by (used in) investing activities and Net cash provided by (used in) financing activities.
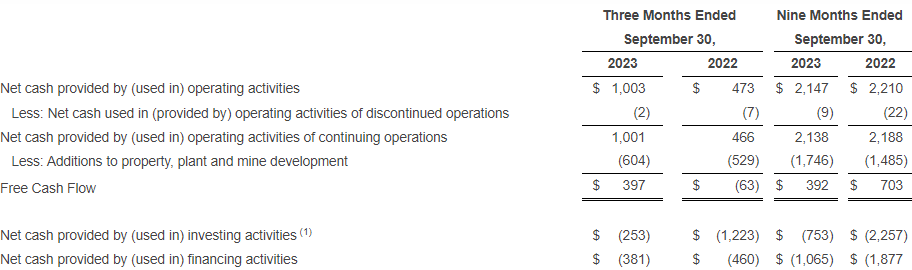
- Net cash provided by (used in) investing activities includes Additions to property, plant and mine development, which is included in the Company’s computation of Free Cash Flow.
Attributable Free Cash Flow
Management uses Attributable Free Cash Flow as a non-GAAP measure to analyze cash flows generated from operations that are attributable to the Company. Attributable Free Cash Flow is Net cash provided by (used in) operating activities after deducting net cash flows from operations attributable to noncontrolling interests less Net cash provided by (used in) operating activities of discontinued operations after deducting net cash flows from discontinued operations attributable to noncontrolling interests less Additions to property, plant and mine development after deducting property, plant and mine development attributable to noncontrolling interests. The Company believes that Attributable Free Cash Flow is useful as one of the bases for comparing the Company’s performance with its competitors. Although Attributable Free Cash Flow and similar measures are frequently used as measures of cash flows generated from operations by other companies, the Company’s calculation of Attributable Free Cash Flow is not necessarily comparable to such other similarly titled captions of other companies.
The presentation of non-GAAP Attributable Free Cash Flow is not meant to be considered in isolation or as an alternative to Net income attributable to Newmont stockholders as an indicator of the Company’s performance, or as an alternative to Net cash provided by (used in) operating activities as a measure of liquidity as those terms are defined by GAAP, and does not necessarily indicate whether cash flows will be sufficient to fund cash needs. The Company’s definition of Attributable Free Cash Flow is limited in that it does not represent residual cash flows available for discretionary expenditures due to the fact that the measure does not deduct the payments required for debt service and other contractual obligations or payments made for business acquisitions. Therefore, the Company believes it is important to view Attributable Free Cash Flow as a measure that provides supplemental information to the Company’s Condensed Consolidated Statements of Cash Flows.
The following tables set forth a reconciliation of Attributable Free Cash Flow, a non-GAAP financial measure, to Net cash provided by (used in) operating activities, which the Company believes to be the GAAP financial measure most directly comparable to Attributable Free Cash Flow, as well as information regarding Net cash provided by (used in) investing activities and Net cash provided by (used in) financing activities.
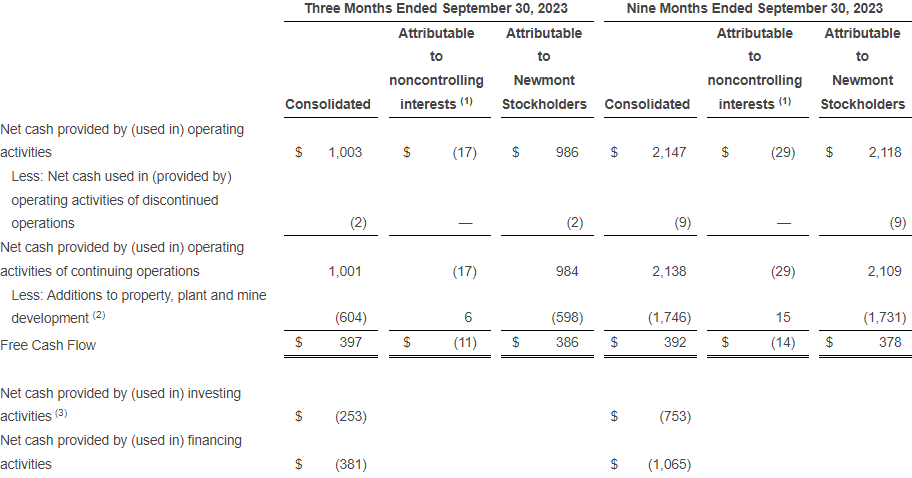
- Adjustment to eliminate a portion of Net cash provided by (used in) operating activities, Net cash provided by (used in) operating activities of discontinued operations and Additions to property, plant and mine development attributable to noncontrolling interests, which relates to Merian (25%).
- For the three months ended September 30, 2023, Merian had total consolidated Additions to property, plant and mine development of $26 on a cash basis. For the nine months ended September 30, 2023, Merian had total consolidated Additions to property, plant and mine development of $60 on a cash basis.
- Net cash provided by (used in) investing activities includes Additions to property, plant and mine development, which is included in the Company’s computation of Free Cash Flow.
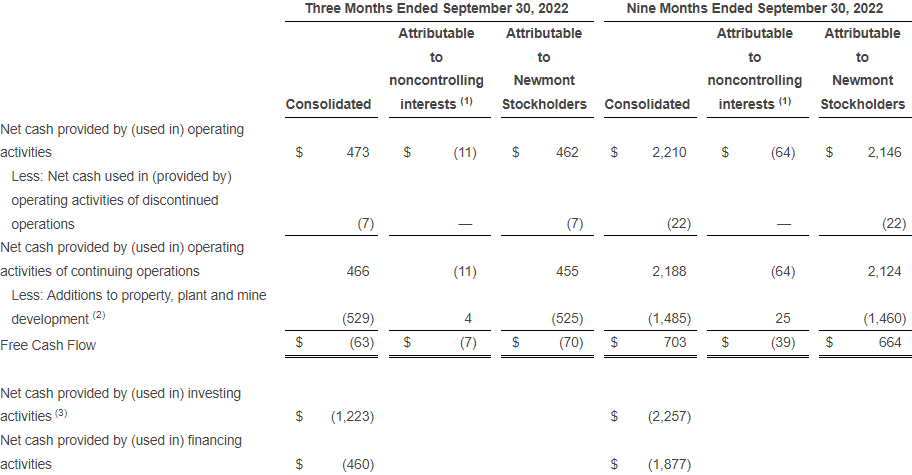
- Adjustment to eliminate a portion of Net cash provided by (used in) operating activities, Net cash provided by (used in) operating activities of discontinued operations and Additions to property, plant and mine development attributable to noncontrolling interests, which relate to Merian (25%) for the three and nine months ended September 30, 2022, and Yanacocha (5%) for the nine months ended September 30, 2022.
- For the three months ended September 30, 2022, Yanacocha and Merian had total consolidated Additions to property, plant and mine development of $86 and $14, respectively, on a cash basis. For the nine months ended September 30, 2022, Yanacocha and Merian had total consolidated Additions to property, plant and mine development of $237 and $37, respectively, on a cash basis.
- Net cash provided by (used in) investing activities includes Additions to property, plant and mine development, which is included in the Company’s computation of Free Cash Flow.
Net Debt
Net Debt is calculated as Debt and Lease and other financing obligations less Cash and cash equivalents and time deposits included in Time deposits and other investments, as presented on the Condensed Consolidated Balance Sheets. Cash and cash equivalents and time deposits are subtracted from Debt and Lease and other financing obligations as these are highly liquid, low-risk investments and could be used to reduce the Company’s debt obligations.
The following table sets forth a reconciliation of Net Debt, a non-GAAP financial measure, to Debt and Lease and other financing obligations, which the Company believes to be the GAAP financial measures most directly comparable to Net Debt.
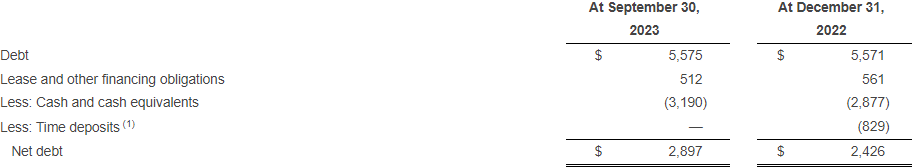
- Time deposits are included in Time deposits and other investments on the Condensed Consolidated Balance Sheets. Refer to Note 11 of the Condensed Consolidated Financial Statements for further information.
Costs applicable to sales per ounce/gold equivalent ounce
Costs applicable to sales per ounce/gold equivalent ounce are calculated by dividing the costs applicable to sales of gold and other metals by gold ounces or gold equivalent ounces sold, respectively. These measures are calculated for the periods presented on a consolidated basis.
The following tables reconcile these non-GAAP measures to the most directly comparable GAAP measures.
Costs applicable to sales per gold ounce
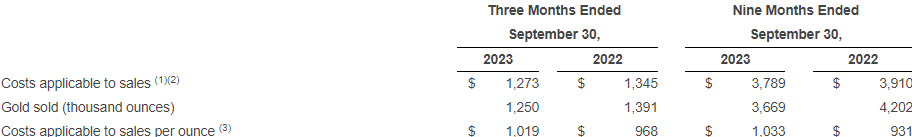
- Includes by-product credits of $28 and $22 during the three months ended September 30, 2023 and 2022, respectively, and $86 and $75 during the nine months ended September 30, 2023 and 2022, respectively.
- Excludes Depreciation and amortization and Reclamation and remediation.
- Per ounce measures may not recalculate due to rounding.
Costs applicable to sales per gold equivalent ounce
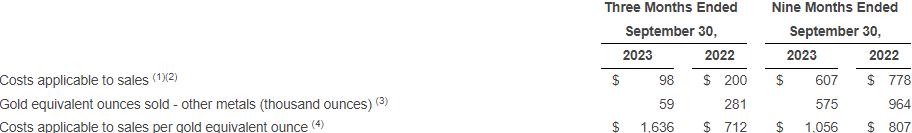
- Includes by-product credits of $1 and $2 during the three months ended September 30, 2023 and 2022, respectively, and $5 and $6 during the nine months ended September 30, 2023 and 2022, respectively.
- Excludes Depreciation and amortization and Reclamation and remediation.
- Gold equivalent ounces is calculated as pounds or ounces produced multiplied by the ratio of the other metals price to the gold price, using Gold ($1,400/oz.), Copper ($3.50/lb.), Silver ($20.00/oz.), Lead ($1.00/lb.) and Zinc ($1.20/lb.) pricing for 2023 and Gold ($1,200/oz.), Copper ($3.25/lb.), Silver ($23.00/oz.), Lead ($0.95/lb.) and Zinc ($1.15/lb.) pricing for 2022.
- Per ounce measures may not recalculate due to rounding.
Costs applicable to sales per gold ounce for Nevada Gold Mines (NGM)
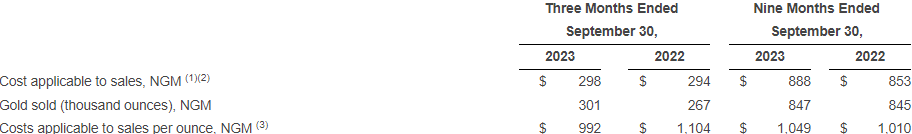
- See Note 3 to the Condensed Consolidated Financial Statements.
- Excludes Depreciation and amortization and Reclamation and remediation.
- Per ounce measures may not recalculate due to rounding.
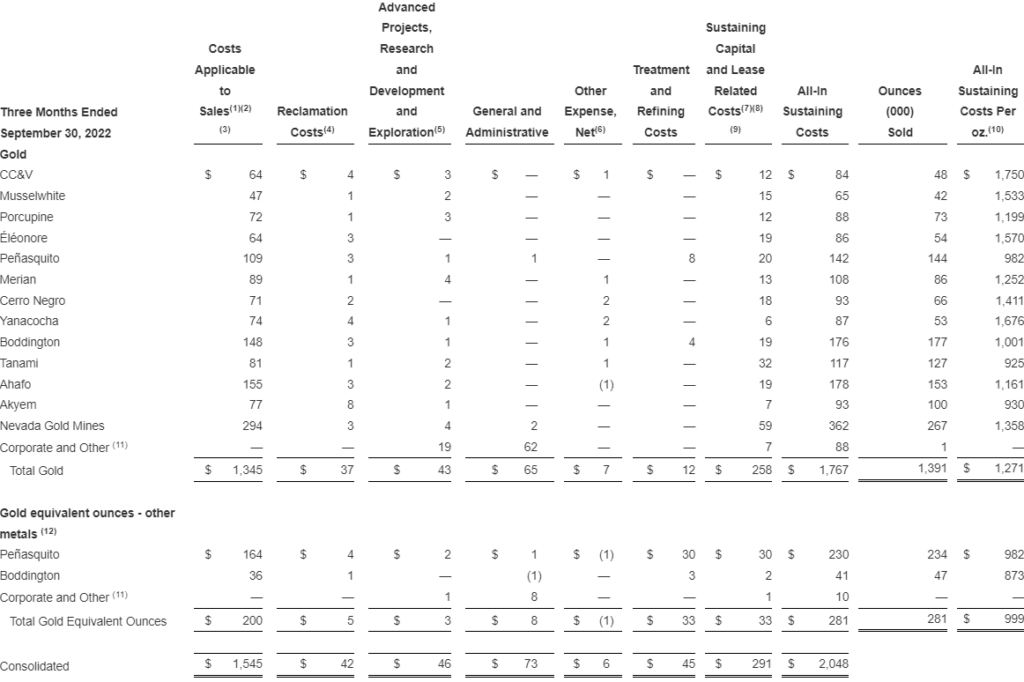
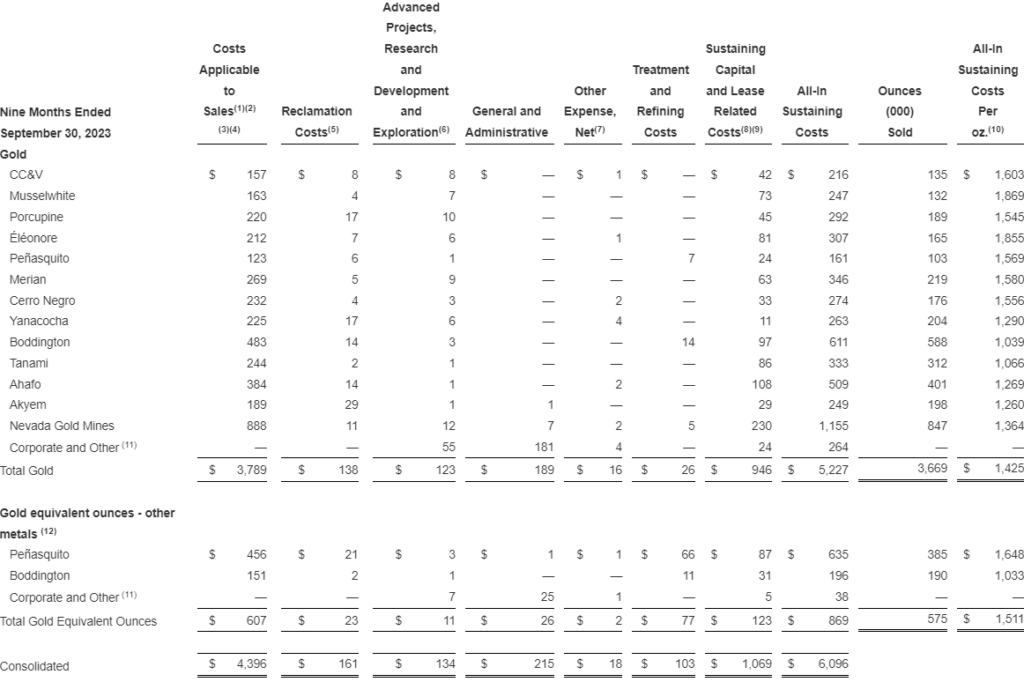
All-In Sustaining Costs
All-in sustaining costs represent the sum of certain costs, recognized as GAAP financial measures, that management considers to be associated with production. All-in sustaining costs per ounce amounts are calculated by dividing all-in sustaining costs by gold ounces or gold equivalent ounces sold.
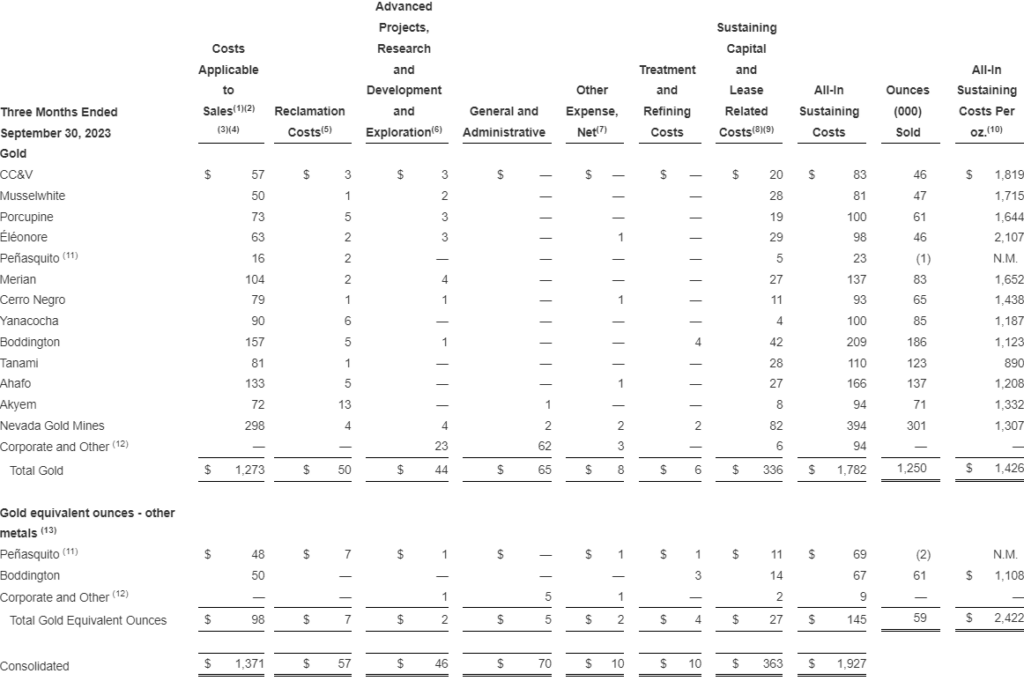
- Excludes Depreciation and amortization and Reclamation and remediation.
- Includes by-product credits of $29 and excludes co-product revenues of $93.
- Includes stockpile, leach pad, and product inventory adjustments of $1 at Porcupine, $2 at Peñasquito, and $2 at NGM.
- Beginning January 1, 2023, COVID-19 specific costs incurred in the ordinary course of business are recognized in Costs applicable to sales.
- Reclamation costs include operating accretion and amortization of asset retirement costs of $25 and $32, respectively, and exclude accretion and reclamation and remediation adjustments at former operating properties that have entered the closure phase and have no substantive future economic value of $37 and $104, respectively.
- Advanced projects, research and development and exploration excludes development expenditures of $1 at CC&V, $2 at Porcupine $2 at Peñasquito, $5 at Merian, $2 at Cerro Negro, $7 at Tanami, $12 at Ahafo, $6 at Akyem, $4 at NGM, and $44 at Corporate and Other, totaling $85 related to developing new operations or major projects at existing operations where these projects will materially benefit the operation.
- Other expense, net is adjusted for Newcrest transaction-related costs of $16, restructuring and severance of $7, impairment charges of $2, settlement costs of $2.
- Excludes capitalized interest related to sustaining capital expenditures. See Liquidity and Capital Resources within Part I, Item 2, Management’s Discussion and Analysis for capital expenditures by segment.
- Includes finance lease payments and other costs for sustaining projects of $17.
- Per ounce measures may not recalculate due to rounding.
- For the three months ended September 30, 2023, Peñasquito had no production due to the Peñasquito labor strike. Sales activity recognized in the third quarter of 2023 at Peñasquito is related to adjustments on provisionally priced concentrate sales subject to final settlement. As such, the per ounce metrics are not meaningful (“N.M.”) for the current quarter.
- Corporate and Other includes the Company’s business activities relating to its corporate and regional offices and all equity method investments. Refer to Note 3 of the Condensed Consolidated Financial Statements for further information.
- Gold equivalent ounces is calculated as pounds or ounces produced multiplied by the ratio of the other metals price to the gold price, using Gold ($1,400/oz.), Copper ($3.50/lb.), Silver ($20.00/oz.), Lead ($1.00/lb.) and Zinc ($1.20/lb.) pricing for 2023.
- Excludes Depreciation and amortization and Reclamation and remediation.
- Includes by-product credits of $24 and excludes co-product revenues of $284.
- Includes stockpile and leach pad inventory adjustments of $11 at CC&V, $13 at Yanacocha, $2 at Akyem, and $21 at NGM.
- Reclamation costs include operating accretion and amortization of asset retirement costs of $17 and $25, respectively, and exclude accretion and reclamation and remediation adjustments at former operating properties that have entered the closure phase and have no substantive future economic value of $28 and $8, respectively.
- Advanced projects, research and development and exploration excludes development expenditures of $1 at Porcupine, $2 at Peñasquito, $4 at Yanacocha, $4 at Merian, $8 at Cerro Negro, $6 at Tanami, $5 at Ahafo, $3 at Akyem, $5 at NGM and $65 at Corporate and Other, totaling $103 related to developing new operations or major projects at existing operations where these projects will materially benefit the operation.
- Other expense, net is adjusted for settlement costs of $2, restructuring and severance costs of $2, and impairment charges of $1.
- Includes sustaining capital expenditures of $276. See Liquidity and Capital Resources within Part I, Item 2, Management’s Discussion and Analysis for sustaining capital expenditures by segment.
- Excludes development capital expenditures, capitalized interest and the change in accrued capital totaling $253. See Liquidity and Capital Resources within Part I, Item 2, Management’s Discussion and Analysis for discussion of major development projects.
- Includes finance lease payments for sustaining projects of $15.
- Per ounce measures may not recalculate due to rounding.
- Corporate and Other includes the Company’s business activities relating to its corporate and regional offices and all equity method investments. Refer to Note 3 of the Condensed Consolidated Financial Statements for further information.
- Gold equivalent ounces is calculated as pounds or ounces produced multiplied by the ratio of the other metals price to the gold price, using Gold ($1,200/oz.), Copper ($3.25/lb.), Silver ($23.00/oz.), Lead ($0.95/lb.) and Zinc ($1.15/lb.) pricing for 2022.
- Excludes Depreciation and amortization and Reclamation and remediation.
- Includes by-product credits of $91 and excludes co-product revenues of $772.
- Includes stockpile, leach pad, and product inventory adjustments of $3 at Porcupine, $5 at Éléonore, $19 at Peñasquito, $2 at Cerro Negro, $4 at Yanacocha, $1 at Akyem, and $4 at NGM.
- Beginning January 1, 2023, COVID-19 specific costs incurred in the ordinary course of business are recognized in Costs applicable to sales.
- Reclamation costs include operating accretion and amortization of asset retirement costs of $74 and $87, respectively, and exclude accretion and reclamation and remediation adjustments at former operating properties that have entered the closure phase and have no substantive future economic value of $111 and $113, respectively.
- Advanced projects, research and development and exploration excludes development expenditures of $2 at CC&V, $5 at Porcupine, $5 at Peñasquito, $8 at Merian, $3 at Cerro Negro, $3 at Yanacocha, $19 at Tanami, $27 at Ahafo, $13 at Akyem, $13 at NGM, and $92 at Corporate and Other, totaling $190 related to developing new operations or major projects at existing operations where these projects will materially benefit the operation.
- Other expense, net is adjusted for Newcrest transaction-related costs of $37, restructuring and severance of $19, impairment charges of $10, and settlement costs of $2.
- Excludes capitalized interest related to sustaining capital expenditures. See Liquidity and Capital Resources within Part I, Item 2, Management’s Discussion and Analysis for capital expenditures by segment.
- Includes finance lease payments and other costs for sustaining projects of $55.
- Per ounce measures may not recalculate due to rounding.
- Corporate and Other includes the Company’s business activities relating to its corporate and regional offices and all equity method investments. Refer to Note 3 of the Condensed Consolidated Financial Statements for further information.
- Gold equivalent ounces is calculated as pounds or ounces produced multiplied by the ratio of the other metals price to the gold price, using Gold ($1,400/oz.), Copper ($3.50/lb.), Silver ($20.00/oz.), Lead ($1.00/lb.) and Zinc ($1.20/lb.) pricing for 2023.

- Excludes Depreciation and amortization and Reclamation and remediation.
- Includes by-product credits of $81 and excludes co-product revenues of $1,129.
- Includes stockpile and leach pad inventory adjustments of $18 at CC&V, $13 at Yanacocha, $3 at Merian, $2 at Akyem, and $49 at NGM.
- Reclamation costs include operating accretion and amortization of asset retirement costs of $49 and $74, respectively, and exclude accretion and reclamation and remediation adjustments at former operating properties that have entered the closure phase and have no substantive future economic value of $85 and $29, respectively.
- Advanced projects, research and development and exploration excludes development expenditures of $1 at CC&V, $2 at Porcupine, $5 at Peñasquito, $8 at Yanacocha, $8 at Merian, $14 at Cerro Negro, $15 at Tanami, $15 at Ahafo, $10 at Akyem, $13 at NGM and $107 at Corporate and Other, totaling $198 related to developing new operations or major projects at existing operations where these projects will materially benefit the operation.
- Other expense, net is adjusted for settlement costs of $20, impairment charges of $3, restructuring and severance costs of $3 and distributions from the Newmont Global Community Support Fund of $1.
- Includes sustaining capital expenditures of $752. See Liquidity and Capital Resources within Part I, Item 2, Management’s Decision and Analysis for sustaining capital expenditures by segment.
- Excludes development capital expenditures, capitalized interest and the change in accrued capital totaling $733. See Liquidity and Capital Resources within Part I, Item 2, Management’s Discussion and Analysis for discussion of major development projects.
- Includes finance lease payments for sustaining projects of $48.
- Per ounce measures may not recalculate due to rounding.
- Costs applicable to sales includes $70 related to the Peñasquito Profit-Sharing Agreement regarding 2021 site performance. For further information, refer to Note 3 of the Condensed Consolidated Financial Statements.
- Corporate and Other includes the Company’s business activities relating to its corporate and regional offices and all equity method investments. Refer to Note 3 of the Condensed Consolidated Financial Statements for further information.
- Gold equivalent ounces is calculated as pounds or ounces produced multiplied by the ratio of the other metals price to the gold price, using Gold ($1,200/oz.), Copper ($3.25/lb.), Silver ($23.00/oz.), Lead ($0.95/lb.) and Zinc ($1.15/lb.) pricing for 2022.
A reconciliation of the 2023 Gold AISC outlook to the 2023 Gold CAS outlook is provided below. The estimates in the table below are considered “forward-looking statements” within the meaning of Section 27A of the Securities Act of 1933, as amended, and Section 21E of the Securities Exchange Act of 1934, as amended, which are intended to be covered by the safe harbor created by such sections and other applicable laws.
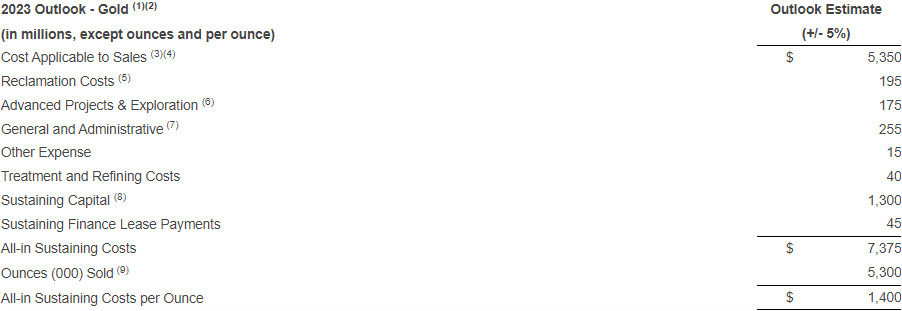
- The reconciliation is provided for illustrative purposes in order to better describe management’s estimates of the components of the calculation. Estimates for each component of the forward-looking All-in sustaining costs per ounce are independently calculated and, as a result, the total All-in sustaining costs and the All-in sustaining costs per ounce may not sum to the component ranges. While a reconciliation to the most directly comparable GAAP measure has been provided for the 2023 AISC Gold Outlook on a consolidated basis, a reconciliation has not been provided on an individual site or project basis in reliance on Item 10(e)(1)(i)(B) of Regulation S-K because such reconciliation is not available without unreasonable efforts.
- All values are presented on a consolidated basis for Newmont.
- Excludes Depreciation and amortization and Reclamation and remediation.
- Includes stockpile and leach pad inventory adjustments.
- Reclamation costs include operating accretion and amortization of asset retirement costs.
- Advanced Project and Exploration excludes non-sustaining advanced projects and exploration.
- Includes stock based compensation.
- Excludes development capital expenditures, capitalized interest and change in accrued capital.
- Consolidated production for Merian is presented on a total production basis for the mine site and excludes production from Pueblo Viejo.
Net debt to Adjusted EBITDA ratio
Management uses net debt to Adjusted EBITDA as non-GAAP measures to evaluate the Company’s operating performance, including our ability to generate earnings sufficient to service our debt. Net debt to Adjusted EBITDA represents the ratio of the Company’s debt, net of cash and cash equivalents and time deposits, to Adjusted EBITDA. Net debt to Adjusted EBITDA does not represent, and should not be considered an alternative to, net income (loss), operating income (loss), or cash flow from operations as those terms are defined by GAAP, and does not necessarily indicate whether cash flows will be sufficient to fund cash needs. Although Net Debt to Adjusted EBITDA and similar measures are frequently used as measures of operations and the ability to meet debt service requirements by other companies, our calculation of net debt to Adjusted EBITDA measure is not necessarily comparable to such other similarly titled captions of other companies. The Company believes that net debt to Adjusted EBITDA provides useful information to investors and others in understanding and evaluating our operating results in the same manner as our management and Board of Directors. Management’s determination of the components of net debt to Adjusted EBITDA is evaluated periodically and based, in part, on a review of non-GAAP financial measures used by mining industry analysts. Net income (loss) attributable to Newmont stockholders is reconciled to Adjusted EBITDA as follows:
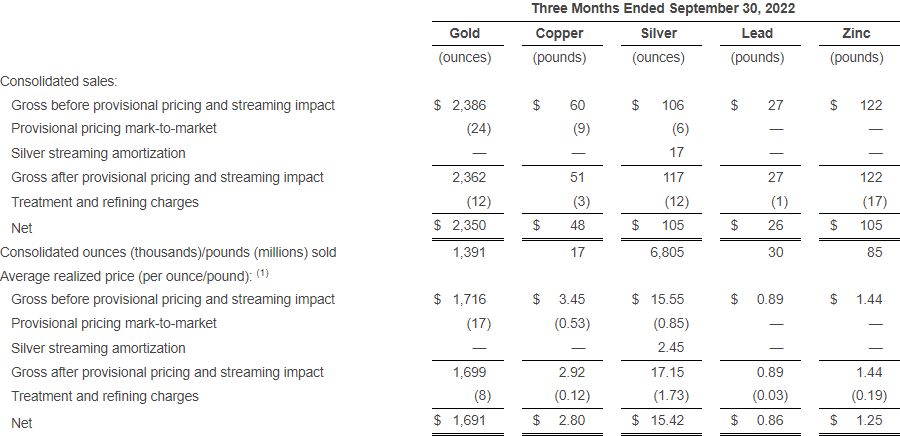
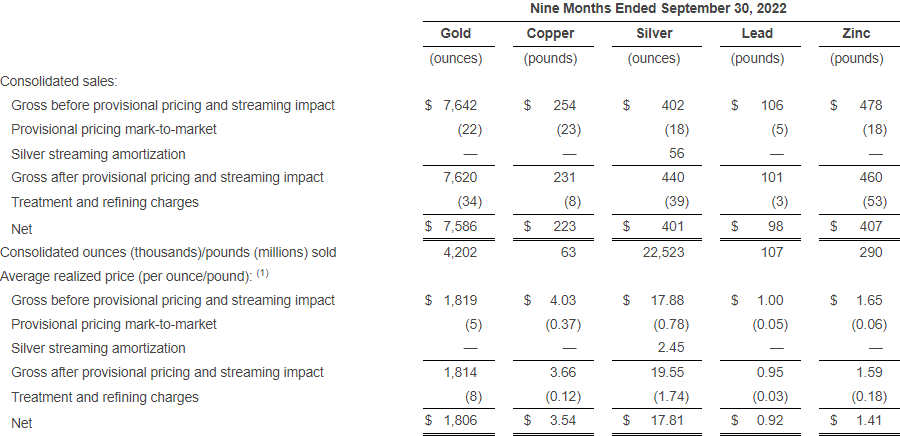
Net average realized price per ounce/pound
Average realized price per ounce/ pound are non-GAAP financial measures. The measures are calculated by dividing the net consolidated gold, copper, silver, lead and zinc sales by the consolidated gold ounces, copper pounds, silver ounces, lead pounds and zinc pounds sold, respectively. These measures are calculated on a consistent basis for the periods presented on a consolidated basis. Average realized price per ounce/ pound statistics are intended to provide additional information only, do not have any standardized meaning prescribed by GAAP and should not be considered in isolation or as a substitute for measures of performance prepared in accordance with GAAP. The measures are not necessarily indicative of operating profit or cash flow from operations as determined under GAAP. Other companies may calculate these measures differently.
The following tables reconcile these non-GAAP measures to the most directly comparable GAAP measure:
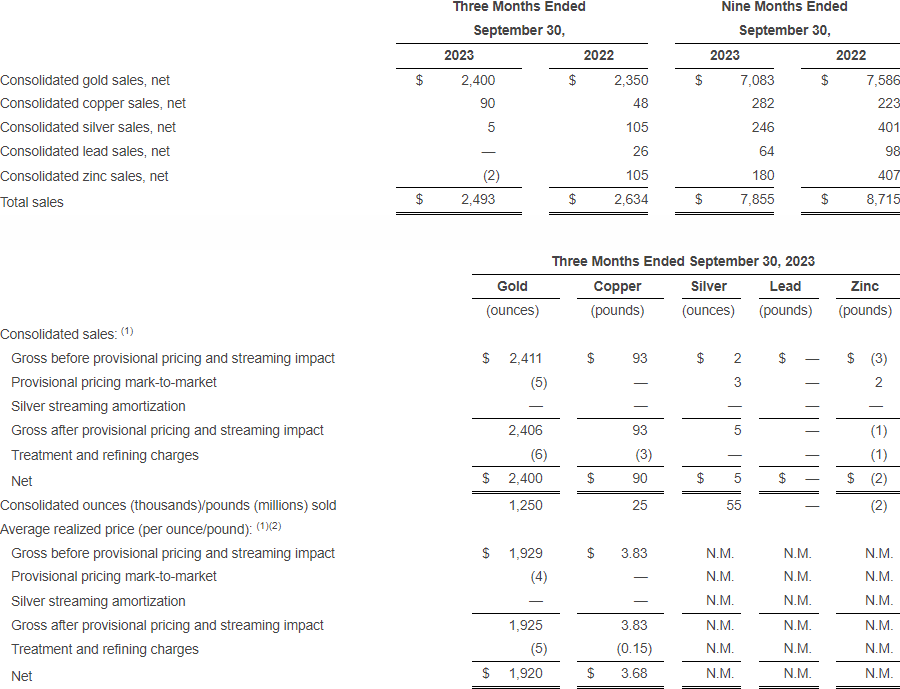
- Due to the Peñasquito labor strike, Peñasquito had no production during the third quarter of 2023. Sales activity recognized in the third quarter of 2023 is related to adjustments on provisionally priced concentrate sales subject to final settlement. As such, the average realized price per ounce/pound metrics are not meaningful (“N.M.”).
- Per ounce/pound measures may not recalculate due to rounding.
- Per ounce/pound measures may not recalculate due to rounding.

- Per ounce/pound measures may not recalculate due to rounding.
- Per ounce/pound measures may not recalculate due to rounding.
Gold by-product metrics
Copper, silver, lead and zinc are by-products often obtained during the process of extracting and processing the primary ore-body. In our GAAP Condensed Consolidated Financial Statements, the value of these by-products is recorded as a credit to our CAS and the value of the primary ore is recorded as Sales. In certain instances, copper, silver, lead and zinc are co-products, or a significant resource in the primary ore-body, and the revenue is recorded as Sales in our GAAP Condensed Consolidated Financial Statements.
Gold by-product metrics are non-GAAP financial measures that serve as a basis for comparing the Company’s performance with certain competitors. As Newmont’s operations are primarily focused on gold production, “Gold by-product metrics” were developed to allow investors to view Sales, CAS per ounce and AISC per ounce calculations that classify all copper, silver, lead and zinc production as a by-product, even when copper, silver, lead or zinc is a significant resource in the primary ore-body. These metrics are calculated by subtracting copper, silver, lead and zinc sales recognized from Sales and including these amounts as offsets to CAS.
Gold by-product metrics are calculated on a consistent basis for the periods presented on a consolidated basis. These metrics are intended to provide supplemental information only, do not have any standardized meaning prescribed by GAAP and should not be considered in isolation or as a substitute for measures of performance prepared in accordance with GAAP. Other companies may calculate these measures differently as a result of differences in the underlying accounting principles, policies applied and in accounting frameworks, such as in IFRS.
The following tables reconcile these non-GAAP measures to the most directly comparable GAAP measures:
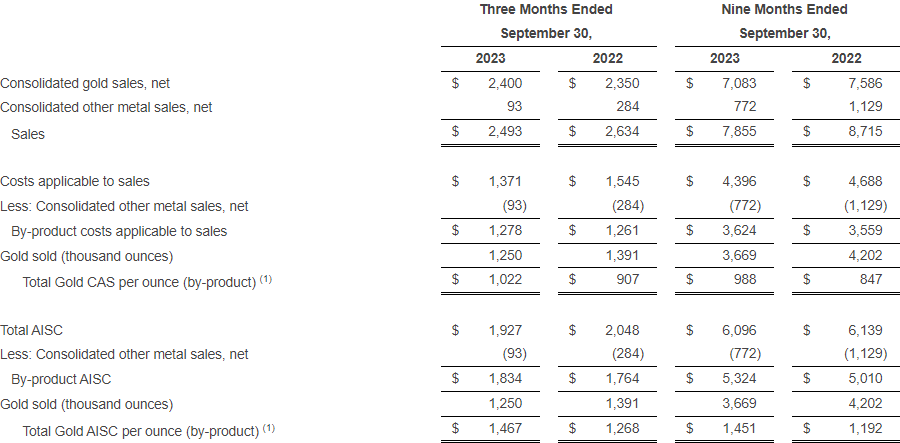
- Per ounce/pound measures may not recalculate due to rounding.
Conference Call Information
A conference call will be held on Thursday, October 26, 2023 at 10:00 a.m. Eastern Time (8:00 a.m. Mountain Time); it will also be carried on the Company’s website.
Conference Call Details
| Dial-In Number | 833.470.1428 | |
| Intl. Dial-In Number | 404.975.48391 | |
| Dial-In Access Code | 570192 | |
| Conference Name | Newmont | |
| Replay Number | 866.813.9403 | |
| Intl. Replay Number | 929.458.6194 | |
| Replay Access Code | 901520 |
Webcast Details
Title: Newmont Third Quarter 2023 Earnings Conference Call
URL: https://events.q4inc.com/attendee/362063644
The third quarter 2023 results will be available before the market opens on Thursday, October 26, 2023, on the “Investor Relations” section of the Company’s website, www.newmont.com. Additionally, the conference call will be archived for a limited time on the Company’s website.
- For toll-free phone numbers, refer to the following link: https://www.netroadshow.com/events/global-numbers?confId=49005
About Newmont
Newmont is the world’s leading gold company and a producer of copper, silver, lead and zinc. The Company’s world-class portfolio of assets, prospects and talent is anchored in favorable mining jurisdictions in North America, South America, Australia and Africa. Newmont is the only gold producer listed in the S&P 500 Index and is widely recognized for its principled environmental, social and governance practices. The Company is an industry leader in value creation, supported by robust safety standards, superior execution and technical expertise. Newmont was founded in 1921 and has been publicly traded since 1925.
Cautionary Statement Regarding Forward Looking Statements, Including Outlook Assumptions:
This news release contains “forward-looking statements” within the meaning of Section 27A of the Securities Act of 1933, as amended, and Section 21E of the Securities Exchange Act of 1934, as amended, which are intended to be covered by the safe harbor created by such sections and other applicable laws and “forward-looking information” within the meaning of applicable Australian securities laws. Where a forward-looking statement expresses or implies an expectation or belief as to future events or results, such expectation or belief is expressed in good faith and believed to have a reasonable basis. However, such statements are subject to risks, uncertainties and other factors, which could cause actual results to differ materially from future results expressed, projected or implied by the forward-looking statements. Forward-looking statements often address our expected future business and financial performance and financial condition; and often contain words such as “anticipate,” “intend,” “plan,” “will,” “would,” “estimate,” “expect,” “believe,” “pending” or “potential.” Forward-looking statements in this news release may include, without limitation, (i) estimates of future production and sales, including production outlook, average future production and upside potential; (ii) estimates of future costs applicable to sales and all-in sustaining costs; (iii) estimates of future capital expenditures, including development and sustaining capital; (iv) expectations regarding the Tanami Expansion 2, Ahafo North, Yanacocha Sulfides, Pamour and Cerro Negro District Expansion 1 projects, including, without limitation, expectations for production, milling, costs applicable to sales and all-in sustaining costs, capital costs, mine life extension, construction completion, commercial production, and other timelines; (v) future expectations regarding sites with recently restarted operations, including Peñasquito; (vi) expectations regarding future investments or divestitures; (vii) expectations regarding free cash flow and returns to stockholders, including with respect to future dividends, the dividend framework and expected payout levels; (viii) expectations regarding future mineralization, including, without limitation, expectations regarding reserves and recoveries; (ix) other outlook; and (x) expectations regarding pending or proposed transactions, including statements relating to the pending acquisition of Newcrest, such as the expected timing and implementation of the pending transaction and satisfaction of customary closing conditions. Estimates or expectations of future events or results are based upon certain assumptions, which may prove to be incorrect. Such assumptions, include, but are not limited to: (i) there being no significant change to current geotechnical, metallurgical, hydrological and other physical conditions; (ii) permitting, development, operations and expansion of operations and projects being consistent with current expectations and mine plans; (iii) political developments in any jurisdiction in which the Company operates being consistent with its current expectations; (iv) certain exchange rate assumptions; (v) certain price assumptions for gold, copper, silver, zinc, lead and oil; (vi) prices for key supplies; (vii) the accuracy of current mineral reserve and mineralized material estimates; and (viii) other planning assumptions. Uncertainties include those relating to general macroeconomic uncertainty and changing market conditions, changing restrictions on the mining industry in the jurisdictions in which we operate, impacts to supply chain, including price, availability of goods, ability to receive supplies and fuel, and impacts of changes in interest rates. Such uncertainties could result in operating sites being placed into care and maintenance and impact estimates, costs and timing of projects. Uncertainties in geopolitical conditions could impact certain planning assumptions, including, but not limited to commodity and currency prices, costs and supply chain availabilities. Investors are reminded that the dividend framework is non-binding and the 2023 dividend payout range does not represent a legal commitment. Future dividends beyond the dividend payable on December 22, 2023 to holders of record at the close of business on November 30, 2023 have not yet been approved or declared by the Board of Directors, and an annualized dividend payout or dividend yield has not been declared by the Board. Management’s expectations with respect to future dividends are “forward-looking statements” and the Company’s dividend framework is non-binding. The declaration and payment of future dividends remain at the discretion of the Board of Directors and will be determined based on Newmont’s financial results, balance sheet strength, cash and liquidity requirements, future prospects, gold and commodity prices, and other factors deemed relevant by the Board. Risks relating to forward-looking statements in regard to the pending acquisition of Newcrest and the combined company may include, but are not limited to, fluctuations in company stock price and results of operations; the prompt and effective integration of Newmont’s and Newcrest’s businesses and the ability to achieve the anticipated synergies and value-creation contemplated by the pending transaction; the risk associated with the timing of the implementation of the pending transaction, including the risk that the pending transaction fails to be implemented for any reason; the outcome of any legal proceedings that have been or may be instituted against the parties and others related to the scheme implementation deed dated May 15, 2023, as amended from time to time (the “Scheme Implementation Deed”); unanticipated difficulties or expenditures relating to the pending transaction, the response of business partners and retention as a result of the announcement and pendency of the transaction; risks relating to the value of the scheme consideration to be issued in connection with the pending transaction; the anticipated size of the markets and continued demand for Newmont’s and Newcrest’s resources and the impact of competitive responses to the announcement of the transaction; and the diversion of management time on pending transaction-related issues. For a more detailed discussion of such risks, see the Company’s Annual Report on Form 10-K for the year ended December 31, 2022 filed with the U.S. Securities and Exchange Commission (the “SEC”) on February 23, 2023, as updated by the current report on Form 8-K, filed with the SEC on July 20, 2023, as well as Newmont’s other SEC filings, including the definitive proxy statement, filed with the SEC on September 5, 2023, under the heading “Risk Factors”, and other factors identified in the Company’s reports filed with the SEC, available on the SEC website or www.newmont.com. The Company does not undertake any obligation to release publicly revisions to any “forward-looking statement,” including, without limitation, outlook, to reflect events or circumstances after the date of this news release, or to reflect the occurrence of unanticipated events, except as may be required under applicable securities laws. Investors should not assume that any lack of update to a previously issued “forward-looking statement” constitutes a reaffirmation of that statement. Continued reliance on “forward-looking statements” is at investors’ own risk.
Notice Regarding Reserve and Resource Estimates:
Unless otherwise stated herein, the reserves stated in this release represent estimates at December 31, 2022, which could be economically and legally extracted or produced at the time of the reserve determination. Estimates of proven and probable reserves are subject to considerable uncertainty. Such estimates are, or will be, to a large extent, based on metal prices and interpretations of geologic data obtained from drill holes and other exploration techniques, which data may not necessarily be indicative of future results. Additionally, resource does not indicate proven and probable reserves as defined by the SEC or the Company’s standards. Estimates of measured, indicated and inferred resource are subject to further exploration and development, and are, therefore, subject to considerable uncertainty. Inferred resources, in particular, have a great amount of uncertainty as to their existence and their economic and legal feasibility. The Company cannot be certain that any part or parts of the resource will ever be converted into reserves. For additional information on our reserves and resources, please see Item 2 of the Company’s Form 10-K, filed on February 23, 2023 with the SEC, as updated by the current report on Form 8-K, filed with the SEC on July 20, 2023.
Contacts
Media Contact
Jennifer Pakradooni
720.236.8170
[email protected]
Investor Contact – North America
Daniel Horton
303.837.5468
[email protected]
Investor Contact – Asia Pacific
Christopher Maitland
+61 499.082.360
[email protected]
Original Article: https://www.businesswire.com/news/home/20231026893832/en/


