DENVER–(BUSINESS WIRE)– Newmont Corporation (NYSE: NEM, TSX: NGT) reported gold Mineral Reserves (reserves) of 92.8 million attributable ounces for 2021 compared to the Company’s 94.2 million ounces at the end of 2020. Newmont has significant upside to other metals, including more than 15 billion pounds of copper reserves and nearly 600 million ounces of silver reserves. In addition, reserves and resources were further strengthened with the purchase of Buenaventura’s 43.65% interest in Minera Yanacocha in February 2022, adding 2.7 million ounces of gold reserves, 11.0 million gold resources, 700 million pounds of copper reserves and 2.6 billion copper resources.1
This press release features multimedia. View the full release here: https://www.businesswire.com/news/home/20220223006208/en/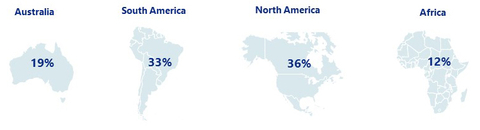
PERCENTAGE OF GOLD RESERVES BY JURISDICTION
“Newmont’s world-class portfolio of operations and projects is underpinned by a robust foundation of reserves and resources, along with the most extensive exploration program in the industry,” said Tom Palmer, President and CEO. “In 2021, more than 80 percent of depletion was replaced as we continue to progress our most profitable greenfield and near-mine projects. Exploration continues to be a core competency at Newmont with a focus on extending mine life, developing districts, and discovering new opportunities in the most favorable jurisdictions.”
KEY HIGHLIGHTS AND DIFFERENTIATORS:
- Robust gold Mineral Reserves of 92.8 million ounces
- Over 90 percent of gold reserves in top-tier jurisdictions
- Addition of 6.5 million ounces in 2021 primarily through drilling
- Gold reserve life at operating sites of 10 years or more, underpinned by a strong base at Boddington, Tanami, Ahafo, Yanacocha, Peñasquito, and Nevada Gold Mines (NGM), and further enhanced from our seven other operating mines and equity ownership in Pueblo Viejo
- Significant gold reserves per share with 120 ounces per 1,000 shares, including the purchase of Buenaventura’s interest in Minera Yanacocha
- Measured & Indicated gold Mineral Resources of 68.3 million ounces and Inferred of 33.2 million ounces
- Significant exposure to copper with 15.1 billion pounds in reserves, 17.8 billion pounds in Measured & Indicated resources and 8.6 billion pounds in Inferred resources
- Additional exposure to other metals such as silver, zinc, and lead mainly at Peñasquito
- Announced the acquisition of Buenaventura’s 43.65% interest in Minera Yanacocha in February 2022; further enhancing world-class asset ownership with a consistent district consolidation strategy1
PERCENTAGE OF GOLD RESERVES BY JURISDICTION2
Newmont’s reserve base is a key differentiator with over 90 percent of gold reserves located in top-tier jurisdictions, an operating reserve life of more than 10 years and average reserve grade of 1.06 grams per tonne. In addition, Newmont has substantial exposure to other metals, with 65 million gold equivalent ounces3 from copper, silver, zinc, lead and molybdenum.
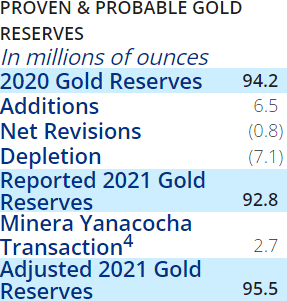
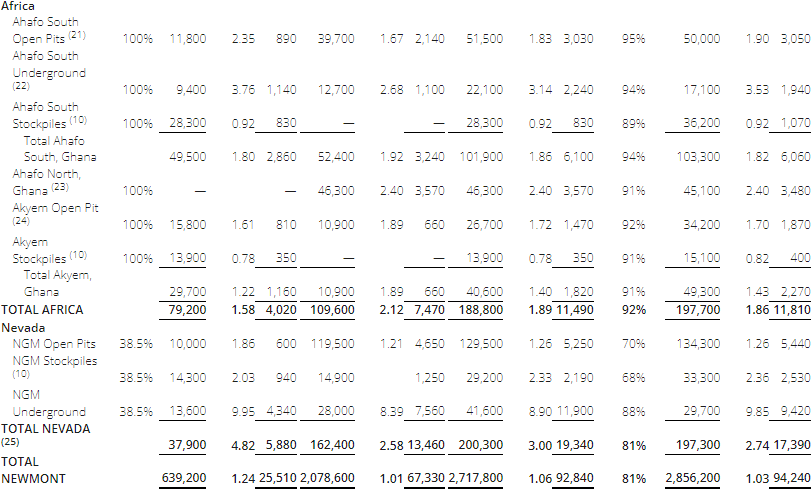
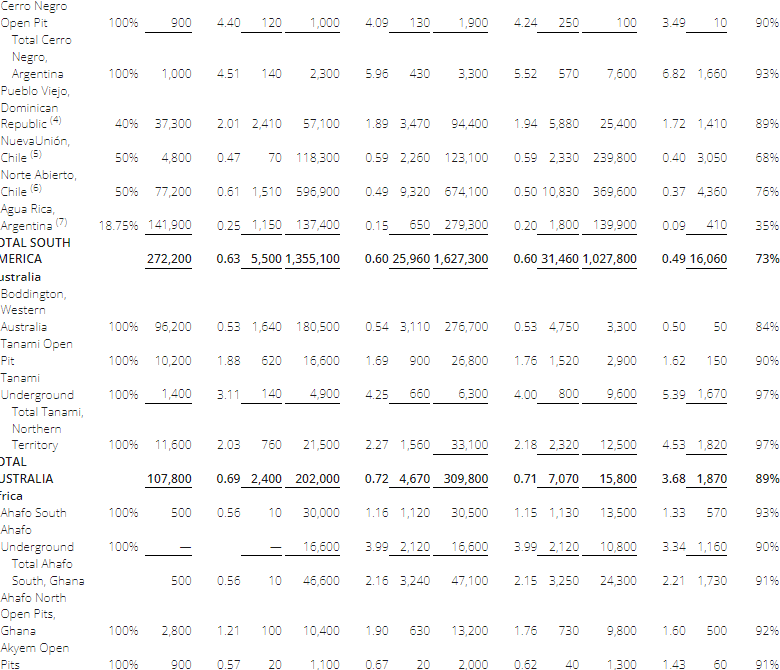
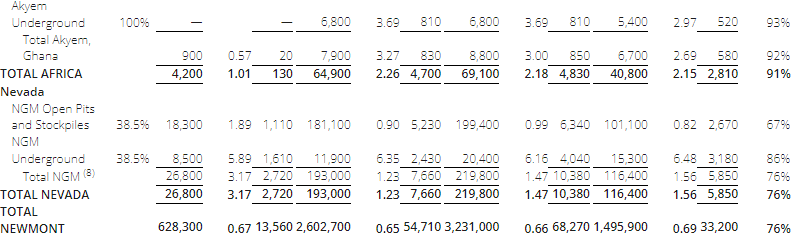
For 2021, Newmont reported 92.8 million ounces of gold Mineral Reserves, slightly lower than the prior year total of 94.2 million ounces. Depletion of 7.1 million ounces and unfavorable net revisions of 0.8 million ounces were largely offset by additions of 6.5 million ounces.
Additions before revisions of 6.5 million ounces through exploration met the Company’s target despite higher costs and challenges created by the pandemic with travel restrictions and additional safety protocols. Notable reserve additions for the year from Newmont’s operating sites included:
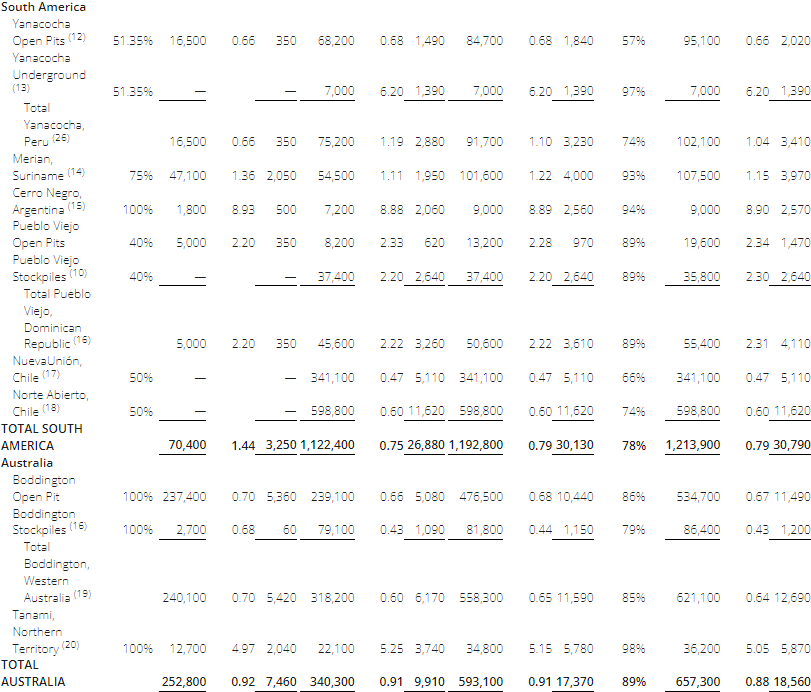
- Cerro Negro added 1.1 million ounces primarily due to drilling in the Eastern Districts
- Tanami added 0.8 million ounces largely due to the first declaration of reserves at Liberator
- Éléonore added 0.4 million ounces primarily from drilling
- Merian added 0.4 million attributable ounces primarily from drilling at the Maraba open pit
- Ahafo added 0.4 million ounces primarily from drilling and updated technical assumptions at Subika Underground
- Newmont’s 38.5 percent interest in NGM added 3.0 million attributable ounces primarily from drilling at Goldrush
Net unfavorable revisions include 0.9 million ounces at Cerro Negro due to reserve downgrades related to drill spacing studies and updated technical assumptions. In addition gold Mineral Reserves reported negative revisions of 0.4 million ounces at Tanami, 0.2 million ounces at Boddington, 0.2 million ounces at Porcupine underground and 0.2 million ounces at Pueblo Viejo. Negative revisions were partially offset by favorable revisions of 0.6 million attributable ounces at NGM and 0.4 million ounces at Éléonore, in addition to acquisitions of 0.1 million attributable ounces related to South Arturo at NGM.
Newmont’s 38.5 percent interest in NGM represented 19.3 million attributable ounces of gold reserves at year end, as compared to 17.4 million ounces at the end of 2020. Pueblo Viejo represented 3.6 million attributable ounces of gold reserves at year end as compared to 4.1 million ounces at the end of 2020, representing Newmont’s 40 percent interest.
Gold reserve grade improved three percent to 1.06 grams per tonne compared to 1.03 grams per tonne in the prior year largely due to higher-grade reserves from the Company’s 38.5 percent equity ownership in Nevada Gold Mines and positive results from our underground managed operations, including Éléonore, Tanami and Porcupine.
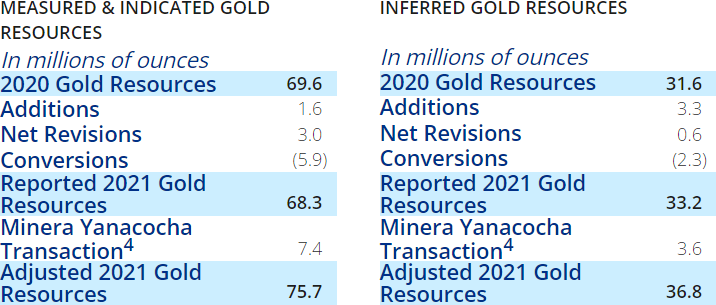
In 2021, Newmont reported Measured and Indicated gold Mineral Resources of 68.3 million ounces as compared to 69.6 million ounces in the prior year. Inferred gold Mineral Resources totaled 33.2 million ounces as compared to 31.6 million ounces in 2020. In total, resource conversions to reserves were more than offset by additions and net positive revisions.
Measured and Indicated Gold Mineral Resources added through exploration programs were 1.6 million ounces and included notable additions before revisions of 0.3 million ounces at Tanami and 0.2 million ounces at Ahafo South underground.
Measured and Indicated gold Mineral Resources reported net revisions of 3.0 million ounces mainly driven by positive revisions of 1.3 million ounces at Boddington and 0.6 million ounces at Tanami. Additionally NGM added 2.1 million attributable ounces. Positive revisions were partially offset by negative revisions, including 1.1 million ounces at CC&V and 0.5 million ounces at Peñasquito.
Inferred Gold Mineral Resources added through exploration programs were 3.3 million ounces and included notable additions before revisions of 0.4 million ounces at Ahafo South, 0.4 million ounces at Éléonore, 0.4 million ounces at Cerro Negro and 0.4 million ounces at Tanami. Additionally, NGM added 0.8 million attributable ounces.
Inferred Gold Mineral Resources reported net revisions of 0.6 million ounces mainly driven by positive revisions of 0.6 million ounces at Cerro Negro and 0.3 million ounces at Ahafo South underground. Additionally, NGM added 1.1 million attributable ounces. Positive revisions were partially offset by negative revisions of 0.7 million ounces at Peñasquito and 0.5 million ounces at Tanami.
Newmont’s Measured and Indicated gold Mineral Resource grade increased slightly to 0.66 grams per tonne compared to 0.65 grams per tonne in the prior year. Inferred gold Mineral Resource grade of 0.69 grams per tonne increased compared with 0.65 grams per tonne from 2020.
OTHER METALS
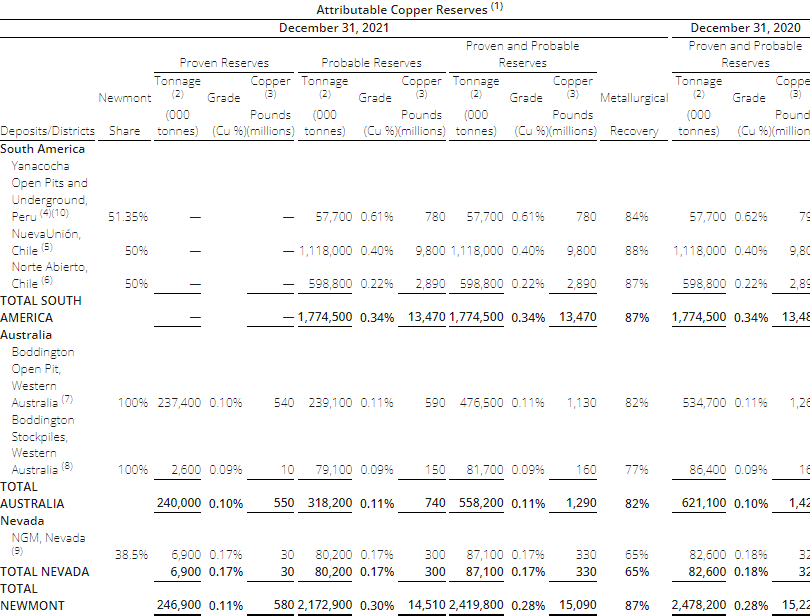
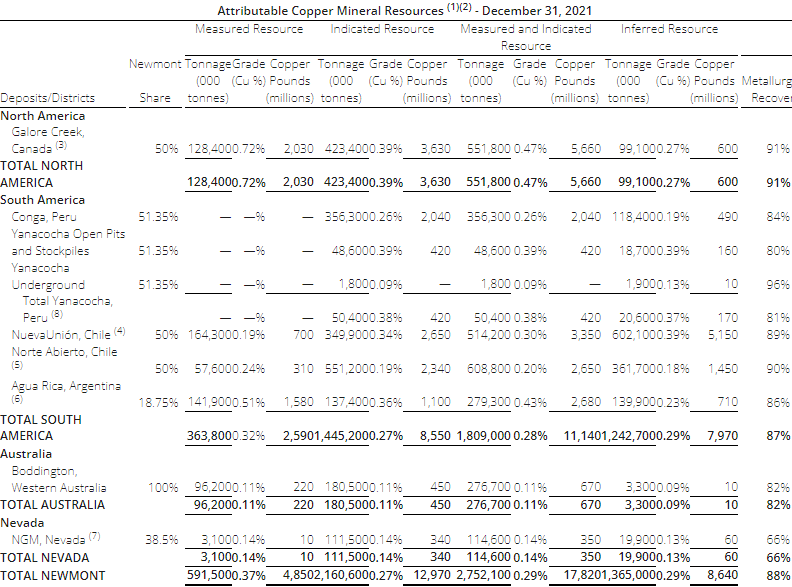
In 2021, copper reserves decreased slightly to 15,090 million pounds from 15,220 pounds in the prior year primarily due to mining depletion. Copper resources increased to 17,820 million pounds of Measured & Indicated and 8,640 million pounds of Inferred from 17,620 million pounds of Measured and Indicated and 8,620 million pounds of Inferred due to the addition of a layback at Boddington. 2021 copper figures exclude 700 million pounds of reserves and 2,645 million pounds of resources acquired through the purchase of Buenaventura’s 43.65% interest in Minera Yanacocha in February 2022.
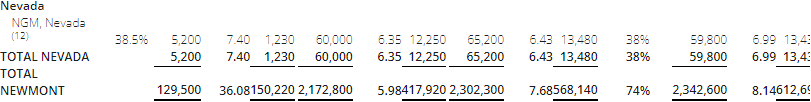
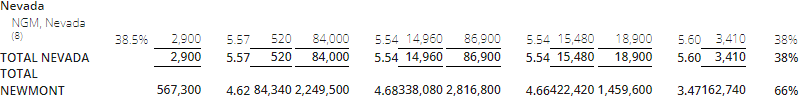
Silver reserves decreased from 613 million ounces to 568 million ounces in the prior year, largely due to depletion at Peñasquito. Silver resources also decreased to 422 million ounces of Measured & Indicated and 163 million ounces of Inferred from 482 million ounces of Measured and Indicated and 204 million ounces of Inferred due to design updates at Peñasquito. 2021 silver figures exclude 49 million pounds of resources acquired through the purchase of Buenaventura’s 43.65% interest in Minera Yanacocha in February 2022.
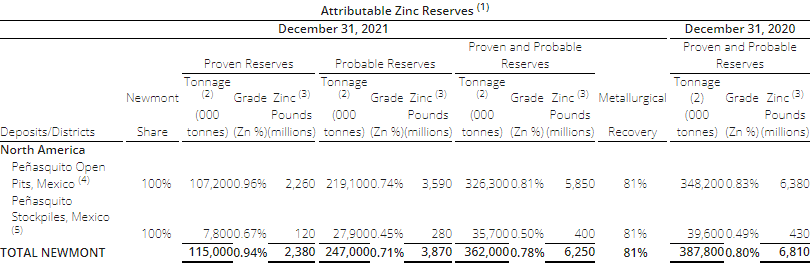
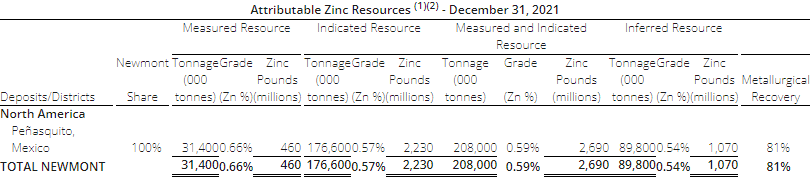
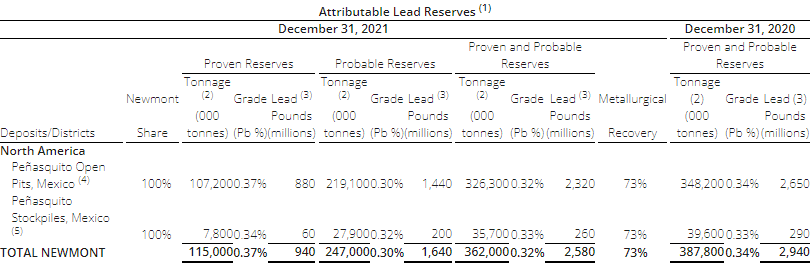
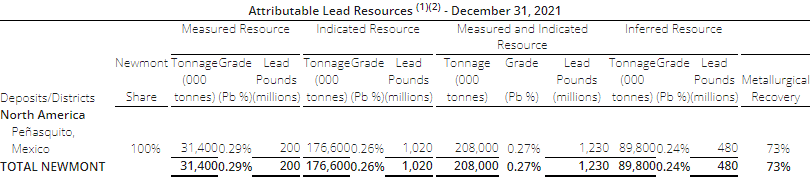
Lead reserves decreased to 2,580 million pounds from 2,940 million pounds in the prior year, and zinc reserves also decreased to 6,250 million pounds from 6,810 million pounds. These decreases are largely due to depletion at Peñasquito. Measured & Indicated lead resources decreased to 1,230 million pounds from 1,700 million pounds and Inferred lead resources decreased to 480 million pounds from 900 million pounds. Measured & Indicated zinc resources decreased to 2,690 million pounds from 3,700 million pounds and Inferred zinc resources decreased to 1,070 million pounds from 1,700 million pounds. These decreases are primarily due to design updates at Peñasquito.
- The reserve and resource table contained herein reflect Newmont’s ownership as of December 31, 2021. Investors are reminded that with the February 8, 2022 closing of Newmont’s acquisition of Buenaventura’s 43.65% interest in Minera Yanacocha, Newmont now holds a 95% interest.
- North America includes 38.5 percent interest in Nevada Gold Mines; South America includes Newmont’s 40 percent interest in Pueblo Viejo.
- Gold Equivalent Ounces calculated using Mineral Reserve pricing as shown below and metallurgical recoveries for each metal on a site by site basis.
- In February 2022, Newmont acquired Buenaventura’s 43.65% interest in Minera Yanacocha.
EXPLORATION OUTLOOK
Newmont’s attributable exploration expenditure for managed operations is expected to be approximately $250 million in 2022 with 80 percent of total exploration investment dedicated to near-mine expansion programs and the remaining 20 percent allocated to the advancement of greenfield projects.
Additionally, Newmont’s share of exploration investment for its non-managed joint ventures will total approximately $45 million.
Geographically, the Company expects to invest approximately 38 percent in North America, 23 percent in South America, 17 percent in Australia and the remainder in Africa and other locations.
GOLD RESERVE SENSITIVITY
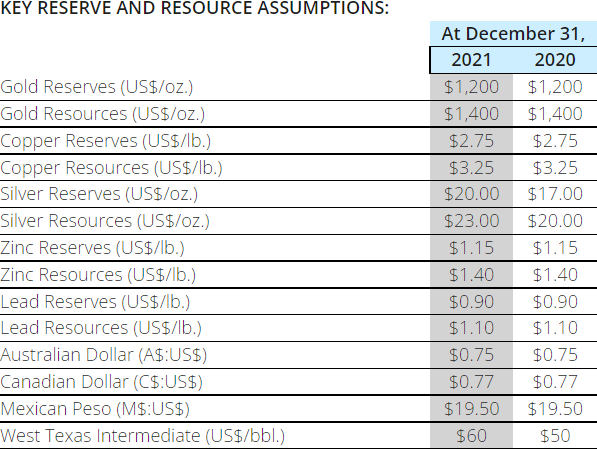
A $100 increase in gold price would result in an approximate six percent increase in gold reserves while a $100 decrease in gold price would result in an approximate eight percent decrease in gold reserves. These sensitivities assume an oil price of $60 per barrel (WTI), Australian dollar exchange rate of $0.75 and Canadian dollar exchange rate of $0.77.
For additional details on Newmont’s reported Gold, Copper, Silver, Zinc, Lead and Molybdenum Mineral Reserves and Mineral Resources, please refer to the tables at the end of this release.
RESERVE AND RESOURCE TABLES
Proven and Probable reserves are based on extensive drilling, sampling, mine modeling and metallurgical testing from which we determine economic feasibility. The price sensitivity of reserves depends upon several factors including grade, metallurgical recovery, operating cost, waste-to-ore ratio and ore type. Metallurgical recovery rates vary depending on the metallurgical properties of each deposit and the production process used. The reserve tables included in this release list the average metallurgical recovery rate for each deposit, which takes into account the assumed processing methods. The cut-off grade, or lowest grade of material considered economic to process, varies with material type, price, metallurgical recoveries, operating costs and co- or by-product credits. The Proven and Probable reserve figures presented herein are estimates based on information available at the time of calculation. No assurance can be given that the indicated levels of recovery of gold, silver, copper, lead, zinc and molybdenum will be realized. Ounces of gold and silver or tonnes of copper, zinc, lead, or molybdenum included in the Proven and Probable reserves are those contained prior to losses during metallurgical treatment. Reserve estimates may require revision based on actual production. Market fluctuations in the price of gold, silver, copper, zinc, lead, or molybdenum, as well as increased production costs or reduced metallurgical recovery rates, could render certain Proven and Probable reserves containing relatively lower grades of mineralization uneconomic to exploit and might result in a reduction of reserves.
The Measured, Indicated, and Inferred resource figures presented herein are estimates based on information available at the time of calculation and are exclusive of reserves. A “Mineral Resource” is a concentration or occurrence of solid material of economic interest in or on the Earth’s crust in such form, grade, or quality and quantity that there are reasonable prospects for eventual economic extraction. The location, quantity, grade or quality, continuity and other geological characteristics of a Mineral Resource are known, estimated or interpreted from specific geological evidence and knowledge, including sampling. Mineral Resources are sub-divided, in order of increasing geological confidence, into Inferred, Indicated and Measured categories. Ounces of gold and silver or tonnes of copper, zinc, lead, and molybdenum included in the Measured, Indicated and Inferred resources are those contained prior to losses during metallurgical treatment. Market fluctuations in the price of gold, silver, copper, zinc, lead and molybdenum, as well as increased production costs or reduced metallurgical recovery rates, could change future estimates of resources. Please refer to the reserves and resources cautionary statement at the end of the release.
Proven and Probable reserves disclosed at December 31, 2021 have been prepared in accordance with the new Regulation S-K 1300 requirements of the SEC; whereas Proven and Probable reserves disclosed at December 31, 2020 have been prepared in accordance with the SEC’s Industry Guide 7 (“IG7”). Our historical methodology applied to the prior year of estimating reserves was not significantly impacted as a result of the change from IG7 to S-K 1300, therefore we believe the amounts presented at December 31, 2021 and 2020, under the respective methodologies, are comparable.
We publish reserves annually, and will recalculate reserves at December 31, 2022, taking into account metal prices, changes, if any, to future production and capital costs, divestments and depletion as well as any acquisitions and additions during 2022.
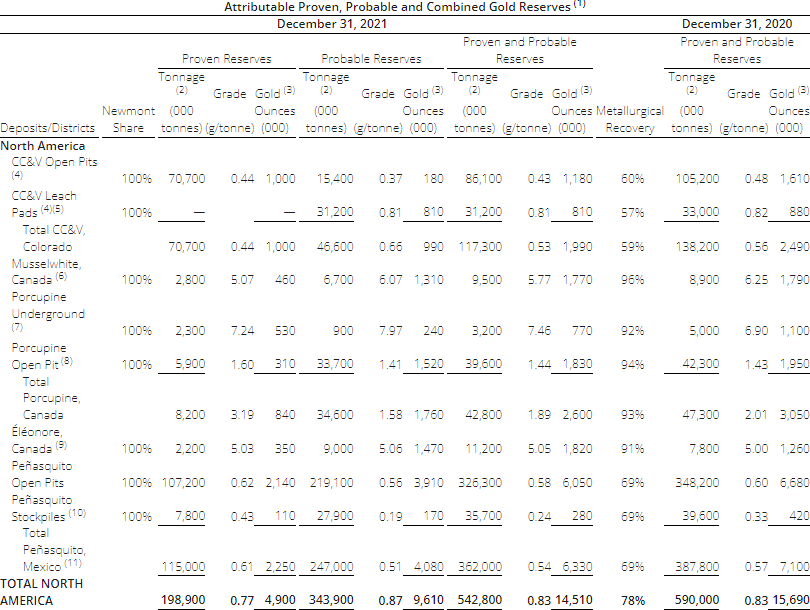
- See cautionary statement regarding reserves and resources. 2021 and 2020 reserves were estimated at a gold price of $1,200 per ounce unless otherwise noted.
- Tonnages include allowances for losses resulting from mining methods. Tonnages are rounded to the nearest 100,000.
- Ounces are estimates of metal contained in ore tonnages and do not include allowances for processing losses. Metallurgical recovery rates represent the estimated amount of metal to be recovered through metallurgical extraction processes. Ounces may not recalculate as they are rounded to the nearest 10,000.
- Cut-off grades utilized in 2021 reserves were as follows: oxide mill material not less than 1.32 gram per tonne and leach material not less than 0.10 gram per tonne.
- Leach pad material is the material on leach pads at the end of the year from which gold remains to be recovered. In-process reserves are reported separately where ounces exceed 100,000 and are greater than 5% of the total site-reported reserves.
- Cut-off grade utilized in 2021 reserves not less than 3.10 gram per tonne.
- Cut-off grade utilized in 2021 reserves not less than 4.00 gram per tonne.
- Cut-off grade utilized in 2021 reserves not less than 0.44 gram per tonne.
- Cut-off grade utilized in 2021 reserves not less than 4.30 gram per tonne.
- Stockpiles are comprised primarily of material that has been set aside to allow processing of higher grade material in the mills. Stockpiles increase or decrease depending on current mine plans. Stockpile reserves are reported separately where ounces exceed 100,000 and are greater than 5% of the total site-reported reserves.
- Gold cut-off grade varies with level of silver, lead and zinc credits.
- Gold cut-off grades utilized in 2021 reserves were as follows: oxide leach material not less than 0.07 gram per tonne and refractory mill material not less than 1.45 gram per tonne.
- Gold cut-off grades utilized in 2021 reserves were as follows: oxide mill material not less than 2.10 gram per tonne and refractory mill material varies with level of copper and silver credits.
- Cut-off grade utilized in 2021 reserves not less than 0.33 gram per tonne.
- Cut-off grade utilized in 2021 reserves not less than 5.00 gram per tonne.
- The Pueblo Viejo mine, which is 40% owned by Newmont, is accounted for as an equity method investment. Reserve estimates provided by Barrick, the operator of Pueblo Viejo.
- Project is currently undeveloped. Reserve estimates provided by the NuevaUnión joint venture.
- Project is currently undeveloped. Reserve estimates provided by the Norte Abierto joint venture
- Gold cut-off grade varies with level of copper credits.
- Cut-off grade utilized in 2021 reserves not less than 2.20 gram per tonne.
- Cut-off grade utilized in 2021 reserves not less than 0.46 gram per tonne.
- Cut-off grade utilized in 2021 reserves not less than 2.40 gram per tonne.
- Cut-off grade utilized in 2021 reserves not less than 0.57 gram per tonne.
- Cut-off grade utilized in 2021 reserves not less than 0.56 gram per tonne.
- Reserve estimates provided by Barrick, the operator of the NGM joint venture.
- In February 2022, the Company increased its ownership interest in Yanacocha to 95% by acquiring Buenaventura’s 43.65% noncontrolling interest. See Note 1 of the Consolidated Financial Statements for further information.
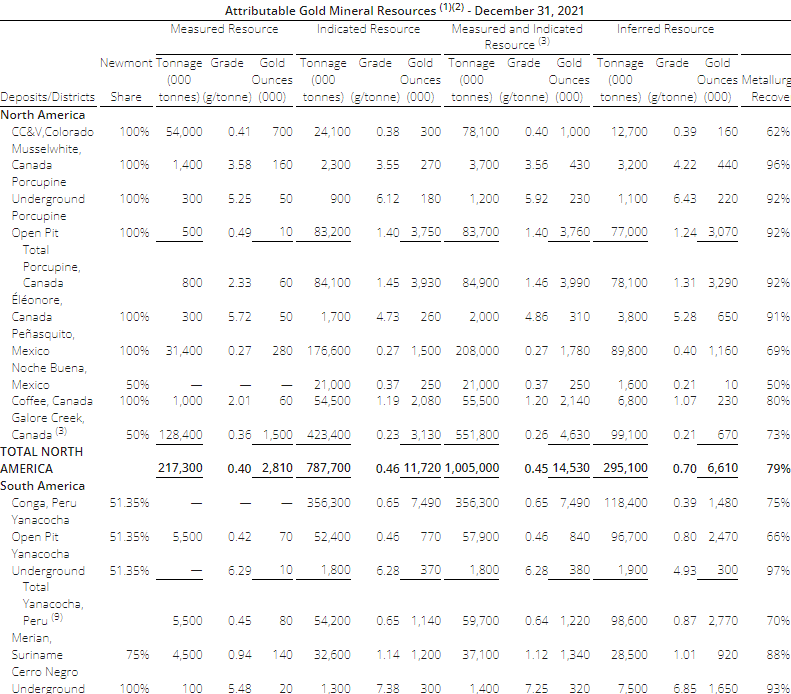
- Resources are reported exclusive of reserves.
- Resources are estimated at a gold price of $1,400 per ounce for 2021 and 2020. Tonnage amounts have been rounded to the nearest 100,000. Ounces may not recalculate as they have been rounded to the nearest 10,000.
- Project is currently undeveloped. Resource estimates provided by Teck Resources.
- Resource estimates provided by Barrick, the operator of Pueblo Viejo.
- Project is currently undeveloped. Resource estimates provided by the NuevaUnión joint venture.
- Project is currently undeveloped. Resource estimates provided by the Norte Abierto joint venture.
- Project is currently undeveloped. Resource estimates provided by Yamana, the operator of the Agua Rica joint venture.
- Resource estimates provided by Barrick, the operator of the NGM joint venture.
- In February 2022, the Company increased its ownership interest in Yanacocha to 95% by acquiring Buenaventura’s 43.65% noncontrolling interest. See Note 1 of the Consolidated Financial Statements for further information.
- See footnote (1) to the Gold Reserves table above. Copper reserves for 2021 and 2020 were estimated at a copper price of $2.75 per pound.
- See footnote (2) to the Gold Reserves table above. Tonnages are rounded to nearest 100,000.
- Pounds are estimates of metal contained in ore tonnages and do not include allowances for processing losses. Metallurgical recovery rates represent the estimated amount of metal to be recovered through metallurgical extraction processes. Pounds may not recalculate as they are rounded to the nearest 10 million.
- Reserve estimates relate to the undeveloped Yanacocha Sulfide project. Copper cut-off grade varies with level of gold and silver credits.
- Project is currently undeveloped. Reserve estimates provided by the NuevaUnión joint venture.
- Project is currently undeveloped. Reserve estimates provided by the Norte Abierto joint venture.
- Copper cut-off grade varies with level of gold credits.
- Stockpiles are comprised primarily of material that has been set aside to allow processing of higher grade material in the mills. Stockpiles increase or decrease depending on current mine plans. Stockpiles are reported separately where pounds exceed 100 million and are greater than 5% of the total site reported reserves.
- Reserve estimates provided by Barrick, the operator of the NGM joint venture.
- In February 2022, the Company increased its ownership interest in Yanacocha to 95% by acquiring Buenaventura’s 43.65% noncontrolling interest. See Note 1 of the Consolidated Financial Statements for further information.
- Resources are reported exclusive of reserves.
- Resources for 2021 and 2020 were estimated at a copper price of $3.25 per pound. Tonnage amounts have been rounded to the nearest 100,000.
- Project is currently undeveloped. Resource estimates provided by Teck Resources.
- Project is currently undeveloped. Resource estimates provided by the NuevaUnión joint venture.
- Project is currently undeveloped. Resource estimates provided by the Norte Abierto joint venture.
- Project is currently undeveloped. Resource estimates provided by Yamana, the operator of the Agua Rica joint venture.
- Resource estimates provided by Barrick, the operator of the NGM joint venture.
- In February 2022, the Company increased its ownership interest in Yanacocha to 95% by acquiring Buenaventura’s 43.65% noncontrolling interest. See Note 1 of the Consolidated Financial Statements for further information.
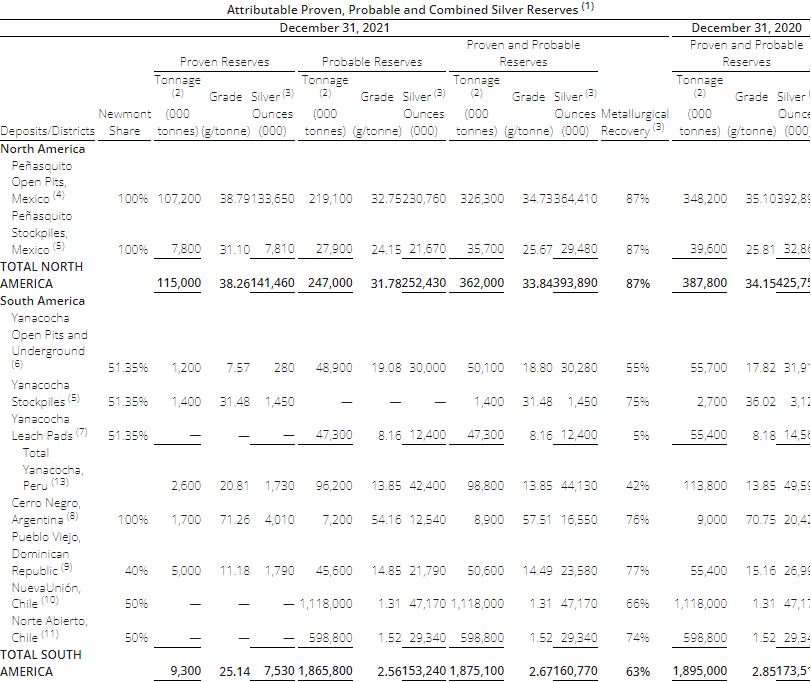
- See footnote (1) to the Gold Reserves table above. Silver reserves for 2021 and 2020 were estimated at a silver price of $20 and $17 per ounce, respectively.
- See footnote (2) to the Gold Reserves table above. Tonnages are rounded to nearest 100,000.
- See footnote (3) to the Gold Reserves table above. Ounces may not recalculate as they are rounded to the nearest 10,000.
- Silver cut-off grade varies with gold, lead and zinc credits.
- Stockpiles are comprised primarily of material that has been set aside to allow processing of higher grade material in the mills. Stockpiles increase or decrease depending on current mine plans. Stockpile reserves are reported separately where ounces exceed 100,000 and are greater than 5% of the total site-reported reserves.
- Silver cut-off grade varies with gold and copper credits.
- Leach Pad material is the material on leach pads at the end of the year from which silver remains to be recovered. In-process material reserves are reported separately where tonnage or ounces are greater than 5% of the total site-reported reserves and ounces are greater than 100,000.
- Silver cut-off grade varies with gold credits.
- The Pueblo Viejo mine, which is 40% owned by Newmont, is accounted for as an equity method investment. Reserve estimates provided by Barrick, the operator of Pueblo Viejo.
- Project is currently undeveloped. Reserve estimates provided by the NuevaUnión joint venture.
- Project is currently undeveloped. Reserve estimates provided by the Norte Abierto joint venture.
- Reserve estimates provided by Barrick, the operator of the NGM joint venture.
- In February 2022, the Company increased its ownership interest in Yanacocha to 95% by acquiring Buenaventura’s 43.65% noncontrolling interest. See Note 1 of the Consolidated Financial Statements for further information.
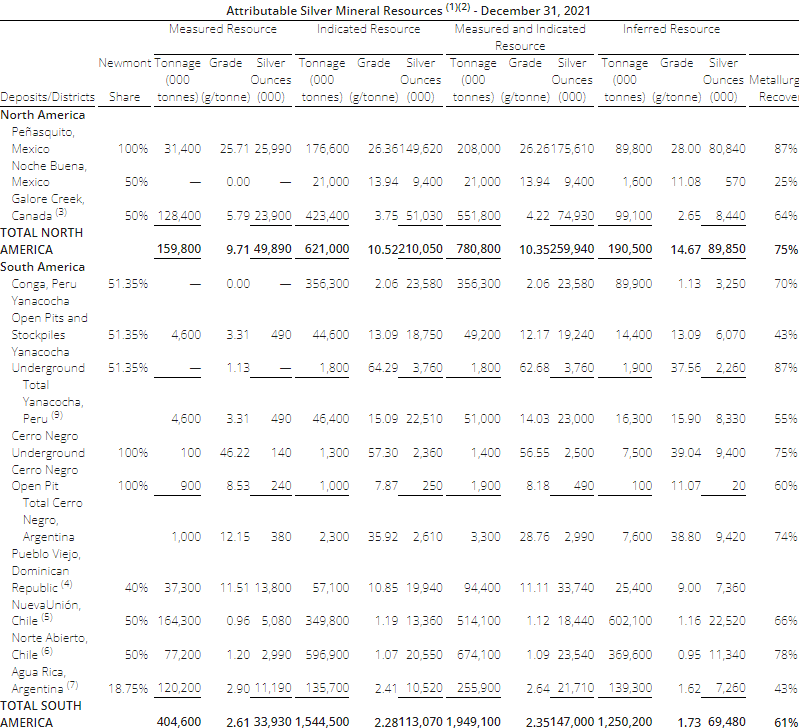
- Resources are reported exclusive of reserves.
- Resource for 2021 and 2020 were estimated at a silver price of $23 and $20 per ounce, respectively. Tonnage amounts have been rounded to the nearest 100,000.
- Project is currently undeveloped. Resource estimates provided by Teck Resources.
- Resource estimates provided by Barrick, the operator of Pueblo Viejo.
- Project is currently undeveloped. Resource estimates provided by the NuevaUnión joint venture.
- Project is currently undeveloped. Resource estimates provided by the Norte Abierto joint venture.
- Project is currently undeveloped. Resource estimates provided by Yamana, the operator of the Agua Rica joint venture.
- Resource estimates provided by Barrick, the operator of the NGM joint venture.
- In February 2022, the Company increased its ownership interest in Yanacocha to 95% by acquiring Buenaventura’s 43.65% noncontrolling interest. See Note 1 of the Consolidated Financial Statements for further information.
- See footnote (1) to the Gold Reserves table above. Zinc reserves for 2021 and 2020 were estimated at a zinc price of $1.15 per pound.
- See footnote (2) to the Gold Reserves table above. Tonnages are rounded to nearest 100,000.
- See footnote (3) to the Copper Reserves table above. Pounds may not recalculate as they are rounded to the nearest 10 million.
- Zinc cut-off grade varies with level of gold, silver and zinc credits.
- Stockpiles are comprised primarily of material that has been set aside to allow processing of higher grade material in the mills. Stockpiles increase or decrease depending on current mine plans. Stockpile reserves are reported separately where tonnes exceed 10,000 and are greater than 5% of the total site-reported reserves.
- Resources are reported exclusive of reserves.
- Resources for 2021 and 2020 were estimated at a zinc price of $1.40 per pound. Tonnage amounts have been rounded to the nearest 100,000.
- See footnote (1) to the Gold Reserves table above. Lead reserves for 2021 and 2020 were estimated at a lead price of $0.90 per pound.
- See footnote (2) to the Gold Reserves table above. Tonnages are rounded to nearest 100,000.
- See footnote (3) to the Copper Reserves table above. Pounds may not recalculate as they are rounded to the nearest 10 million.
- Lead cut-off grade varies with level of gold, silver and zinc credits.
- Stockpiles are comprised primarily of material that has been set aside to allow processing of higher grade material in the mills. Stockpiles increase or decrease depending on current mine plans. Stockpile reserves are reported separately where tonnes exceed 10,000 and are greater than 5% of the total site-reported reserves.
- Resources are reported exclusive of reserves.
- Resources for 2021 and 2020 were estimated at a lead price of $1.10 per pound. Tonnage amounts have been rounded to the nearest 100,000.
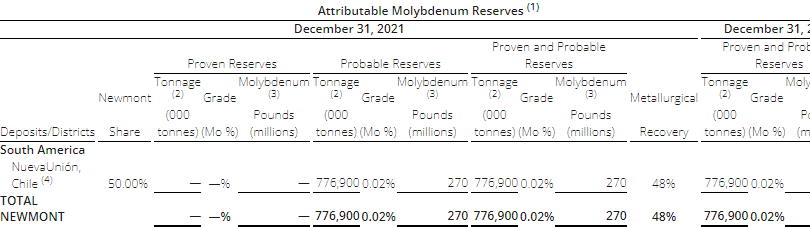
- See footnote (1) to the Gold Reserves table above. Molybdenum reserves were estimated based on a molybdenum price set by NuevaUnión joint venture.
- See footnote (2) to the Gold Reserves table above. Tonnages are rounded to nearest 100,000.
- See footnote (3) to the Copper Reserves table above. Pounds may not recalculate as they are rounded to the nearest 10 million.
- Project is currently undeveloped. Resource estimates provided by NuevaUnión joint venture.
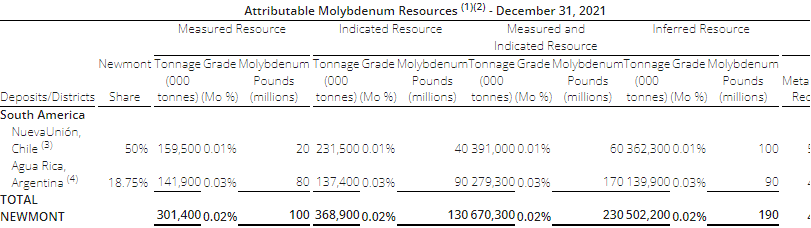
- Resources are reported exclusive of reserves.
- Resources for NuevaUnión and Agua Rica are estimated based on a molybdenum price set by NuevaUnión joint venture and Yamana, respectively. Tonnage amounts have been rounded to the nearest 100,000.
- Project is currently undeveloped. Resource estimates provided by NuevaUnión joint venture.
- Resource estimates provided by Yamana, the operator of the Agua Rica joint venture.
Cautionary Statement Regarding Reserve and Resource Estimates:
The reserves stated in this report represent estimates at December 31, 2021, which could be economically and legally extracted or produced at the time of the reserve determination. Estimates of proven and probable reserves are subject to considerable uncertainty. Such estimates are, or will be, to a large extent, based on the prices of gold, silver, copper, zinc and lead and interpretations of geologic data obtained from drill holes and other exploration techniques, which data may not necessarily be indicative of future results. If our reserve estimations are required to be revised due to significantly lower gold, silver, zinc, copper and lead prices, increases in operating costs, reductions in metallurgical recovery or other modifying factors, this could result in material write-downs of our investment in mining properties, goodwill and increased amortization, reclamation and closure charges. Producers use feasibility studies for undeveloped ore bodies to derive estimates of capital and operating costs based upon anticipated tonnage and grades of ore to be mined and processed, the predicted configuration of the ore body, expected recovery rates of metals from the ore, the costs of comparable facilities, the costs of operating and processing equipment and other factors. Actual operating and capital cost and economic returns on projects may differ significantly from original estimates. Further, it may take many years from the initial phases of exploration until commencement of production, during which time, the economic feasibility of production may change. Additionally, resource does not indicate proven and probable reserves as defined by the SEC or the Company’s standards. Estimates of measured, indicated and inferred resource are subject to further exploration and development, and are, therefore, subject to considerable uncertainty. Inferred resources, in particular, have a great amount of uncertainty as to their existence and their economic and legal feasibility. The Company cannot be certain that any part or parts of the resource will ever be converted into reserves. In addition, if the price of gold, silver, copper, zinc or lead declines from recent levels, if production costs increase, grades decline, recovery rates decrease or if applicable laws and regulations are adversely changed, the indicated level of recovery may not be realized or mineral reserves or resources might not be mined or processed profitably. If we determine that certain of our mineral reserves have become uneconomic, this may ultimately lead to a reduction in our aggregate reported reserves and resources. Consequently, if our actual mineral reserves and resources are less than current estimates, our business, prospects, results of operations and financial position may be materially impaired. For additional information see the “Reserve and Resource Tables” section of this release and Item 2 of the Company’s Form 10-K, filed on February 24, 2022, with the SEC.
Cautionary Statement Regarding Forward Looking Statements:
This release may contain “forward-looking statements” within the meaning of Section 27A of the Securities Act of 1933, as amended, and Section 21E of the Securities Exchange Act of 1934, as amended, which are intended to be covered by the safe harbor created by such sections and other applicable laws. Such forward-looking statements may include, without limitation, estimates and expectations of future production, reserve estimates, exploration outlook and expected expenditure, and operational and financial performance. Where the Company expresses or implies an expectation or belief as to future events or results, such expectation or belief is expressed in good faith and believed to have a reasonable basis. However, such statements are subject to risks, uncertainties, assumptions and other factors, which could cause actual results to differ materially from future results expressed or implied by the “forward-looking statements”. Such assumptions, include, but are not limited to the key assumptions set forth above. Investors are also encouraged to refer to the Company’s 2021 Form 10-K, filed on February 24, 2022, with the SEC under the headings “Risk Factors” and “Forward-Looking Statements” for additional information, The Company does not undertake any obligation to release publicly revisions to any “forward-looking statement,” including, without limitation, outlook, to reflect events or circumstances after the date of this news release, or to reflect the occurrence of unanticipated events, except as may be required under applicable securities laws. Investors should not assume that any lack of update to a previously issued “forward-looking statement” constitutes a reaffirmation of that statement. Continued reliance on “forward-looking statements” is at investors’ own risk.
About Newmont
Newmont is the world’s leading gold company and a producer of copper, silver, zinc and lead. The Company’s world-class portfolio of assets, prospects and talent is anchored in favorable mining jurisdictions in North America, South America, Australia and Africa. Newmont is the only gold producer listed in the S&P 500 Index and is widely recognized for its principled environmental, social and governance practices. The Company is an industry leader in value creation, supported by robust safety standards, superior execution and technical expertise. Newmont was founded in 1921 and has been publicly traded since 1925.
Media Contact
Courtney Boone
303.837.5159
[email protected]
Investor Contact
Daniel Horton
303.837.5468
[email protected]
Source: Newmont Corporation


