DENVER–(BUSINESS WIRE)– Newmont Corporation (NYSE: NEM, TSX: NGT) (Newmont or the Company) reported gold Mineral Reserves (reserves) of 100.2 million attributable ounces for 2019 compared to 65.4 million ounces at the end of 2018, an increase of 53 percent after successfully completing two historic transactions and through ongoing exploration success.
This press release features multimedia. View the full release here: https://www.businesswire.com/news/home/20200213005222/en/
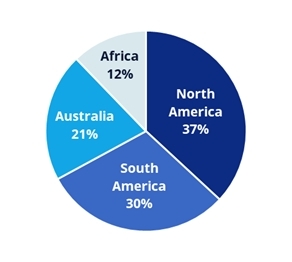
Percentage of Gold Reserves by Jurisdiction (North America includes Nevada)
“Newmont has the largest gold reserve base in the industry underpinned by our world-class ore bodies in top tier jurisdictions. In 2019, we added almost 50 million ounces of gold reserves through the acquisition of Goldcorp, formation of the Nevada Gold Mines joint venture and the continuation of our leading exploration program,” said Tom Palmer, President and Chief Executive Officer. “Our reserve and resource base will support stable production of more than 6 million ounces per annum for decades to come.”
Key highlights and differentiators:
- Industry’s largest gold Mineral Reserves of 100.2 million ounces
- Gold reserves located in top-tier jurisdictions with 88 percent in Americas and Australia
- Gold reserve life at operating sites of >10 years underpinned by a strong base at Boddington, Tanami, Ahafo, Peñasquito, and Nevada Gold Mines, and further enhanced from our eight other operating mines and equity ownership in Pueblo Viejo
- Significant gold reserves per share with 124 ounces per 1,000 shares
- Tanami added 1.5 million ounces of gold reserves, 1.1 million ounces of Measured and Indicated gold resources and 1.6 million ounces of inferred resource
- Stable production profile underpinned by long life operating assets such as Boddington with 14 years; Tanami and Peñasquito with 12 years and Ahafo with 11 years
- Significant exposure to copper, silver, zinc, and lead with 63 million gold equivalent ounces (GEO)1
- Measured & Indicated gold Mineral Resources of 76.7 million ounces; Inferred of 31.3 million ounces
Reported figures include Red Lake and the Company’s 50 percent interest in Kalgoorlie Consolidated Gold Mines (KCGM). Newmont successfully completed the sale of KCGM in January 2020 and expects to close the divestment of Red Lake in the first quarter of 2020. Combined, these sites represented approximately 4.5 million ounces of gold reserves and 2.6 million ounces of Measured and Indicated gold Mineral Resources (resources), bringing Newmont’s adjusted 2019 gold Mineral Reserves to 95.7 and Measured and Indicated gold Mineral Resources2 to 74.1 million ounces.
Newmont’s reserve base is a key differentiator with 88 percent of gold reserves located in top-tier jurisdictions in the Americas and Australia, an operating reserve life of more than 10 years and average reserve grade of 1.05 grams per tonne. In addition, Newmont significantly increased its exposure to other metals, with an estimated 63 million gold equivalent ounces1 from copper, silver, zinc, lead and molybdenum.
In 2019, Newmont reported 100.2 million ounces of gold Mineral Reserves and 95.7 million ounces after adjusting for the KCGM and Red Lake divestments.
The Company added 42.2 million net ounces of gold reserves through its acquisition of Goldcorp and formation of the Nevada Gold Mines (NGM) joint venture, after adjusting for revisions at select Goldcorp operating sites, which were assessed using Newmont’s rigorous technical standards.
As previously disclosed, the Coffee project and Dome pit as part of the Century project were reclassified from Mineral Reserves to Mineral Resources, due to Feasibility study requirements. The project revisions were 1.7 million ounces and 4.4 million ounces, respectively.
Additions before revisions of 7.4 million ounces through exploration exceeded the Company’s target demonstrating drilling success and the prospectivity across the portfolio. Notable reserve additions for the year included: 2.5 million equity ounces from NGM, 1.5 million ounces at Tanami, 0.7 million equity ounces at NuevaUnión, 0.5 million ounces at Merian and 0.4 million ounces at Ahafo underground. Additions nearly offset depletion of 7.7 million contained ounces, which corresponds to Newmont’s 2019 attributable production outlook of 6.3 million ounces.
Newmont’s gold reserve grade was 1.05 grams per tonne compared to 1.19 grams per tonne in the prior year, largely due to the addition of polymetallic mines and projects including Peñasquito, NuevaUnión and Norte Abierto, which was partially offset by higher-grade reserves from the Company’s 38.5 percent equity ownership in NGM.
Newmont reported attributable Measured and Indicated gold Mineral Resources of 76.7 million ounces and 31.3 million ounces of attributable Inferred gold Mineral Resources, an increase of 95 percent and 101 percent from the prior year, respectively, at a constant gold price. Adjusted for the divestitures of KCGM and Red Lake.
Measured and Indicated gold Mineral Resources are 74.1 million ounces and Inferred gold Mineral Resources are 29.4 million ounces.
The acquisition of Goldcorp and formation of the NGM joint venture added 26.5 million net ounces of Measured and Indicated gold Mineral Resources and 13.7 million net ounces of Inferred gold Mineral Resources.
Measured and Indicated gold Mineral Resources added through exploration and studies were 7.8 million ounces and included notable additions before revisions of 1.1 million ounces at Tanami, 0.9 million equity ounces at both NGM and Pueblo Viejo, 0.8 million ounces at each of Ahafo underground, NuevaUnión and Merian (equity ounces).
Additions before revisions of 5.2 million ounces of Inferred gold Mineral Resources notably included 1.6 million ounces at Tanami, 0.8 million equity ounces at NGM, and 0.7 million ounces at Peñasquito.
Newmont’s Measured and Indicated gold Mineral Resource grade increased to 0.72 grams per tonne compared to 0.69 grams per tonne in the prior year from higher grade resources from NGM and the underground mines from the Goldcorp acquisition. Inferred gold Mineral Resource grade decreased to 0.66 grams per tonne from 1.01 grams per tonne, largely due to lower grade ounces from acquired polymetallic mines and projects.
Other Metals
Newmont’s base metal reserves increased significantly with the addition of the Goldcorp assets. Copper reserves increased to 6.8 million tonnes from 1.3 million tonnes in 2018, primarily due to the additions at the NuevaUnión and Norte Abierto projects. Copper resources increased significantly, increasing to 6.8 million tonnes of Measured & Indicated and 3.5 million tonnes of Inferred from 4.1 million tonnes of Measured & Indicated and 0.5 million tonnes of Inferred.
Silver reserves also increased significantly to 652 million ounces from 86 million ounces, primarily due to additions at Peñasquito, but also supported by NuevaUnión, Norte Abierto, Cerro Negro and Pueblo Viejo. Silver resources increased to 481 million ounces of Measured & Indicated and 217 million ounces of Inferred from 128 million ounces of Measured & Indicated and 21 million ounces of Inferred.
The Company also had first time declarations totaling 3.4 million tonnes of zinc reserves and 1.5 million tonnes of lead reserves at Peñasquito, and 0.1 million tonnes of molybdenum at NuevaUnión. First time declarations of zinc and lead resources were 1.9 million tonnes of Measured & Indicated and 1.0 million tonnes of Inferred, and 0.8 million tonnes of Measured & Indicated and 0.5 million tonnes of Inferred, respectively.
Exploration Outlook
Newmont’s total attributable exploration expenditure3 is expected to be approximately $230 million in 2020, a decrease of 13 percent from the prior year as the Company captures $25 million of exploration synergies from the Goldcorp acquisition and approximately $10 million from the divestiture of KCGM and Red Lake. Around 80 percent of total exploration investment will be dedicated to near-mine expansion programs and the remaining 20 percent will be allocated to the advancement of greenfield projects and innovation programs. Geographically, the Company expects to invest approximately 30 percent in North America, 25 percent in South America, 20 percent in Australia and the remainder in Africa and other locations.
Gold Reserve Sensitivity
A $100 increase in gold price would result in an approximate six percent increase in gold reserves while a $100 decrease in gold price would result in an approximate six percent decrease in gold reserves. These sensitivities assume an oil price of $60 per barrel (WTI), Australian dollar exchange rate of $0.75 and Canadian dollar exchange rate of $0.77.
For additional details on Newmont’s reported Gold, Copper, Silver, Zinc, Lead and Molybdenum Mineral Reserves and Mineral Resources, please refer to the tables at the end of this release.
| 1 Gold Equivalent Ounces calculated using Mineral Reserve pricing as shown at the end of this release and metallurgical recoveries for each metal on a site-by-site basis. |
| 2 Totals may not sum due to rounding. |
| 3 Includes capitalized and expensed exploration. |
Key Assumptions:
| Years Ended December 31 | ||||
| 2019 | 2018 | |||
| Gold Reserves (US$/oz.) | $1,200 | $1,200 | ||
| Gold Resources (US$/oz.) | $1,400 | $1,400 | ||
| Copper Reserves (US$/lb.) | $2.75 | $2.50 | ||
| Copper Resources (US$/lb.) | $3.25 | $3.25 | ||
| Silver Reserves (US$/oz.) | $16.00 | $16.00 | ||
| Silver Resources (US$/oz.) | $20.00 | $20.00 | ||
| Zinc Reserves (US$/lb.) | $1.20 | NA | ||
| Zinc Resources (US$/lb.) | $1.45 | NA | ||
| Lead Reserves (US$/lb.) | $0.95 | NA | ||
| Lead Resources (US$/lb.) | $1.15 | NA | ||
| Australian Dollar (A$:US$) | $0.75 | $0.75 | ||
| Canadian Dollar (C$:US$) | $0.77 | NA | ||
| Mexican Peso (M$:US$) | $19.50 | NA | ||
| West Texas Intermediate (US$/bbl.) | $60 | $65 | ||
Reserve and Resource Tables
Proven and Probable reserves are based on extensive drilling, sampling, mine modeling and metallurgical testing from which we determine economic feasibility. Newmont’s metal price assumptions follow SEC guidance not to exceed a three year trailing average. The price sensitivity of reserves depends upon several factors including grade, metallurgical recovery, operating cost, waste-to-ore ratio and ore type. Metallurgical recovery rates vary depending on the metallurgical properties of each deposit and the production process used. The reserve tables included in this release list the average metallurgical recovery rate for each deposit, which takes into account the assumed processing methods. The cut-off grade, or lowest grade of material considered economic to process, varies with material type, price, metallurgical recoveries, operating costs and co- or by-product credits. The Proven and Probable reserve figures presented herein are estimates based on information available at the time of calculation. No assurance can be given that the indicated levels of recovery of gold, silver, copper, lead, zinc and molybdenum will be realized. Ounces of gold and silver or tonnes of copper, zinc, lead, or molybdenum included in the Proven and Probable reserves are those contained prior to losses during metallurgical treatment. Reserve estimates may require revision based on actual production. Market fluctuations in the price of gold, silver, copper, zinc, lead, or molybdenum, as well as increased production costs or reduced metallurgical recovery rates, could render certain Proven and Probable reserves containing relatively lower grades of mineralization uneconomic to exploit and might result in a reduction of reserves.
The Measured, Indicated, and Inferred resource figures presented herein are estimates based on information available at the time of calculation and are exclusive of reserves. A “Mineral Resource” is a concentration or occurrence of solid material of economic interest in or on the Earth’s crust in such form, grade, or quality and quantity that there are reasonable prospects for eventual economic extraction. The location, quantity, grade or quality, continuity and other geological characteristics of a Mineral Resource are known, estimated or interpreted from specific geological evidence and knowledge, including sampling. Mineral Resources are sub-divided, in order of increasing geological confidence, into Inferred, Indicated and Measured categories. Ounces of gold and silver or tonnes of copper, zinc, lead, and molybdenum included in the Measured, Indicated and Inferred resources are those contained prior to losses during metallurgical treatment. Market fluctuations in the price of gold, silver, copper, zinc, lead and molybdenum, as well as increased production costs or reduced metallurgical recovery rates, could change future estimates of resources. Please refer to the reserves and resources cautionary statement at the end of the release.
We publish reserves and resources annually, and will recalculate reserves and resources at year-end 2020, taking into account metal prices, changes, if any, in future production and capital costs, mine designs, model changes, divestments and depletion as well as any acquisitions and additions during 2020.
The following technical reports are available to the public on SEDAR:
Ahafo South Operations, Republic of Ghana, NI 43-101 Technical Report, Report Effective Date: December 31, 2018
Boddington Operations, Western Australia, Australia, NI 43-101 Technical Report, Report Effective Date: December 31, 2018
Peñasquito Polymetallic Operations, Zacatecas State, Mexico, NI 43-101 Technical Report, Report Effective Date: 30 June 2018 (under Goldcorp’s SEDAR profile)
Tanami Operations, Northern Territory, Australia, NI 43-101 Technical Report, Report Effective Date: December 31, 2018
| Attributable Proven, Probable and Combined Gold Reserves (1), Metric Units | ||||||||||||||||||||||||||||||
| December 31, 2019 | December 31, 2018 | |||||||||||||||||||||||||||||
| Proven Reserves | Probable Reserves | Proven and Probable Reserves | Proven and Probable Reserves | |||||||||||||||||||||||||||
| Newmont | Tonnage (2) | Grade | Gold (3) | Tonnage (2) | Grade | Gold (3) | Tonnage (2) | Grade | Gold (3) | Metallurgical | Tonnage (2) | Grade | Gold (3) | |||||||||||||||||
| Deposits/Districts | Share | (x1000 tonnes) | (g/tonne) | (x1000 ozs) | (x1000 tonnes) | (g/tonne) | (x1000 ozs) | (x1000 tonnes) | (g/tonne) | (x1000 ozs) | Recovery | (x1000 tonnes) | (g/tonne) | (x1000 ozs) | ||||||||||||||||
| North America | ||||||||||||||||||||||||||||||
| CC&V Open Pits (4) | 100 | % | 94,100 | 0.52 | 1,570 | 24,400 | 0.43 | 340 | 118,500 | 0.50 | 1,910 | 59 | % | 140,300 | 0.53 | 2,400 | ||||||||||||||
| CC&V Leach Pads (5) | 100 | % | — | — | 31,600 | 0.88 | 890 | 31,600 | 0.88 | 890 | 59 | % | 38,100 | 0.86 | 1,050 | |||||||||||||||
| Total CC&V, Colorado | 94,100 | 0.52 | 1,570 | 56,000 | 0.69 | 1,230 | 150,100 | 0.58 | 2,800 | 59 | % | 178,400 | 0.60 | 3,450 | ||||||||||||||||
| Red Lake, Canada (6) | 100 | % | 900 | 8.69 | 260 | 3,700 | 8.68 | 1,040 | 4,600 | 8.68 | 1,300 | 94 | % | — | — | |||||||||||||||
| Musselwhite, Canada (7) | 100 | % | 4,900 | 6.48 | 1,020 | 5,000 | 6.57 | 1,070 | 9,900 | 6.52 | 2,090 | 95 | % | — | — | |||||||||||||||
| Porcupine Underground (8) | 100 | % | 600 | 10.53 | 200 | 4,300 | 6.89 | 950 | 4,900 | 7.33 | 1,150 | 87 | % | — | — | |||||||||||||||
| Porcupine Open Pit (9) | 100 | % | 11,900 | 1.50 | 570 | 32,700 | 1.04 | 1,100 | 44,600 | 1.16 | 1,670 | 88 | % | — | — | |||||||||||||||
| Total Porcupine, Canada | 12,500 | 1.92 | 770 | 37,000 | 1.72 | 2,050 | 49,500 | 1.77 | 2,820 | 88 | % | — | — | |||||||||||||||||
| Éléonore, Canada (10) | 100 | % | 1,500 | 5.69 | 280 | 5,900 | 5.21 | 1,000 | 7,400 | 5.31 | 1,280 | 91 | % | — | — | |||||||||||||||
| Peñasquito, Mexico (11) | 100 | % | 109,700 | 0.63 | 2,220 | 331,800 | 0.55 | 5,860 | 441,500 | 0.57 | 8,080 | 77 | % | — | — | |||||||||||||||
| TOTAL NORTH AMERICA | 223,600 | 0.85 | 6,120 | 439,400 | 0.87 | 12,250 | 663,000 | 0.86 | 18,370 | 80 | % | 178,400 | 0.60 | 3,450 | ||||||||||||||||
| South America | ||||||||||||||||||||||||||||||
| Yanacocha Open Pits (12) | 51.35 | % | 11,200 | 0.72 | 270 | 96,500 | 0.64 | 1,990 | 107,700 | 0.65 | 2,260 | 64 | % | 117,900 | 0.67 | 2,540 | ||||||||||||||
| Yanacocha Underground (13) | 51.35 | % | — | — | 6,000 | 6.88 | 1,310 | 6,000 | 6.88 | 1,310 | 96 | % | 5,700 | 1,270 | ||||||||||||||||
| Total Yanacocha, Peru | 11,200 | 0.72 | 270 | 102,500 | 1.00 | 3,300 | 113,700 | 0.98 | 3,570 | 76 | % | 123,600 | 0.96 | 3,810 | ||||||||||||||||
| Merian, Suriname (14) | 75 | % | 41,100 | 1.41 | 1,860 | 46,600 | 1.08 | 1,620 | 87,700 | 1.23 | 3,480 | 92 | % | 93,100 | 1.25 | 3,730 | ||||||||||||||
| Cerro Negro, Argentina (15) | 100 | % | 1,100 | 11.49 | 400 | 7,300 | 9.44 | 2,200 | 8,400 | 9.70 | 2,600 | 92 | % | — | — | |||||||||||||||
| Pueblo Viejo Open Pits | 40 | % | 6,700 | 2.68 | 580 | 5,600 | 2.72 | 490 | 12,300 | 2.70 | 1,070 | 91 | % | — | — | |||||||||||||||
| Pueblo Viejo Stockpiles (16) | 40 | % | — | — | 35,300 | 2.41 | 2,740 | 35,300 | 2.41 | 2,740 | 90 | % | — | — | ||||||||||||||||
| Total Pueblo Viejo, Dominican Republic (17) | 6,700 | 2.68 | 580 | 40,900 | 2.46 | 3,230 | 47,600 | 2.49 | 3,810 | 90 | % | — | — | |||||||||||||||||
| NuevaUnión, Chile (18) | 50 | % | — | — | 341,100 | 0.47 | 5,150 | 341,100 | 0.47 | 5,150 | 68 | % | — | — | ||||||||||||||||
| Norte Abierto, Chile (19) | 50 | % | — | — | 598,800 | 0.60 | 11,620 | 598,800 | 0.60 | 11,620 | 74 | % | — | — | ||||||||||||||||
| TOTAL SOUTH AMERICA | 60,100 | 1.60 | 3,110 | 1,137,200 | 0.74 | 27,120 | 1,197,300 | 0.79 | 30,230 | 78 | % | 216,700 | 1.08 | 7,540 | ||||||||||||||||
| Australia | ||||||||||||||||||||||||||||||
| Boddington Open Pit (20) | 100 | % | 234,800 | 0.70 | 5,260 | 246,200 | 0.69 | 5,460 | 481,000 | 0.69 | 10,720 | 85 | % | 480,700 | 0.71 | 10,990 | ||||||||||||||
| Boddington Stockpiles (16) | 100 | % | 3,900 | 0.60 | 80 | 81,400 | 0.43 | 1,130 | 85,300 | 0.44 | 1,210 | 78 | % | 93,000 | 0.45 | 1,360 | ||||||||||||||
| Total Boddington, Western Australia | 238,700 | 0.69 | 5,340 | 327,600 | 0.63 | 6,590 | 566,300 | 0.65 | 11,930 | 84 | % | 573,700 | 0.67 | 12,350 | ||||||||||||||||
| Tanami, Northern Territory (21) | 100 | % | 13,000 | 5.18 | 2,170 | 20,200 | 5.39 | 3,510 | 33,200 | 5.31 | 5,680 | 97 | % | 26,600 | 5.51 | 4,690 | ||||||||||||||
| Kalgoorlie Open Pit and Underground (22) | 50 | % | 3,700 | 1.94 | 230 | 20,400 | 2.04 | 1,330 | 24,100 | 2.02 | 1,560 | 83 | % | 29,000 | 2.13 | 1,990 | ||||||||||||||
| Kalgoorlie Stockpiles (16) | 50 | % | 13,500 | 1.06 | 460 | 51,500 | 0.68 | 1,120 | 65,000 | 0.76 | 1,580 | 74 | % | 67,300 | 0.77 | 1,660 | ||||||||||||||
| Total Kalgoorlie, Western Australia (23) | 17,200 | 1.24 | 690 | 71,900 | 1.06 | 2,450 | 89,100 | 1.10 | 3,140 | 78 | % | 96,300 | 1.18 | 3,650 | ||||||||||||||||
| TOTAL AUSTRALIA | 268,900 | 0.95 | 8,200 | 419,700 | 0.93 | 12,550 | 688,600 | 0.94 | 20,750 | 86 | % | 696,600 | 0.92 | 20,690 | ||||||||||||||||
| Africa | ||||||||||||||||||||||||||||||
| Ahafo South Open Pits (24) | 100 | % | 12,300 | 2.39 | 940 | 44,900 | 1.76 | 2,550 | 57,200 | 1.90 | 3,490 | 90 | % | 64,600 | 1.97 | 4,100 | ||||||||||||||
| Ahafo Underground (25) | 100 | % | 1,300 | 4.80 | 210 | 13,200 | 3.13 | 1,330 | 14,500 | 3.29 | 1,540 | 94 | % | 7,500 | 4.74 | 1,150 | ||||||||||||||
| Ahafo Stockpiles (16) | 100 | % | 38,300 | 0.92 | 1,140 | — | — | 38,300 | 0.92 | 1,140 | 88 | % | 38,000 | 0.92 | 1,130 | |||||||||||||||
| Total Ahafo South, Ghana | 51,900 | 1.37 | 2,290 | 58,100 | 2.08 | 3,880 | 110,000 | 1.74 | 6,170 | 91 | % | 110,100 | 1.80 | 6,380 | ||||||||||||||||
| Ahafo North, Ghana (26) | 100 | % | — | — | 45,100 | 2.40 | 3,470 | 45,100 | 2.40 | 3,470 | 91 | % | 43,500 | 2.39 | 3,350 | |||||||||||||||
| Akyem Open Pit (27) | 100 | % | 18,300 | 1.65 | 970 | 20,600 | 1.74 | 1,150 | 38,900 | 1.70 | 2,120 | 90 | % | 34,200 | 1.69 | 1,860 | ||||||||||||||
| Akyem Stockpiles (16) | 100 | % | 16,400 | 0.88 | 460 | — | — | 16,400 | 0.88 | 460 | 84 | % | 12,900 | 0.90 | 380 | |||||||||||||||
| Total Akyem, Ghana | 34,700 | 1.29 | 1,430 | 20,600 | 1.74 | 1,150 | 55,300 | 1.46 | 2,580 | 89 | % | 47,100 | 1.47 | 2,240 | ||||||||||||||||
| TOTAL AFRICA | 86,600 | 1.33 | 3,720 | 123,800 | 2.14 | 8,500 | 210,400 | 1.81 | 12,220 | 91 | % | 200,700 | 1.85 | 11,970 | ||||||||||||||||
| Nevada | ||||||||||||||||||||||||||||||
| NGM Open Pits, Nevada | 38.5 | % | 9,900 | 1.81 | 570 | 141,800 | 1.18 | 5,370 | 151,700 | 1.22 | 5,940 | 83 | % | — | — | |||||||||||||||
| NGM Stockpiles, Nevada (16) | 38.5 | % | 37,100 | 2.38 | 2,830 | — | — | 37,100 | 2.38 | 2,830 | 73 | % | — | — | ||||||||||||||||
| NGM Underground, Nevada | 38.5 | % | 14,900 | 10.49 | 5,000 | 15,400 | 9.81 | 4,830 | 30,300 | 10.14 | 9,830 | 83 | % | — | — | |||||||||||||||
| Total NGM, Nevada (28) | 61,900 | 4.24 | 8,400 | 157,200 | 2.02 | 10,200 | 219,100 | 2.64 | 18,600 | 81 | % | — | — | |||||||||||||||||
| Carlin Open Pits | 100 | % | — | — | — | — | — | — | 108,700 | 1.63 | 5,690 | |||||||||||||||||||
| Carlin Leach Pad (5) | 100 | % | — | — | — | — | — | — | 66,800 | 0.30 | 650 | |||||||||||||||||||
| Carlin Stockpiles (16) | 100 | % | — | — | — | — | — | — | 16,900 | 2.30 | 1,250 | |||||||||||||||||||
| Carlin Underground | 100 | % | — | — | — | — | — | — | 14,800 | 10.27 | 4,870 | |||||||||||||||||||
| Total Carlin, Nevada (29) | — | — | — | — | — | — | 207,200 | 1.87 | 12,460 | |||||||||||||||||||||
| Phoenix | 100 | % | — | — | — | — | — | — | 132,800 | 0.66 | 2,820 | |||||||||||||||||||
| Lone Tree | 100 | % | — | — | — | — | — | — | 3,600 | 0.29 | 30 | |||||||||||||||||||
| Total Phoenix, Nevada (29) | — | — | — | — | — | — | 136,400 | 0.65 | 2,850 | |||||||||||||||||||||
| Turquoise Ridge (30) | 25 | % | — | — | — | — | — | — | 5,500 | 12.97 | 2,270 | |||||||||||||||||||
| Twin Creeks | 100 | % | — | — | — | — | — | — | 24,900 | 1.66 | 1,330 | |||||||||||||||||||
| Twin Creeks Stockpiles (16) | 100 | % | — | — | — | — | — | — | 28,400 | 2.09 | 1,910 | |||||||||||||||||||
| Total Twin Creeks, Nevada (29) | — | — | — | — | — | — | 58,800 | 2.91 | 5,510 | |||||||||||||||||||||
| Long Canyon, Nevada (29) | 100 | % | — | — | — | — | — | — | 22,300 | 1.34 | 970 | |||||||||||||||||||
| TOTAL NEVADA | 61,900 | 4.24 | 8,400 | 157,200 | 2.02 | 10,200 | 219,100 | 2.64 | 18,600 | 81 | % | 424,700 | 1.60 | 21,790 | ||||||||||||||||
| TOTAL NEWMONT | 701,100 | 1.31 | 29,550 | 2,277,300 | 0.96 | 70,620 | 2,978,400 | 1.05 | 100,170 | 81 | % | 1,717,100 | 1.19 | 65,440 | ||||||||||||||||
| Red Lake, Canada (6) | 100 | % | 900 | 8.69 | 260 | 3,700 | 8.68 | 1,040 | 4,600 | 8.68 | 1,300 | 94 | % | — | — | |||||||||||||||
| Kalgoorlie, Western Australia (23) | 50 | % | 17,200 | 1.24 | 690 | 71,900 | 1.06 | 2,450 | 89,100 | 1.10 | 3,140 | 78 | % | 96,300 | 1.18 | 3,650 | ||||||||||||||
| TOTAL NEWMONT ADJUSTED | 683,000 | 1.30 | 28,600 | 2,201,700 | 0.95 | 67,130 | 2,884,700 | 1.03 | 95,730 | 82 | % | 1,620,800 | 1.19 | 61,790 |
| (1) | See cautionary statement regarding reserves and resources on page 12 hereof. 2019 and 2018 reserves were calculated at a gold price of $1,200 per ounce unless otherwise noted. | |
| (2) | Tonnages include allowances for losses resulting from mining methods. Tonnages are rounded to the nearest 100,000. | |
| (3) | Ounces are estimates of metal contained in ore tonnages and do not include allowances for processing losses. Metallurgical recovery rates represent the estimated amount of metal to be recovered through metallurgical extraction processes. Ounces may not recalculate as they are rounded to the nearest 10,000. | |
| (4) | Cut-off grades utilized in 2019 reserves were as follows: oxide mill material not less than 1.03 gram per tonne and leach material not less than 0.24 gram per tonne. | |
| (5) | Leach pad material is the material on leach pads at the end of the year from which gold remains to be recovered. In-process reserves are reported separately where ounces exceed 100,000 and are greater than 5% of the total site-reported reserves. | |
| (6) | Red Lake was classified as held for sale as of December 31, 2019. Cut-off grade utilized in 2019 reserves not less than 6.75 gram per tonne. | |
| (7) | Cut-off grade utilized in 2019 reserves not less than 3.70 gram per tonne. | |
| (8) | Cut-off grade utilized in 2019 reserves not less than 4.06 gram per tonne. | |
| (9) | Cut-off grade utilized in 2019 reserves not less than 0.52 gram per tonne. | |
| (10) | Cut-off grade utilized in 2019 reserves not less than 4.80 gram per tonne. | |
| (11) | Gold cut-off grade varies with level of silver, lead and zinc credits. | |
| (12) | Gold cut-off grades utilized in 2019 reserves were as follows: oxide leach material not less than 0.12 gram per tonne; oxide mill material not less than 0.49 gram per tonne; and refractory mill material not less than 1.45 gram per tonne. | |
| (13) | Gold cut-off grades utilized in 2019 reserves not less than 1.86 gram per tonne. | |
| (14) | Cut-off grade utilized in 2019 reserves not less than 0.38 gram per tonne. | |
| (15) | Cut-off grade utilized in 2019 reserves not less than 5.00 gram per tonne. | |
| (16) | Stockpiles are comprised primarily of material that has been set aside to allow processing of higher grade material in the mills. Stockpiles increase or decrease depending on current mine plans. Stockpile reserves are reported separately where ounces exceed 100,000 and are greater than 5% of the total site-reported reserves. | |
| (17) | The Pueblo Viejo mine, which is 40 percent owned by Newmont, is accounted for as an equity method investment. Reserve estimates provided by Barrick, the operator of Pueblo Viejo. | |
| (18) | Project is currently undeveloped. Reserve estimates provided by the NuevaUnión joint venture. | |
| (19) | Project is currently undeveloped. Reserve estimates provided by the Norte Abierto joint venture | |
| (20) | Gold cut-off grade varies with level of copper credits. | |
| (21) | Cut-off grade utilized in 2019 reserves not less than 1.60 gram per tonne. | |
| (22) | Cut-off grade utilized in 2019 in situ reserves not less than 0.90 gram per tonne. | |
| (23) | Kalgoorlie was classified as held for sale as of December 31, 2019. | |
| (24) | Cut-off grade utilized in 2019 reserves not less than 0.68 gram per tonne. | |
| (25) | Cut-off grade utilized in 2019 reserves not less than 1.60 gram per tonne. | |
| (26) | Includes undeveloped reserves in the Ahafo trend totaling 3.4 million ounces. Cut-off grade utilized in 2019 reserves not less than 0.51 gram per tonne. | |
| (27) | Cut-off grade utilized in 2019 reserves not less than 0.59 gram per tonne. | |
| (28) | Reserve estimates provided by Barrick, the operator of the NGM joint venture. | |
| (29) | Property was contributed to NGM on July 1, 2019. | |
| (30) | Reserve estimates provided by Barrick, the operator of the Turquoise Ridge joint venture. | |
| Attributable Gold Mineral Resources (1)(2) – December 31, 2019, Metric Units | |||||||||||||||||||||||||||
| Measured Resource | Indicated Resource | Measured and Indicated Resource (3) | Inferred Resource | ||||||||||||||||||||||||
| Newmont | Tonnage | Grade | Gold | Tonnage | Grade | Gold | Tonnage | Grade | Gold | Tonnage | Grade | Gold | |||||||||||||||
| Deposits/Districts | Share | (x1000 tonnes) | (g/tonne) | (x1000 ozs) | (x1000 tonnes) | (g/tonne) | (x1000 ozs) | (x1000 tonnes) | (g/tonne) | (x1000 ozs) | (x1000 tonnes) | (g/tonne) | (x1000 ozs) | ||||||||||||||
| North America | |||||||||||||||||||||||||||
| CC&V,Colorado | 100 | % | 67,100 | 0.50 | 1,080 | 43,600 | 0.44 | 620 | 110,700 | 0.48 | 1,700 | 16,800 | 0.39 | 210 | |||||||||||||
| Red Lake, Canada (4) | 100 | % | 300 | 24.09 | 210 | 1,000 | 15.55 | 490 | 1,300 | 17.36 | 700 | 1,600 | 18.04 | 910 | |||||||||||||
| Musselwhite, Canada | 100 | % | 1,800 | 4.04 | 230 | 4,600 | 4.09 | 600 | 6,400 | 4.08 | 830 | 3,200 | 4.37 | 440 | |||||||||||||
| Porcupine Underground | 100 | % | 100 | 6.28 | 20 | 700 | 4.34 | 110 | 800 | 4.58 | 130 | 1,000 | 5.78 | 180 | |||||||||||||
| Porcupine Open Pit | 100 | % | 2,700 | 1.17 | 100 | 248,400 | 0.89 | 7,130 | 251,100 | 0.90 | 7,230 | 108,200 | 0.70 | 2,430 | |||||||||||||
| Total Porcupine, Canada | 2,800 | 1.33 | 120 | 249,100 | 0.90 | 7,240 | 251,900 | 0.91 | 7,360 | 109,200 | 0.74 | 2,610 | |||||||||||||||
| Éléonore, Canada | 100 | % | 300 | 4.39 | 40 | 2,500 | 4.57 | 370 | 2,800 | 4.55 | 410 | 3,400 | 5.21 | 580 | |||||||||||||
| Peñasquito, Mexico | 100 | % | 37,300 | 0.25 | 300 | 304,000 | 0.25 | 2,440 | 341,300 | 0.25 | 2,740 | 193,600 | 0.34 | 2,090 | |||||||||||||
| Noche Buena, Mexico | 50 | % | — | — | 27,500 | 0.37 | 330 | 27,500 | 0.37 | 330 | 2,500 | 0.22 | 20 | ||||||||||||||
| Sandman, Nevada | 100 | % | — | — | 1,200 | 1.23 | 50 | 1,200 | 1.23 | 50 | 1,100 | 1.85 | 60 | ||||||||||||||
| Coffee, Canada | 100 | % | 5,200 | 1.76 | 300 | 41,100 | 1.42 | 1,870 | 46,300 | 1.46 | 2,170 | 11,800 | 1.32 | 500 | |||||||||||||
| Galore Creek, Canada (5) | 50 | % | 128,400 | 0.36 | 1,510 | 423,400 | 0.23 | 3,120 | 551,800 | 0.26 | 4,630 | 99,100 | 0.21 | 670 | |||||||||||||
| TOTAL NORTH AMERICA | 243,200 | 0.48 | 3,790 | 1,098,000 | 0.49 | 17,130 | 1,341,200 | 0.49 | 20,920 | 442,300 | 0.57 | 8,090 | |||||||||||||||
| South America | |||||||||||||||||||||||||||
| Conga, Peru | 51.35 | % | — | — | 356,300 | 0.65 | 7,490 | 356,300 | 0.65 | 7,490 | 118,400 | 0.39 | 1,480 | ||||||||||||||
| Yanacocha | 51.35 | % | 5,800 | 0.75 | 140 | 33,300 | 0.43 | 460 | 39,100 | 0.48 | 600 | 92,400 | 0.84 | 2,490 | |||||||||||||
| Yanacocha Underground | 51.35 | % | — | — | 1,600 | 6.50 | 330 | 1,600 | 6.50 | 330 | 5,100 | 3.54 | 580 | ||||||||||||||
| Total Yanacocha, Peru | 5,800 | 0.75 | 140 | 34,900 | 0.70 | 790 | 40,700 | 0.71 | 930 | 97,500 | 0.98 | 3,070 | |||||||||||||||
| Merian, Suriname | 75 | % | 6,400 | 1.01 | 200 | 30,500 | 1.15 | 1,130 | 36,900 | 1.12 | 1,330 | 22,300 | 1.05 | 750 | |||||||||||||
| Cerro Negro, Argentina | 100 | % | 2,800 | 3.52 | 330 | 9,300 | 6.02 | 1,790 | 12,100 | 5.43 | 2,120 | 700 | 5.78 | 150 | |||||||||||||
| Pueblo Viejo, Dominican Republic (6) | 40 | % | 11,300 | 2.25 | 820 | 77,100 | 2.22 | 5,490 | 88,400 | 2.22 | 6,310 | 21,700 | 2.10 | 1,470 | |||||||||||||
| NuevaUnión, Chile (7) | 50 | % | 3,300 | 0.31 | 30 | 75,900 | 0.62 | 1,520 | 79,200 | 0.61 | 1,550 | 266,900 | 0.37 | 3,190 | |||||||||||||
| Norte Abierto, Chile (8) | 50 | % | 77,300 | 0.61 | 1,500 | 596,900 | 0.49 | 9,310 | 674,200 | 0.50 | 10,810 | 369,600 | 0.37 | 4,370 | |||||||||||||
| Alumbrera, Argentina (9) | 37.5 | % | 45,700 | 0.37 | 530 | 6,700 | 0.51 | 110 | 52,400 | 0.38 | 640 | 2,700 | 0.45 | 40 | |||||||||||||
| TOTAL SOUTH AMERICA | 152,600 | 0.73 | 3,550 | 1,187,600 | 0.72 | 27,630 | 1,340,200 | 0.72 | 31,180 | 899,800 | 0.50 | 14,520 | |||||||||||||||
| Australia | |||||||||||||||||||||||||||
| Boddington, Western Australia | 100 | % | 101,300 | 0.55 | 1,800 | 257,300 | 0.54 | 4,480 | 358,600 | 0.55 | 6,280 | 6,200 | 0.45 | 90 | |||||||||||||
| Tanami, Northern Territory | 100 | % | 200 | 3.37 | 20 | 17,500 | 2.21 | 1,240 | 17,700 | 2.22 | 1,260 | 14,900 | 4.52 | 2,160 | |||||||||||||
| Kalgoorlie, Western Australia (10) | 50 | % | 6,000 | 1.46 | 280 | 28,400 | 1.75 | 1,610 | 34,400 | 1.70 | 1,890 | 12,800 | 2.34 | 960 | |||||||||||||
| TOTAL AUSTRALIA | 107,500 | 0.61 | 2,100 | 303,200 | 0.75 | 7,330 | 410,700 | 0.71 | 9,430 | 33,900 | 2.96 | 3,210 | |||||||||||||||
| Africa | |||||||||||||||||||||||||||
| Ahafo South | 100 | % | 1,000 | 0.62 | 20 | 25,100 | 1.22 | 980 | 26,100 | 1.19 | 1,000 | 8,400 | 1.45 | 400 | |||||||||||||
| Ahafo Underground | 100 | % | — | — | 15,900 | 3.93 | 2,020 | 15,900 | 3.93 | 2,020 | 11,300 | 3.35 | 1,220 | ||||||||||||||
| Total Ahafo South, Ghana | 1,000 | 0.62 | 20 | 41,000 | 2.28 | 3,000 | 42,000 | 2.24 | 3,020 | 19,700 | 2.56 | 1,620 | |||||||||||||||
| Ahafo North Open Pits, Ghana | 100 | % | 2,100 | 1.23 | 80 | 8,200 | 1.99 | 530 | 10,300 | 1.84 | 610 | 7,200 | 1.78 | 410 | |||||||||||||
| Akyem Open Pits | 100 | % | 1,300 | 0.55 | 20 | 1,800 | 0.55 | 30 | 3,100 | 0.55 | 50 | 2,900 | 1.40 | 130 | |||||||||||||
| Akyem Underground | 100 | % | — | — | 3,800 | 4.16 | 510 | 3,800 | 4.16 | 510 | 2,400 | 3.62 | 280 | ||||||||||||||
| Akyem, Ghana | 1,300 | 0.55 | 20 | 5,600 | 3.00 | 540 | 6,900 | 2.52 | 560 | 5,300 | 2.41 | 410 | |||||||||||||||
| TOTAL AFRICA | 4,400 | 0.89 | 120 | 54,800 | 2.30 | 4,070 | 59,200 | 2.20 | 4,190 | 32,200 | 2.35 | 2,440 | |||||||||||||||
| Nevada | |||||||||||||||||||||||||||
| NGM Open Pits, Nevada | 38.5 | % | 10,200 | 1.49 | 490 | 130,200 | 1.10 | 4,610 | 140,400 | 1.13 | 5,100 | 50,100 | 0.83 | 1,340 | |||||||||||||
| NGM Underground, Nevada | 38.5 | % | 7,700 | 5.85 | 1,440 | 19,900 | 6.96 | 4,480 | 27,600 | 6.65 | 5,920 | 6,700 | 8.04 | 1,690 | |||||||||||||
| Total NGM, Nevada (11) | 17,900 | 3.37 | 1,930 | 150,100 | 1.88 | 9,090 | 168,000 | 2.04 | 11,020 | 56,800 | 1.67 | 3,030 | |||||||||||||||
| TOTAL NEVADA | 17,900 | 3.37 | 1,930 | 150,100 | 1.88 | 9,090 | 168,000 | 2.04 | 11,020 | 56,800 | 1.67 | 3,030 | |||||||||||||||
| TOTAL NEWMONT | 525,600 | 0.68 | 11,490 | 2,793,700 | 0.73 | 65,250 | 3,319,300 | 0.72 | 76,740 | 1,465,000 | 0.66 | 31,290 | |||||||||||||||
| Red Lake, Canada (4) | 100 | % | 300 | 24.09 | 210 | 1,000 | 15.55 | 490 | 1,300 | 17.36 | 700 | 1,600 | 18.04 | 910 | |||||||||||||
| Kalgoorlie, Western Australia (10) | 50 | % | 6,000 | 1.46 | 280 | 28,400 | 1.75 | 1,610 | 34,400 | 1.70 | 1,890 | 12,800 | 2.34 | 960 | |||||||||||||
| TOTAL NEWMONT ADJUSTED | 519,300 | 0.66 | 11,000 | 2,764,300 | 0.71 | 63,150 | 3,283,600 | 0.70 | 74,150 | 1,450,600 | 0.63 | 29,420 |
| (1) | Resources are reported exclusive of reserves. | |
| (2) | Resources are calculated at a gold price of $1,400 per ounce for 2019 and 2018. Tonnage amounts have been rounded to the nearest 100,000. Ounces may not recalculate as they have been rounded to the nearest 10,000. | |
| (3) | Measured and Indicated Resources (combined) are equivalent to Mineralized Material disclosed in Newmont’s 10-K filing. | |
| (4) | Red Lake was classified as held for sale as of December 31, 2019. | |
| (5) | Project is currently undeveloped. Resource estimates provided by Teck. | |
| (6) | Resource estimates provided by Barrick, the operator of Pueblo Viejo. | |
| (7) | Project is currently undeveloped. Resource estimates provided by the NuevaUnión joint venture. | |
| (8) | Project is currently undeveloped. Resource estimates provided by the Norte Abierto joint venture. | |
| (9) | Resource estimates provided by Glencore. | |
| (10) | Kalgoorlie was classified as held for sale as of December 31, 2019. | |
| (11) | Resource estimates provided by Barrick, the operator of the NGM joint venture. | |
| Attributable Copper Reserves (1) Metric Units | ||||||||||||||||||||||||||||||||||
| December 31, 2019 | December 31, 2018 | |||||||||||||||||||||||||||||||||
| Proven Reserves | Probable Reserves | Proven and Probable Reserves | Proven and Probable Reserves | |||||||||||||||||||||||||||||||
| Newmont | Tonnage (2) | Grade | Copper (3) | Tonnage (2) | Grade | Copper (3) | Tonnage (2) | Grade | Copper (3) | Metallurgical | Tonnage (2) | Grade | Copper (3) | |||||||||||||||||||||
| Deposits/Districts | Share | (x1000 tonnes) | (Cu %) | (Tonnes) | (x1000 tonnes) | (Cu %) | (Tonnes) | (x1000 tonnes) | (Cu %) | (Tonnes) | Recovery | (x1000 tonnes) | (Cu %) | (Tonnes) | ||||||||||||||||||||
| South America | ||||||||||||||||||||||||||||||||||
| Yanacocha Open Pits and Underground, Peru (4) | 51.35 | % | — | — | 53,600 | 0.63 | % | 340,000 | 53,600 | 0.63 | % | 340,000 | 83 | % | 53,600 | 0.63 | % | 340,000 | ||||||||||||||||
| NuevaUnión, Chile (5) | 50 | % | — | — | 1,118,000 | 0.40 | % | 4,420,000 | 1,118,000 | 0.40 | % | 4,420,000 | 88 | % | — | — | ||||||||||||||||||
| Norte Abierto, Chile (6) | 50 | % | — | — | 598,800 | 0.22 | % | 1,310,000 | 598,800 | 0.22 | % | 1,310,000 | 87 | % | — | — | ||||||||||||||||||
| TOTAL SOUTH AMERICA | — | — | 1,770,400 | 0.34 | % | 6,070,000 | 1,770,400 | 0.34 | % | 6,070,000 | 87 | % | 53,600 | 0.63 | % | 340,000 | ||||||||||||||||||
| Australia | ||||||||||||||||||||||||||||||||||
| Boddington Open Pit, Western Australia (7) | 100 | % | 234,800 | 0.09 | % | 220,000 | 246,200 | 0.11 | % | 270,000 | 481,000 | 0.10 | % | 490,000 | 78 | % | 480,700 | 0.10 | % | 490,000 | ||||||||||||||
| Boddington Stockpiles, Western Australia (8) | 100 | % | 3,900 | 0.09 | % | — | 81,400 | 0.09 | % | 70,000 | 85,300 | 0.09 | % | 70,000 | 72 | % | 93,000 | 0.08 | % | 70,000 | ||||||||||||||
| TOTAL AUSTRALIA | 238,700 | 0.09 | % | 220,000 | 327,600 | 0.10 | % | 340,000 | 566,300 | 0.10 | % | 560,000 | 78 | % | 573,700 | 0.10 | % | 560,000 | ||||||||||||||||
| Nevada | ||||||||||||||||||||||||||||||||||
| NGM, Nevada (9) | 38.5 | % | 17,100 | 0.19 | % | 30,000 | 80,000 | 0.17 | % | 140,000 | 97,100 | 0.18 | % | 170,000 | 65 | % | — | — | ||||||||||||||||
| Phoenix, Nevada (10) | 100 | % | — | — | — | — | — | — | 220,500 | 0.18 | % | 400,000 | ||||||||||||||||||||||
| TOTAL NEVADA | 17,100 | 0.19 | % | 30,000 | 80,000 | 0.17 | % | 140,000 | 97,100 | 0.18 | % | 170,000 | 65 | % | 220,500 | 0.18 | % | 400,000 | ||||||||||||||||
| TOTAL NEWMONT | 255,800 | 0.10 | % | 250,000 | 2,178,000 | 0.30 | % | 6,550,000 | 2,433,800 | 0.28 | % | 6,800,000 | 86 | % | 847,800 | 0.15 | % | 1,300,000 |
| (1) | See footnote (1) to the Gold Reserves table above. Copper reserves for 2019 were calculated at a copper price of $2.75 per pound. Copper reserves for 2018 were calculated at a copper price of $2.50 per pound. | |
| (2) | See footnote (2) to the Gold Reserves table above. Tonnages are rounded to nearest 100,000. | |
| (3) | See footnote (3) to the Gold Reserves table above. Tonnes may not recalculate as they are rounded to the nearest 10,000. | |
| (4) | Copper cut-off grade varies with level of gold and silver credits. | |
| (5) | Project is currently undeveloped. Reserve estimates provided by the NuevaUnión joint venture. | |
| (6) | Project is currently undeveloped. Reserve estimates provided by the Norte Abierto joint venture. | |
| (7) | Copper cut-off grade varies with level of gold credits. | |
| (8) | Stockpiles are comprised primarily of material that has been set aside to allow processing of higher grade material in the mills. Stockpiles increase or decrease depending on current mine plans. Stockpiles are reported separately where pounds exceed 100 million and are greater than 5% of the total site reported reserves. | |
| (9) | Reserve estimates provided by Barrick, the operator of the NGM joint venture. | |
| (10) | Property was contributed to NGM on July 1, 2019. | |
| Attributable Copper Mineral Resources (1)(2) – December 31, 2019, Metric Units | |||||||||||||||||||||||||||||||
| Measured Resource | Indicated Resource | Measured and Indicated Resource (3) | Inferred Resource | ||||||||||||||||||||||||||||
| Newmont | Tonnage | Grade | Copper | Tonnage | Grade | Copper | Tonnage | Grade | Copper | Tonnage | Grade | Copper | |||||||||||||||||||
| Deposits/Districts | Share | (x1000 tonnes) | (Cu%) | (tonnes) | (x1000 tonnes) | (Cu%) | (tonnes) | (x1000 tonnes) | (Cu%) | (tonnes) | (x1000 tonnes) | (Cu%) | (tonnes) | ||||||||||||||||||
| North America | |||||||||||||||||||||||||||||||
| Galore Creek, Canada (4) | 50 | % | 128,400 | 0.72 | % | 920,000 | 423,400 | 0.39 | % | 1,640,000 | 551,800 | 0.47 | % | 2,560,000 | 99,100 | 0.27 | % | 260,000 | |||||||||||||
| TOTAL NORTH AMERICA | 128,400 | 0.72 | % | 920,000 | 423,400 | 0.39 | % | 1,640,000 | 551,800 | 0.47 | % | 2,560,000 | 99,100 | 0.27 | % | 260,000 | |||||||||||||||
| South America | |||||||||||||||||||||||||||||||
| Conga, Peru | 51.35 | % | — | — | 356,300 | 0.26 | % | 930,000 | 356,300 | 0.26 | % | 930,000 | 118,400 | 0.19 | % | 220,000 | |||||||||||||||
| Yanacocha Open Pits and Stockpiles | 51.35 | % | 1,600 | 0.32 | % | 10,000 | 1,300 | 0.33 | % | — | 2,900 | 0.32 | % | 10,000 | 2,000 | 0.44 | % | 10,000 | |||||||||||||
| Yanacocha Underground | 51.35 | % | — | — | 1,600 | 0.07 | % | — | 1,600 | 0.07 | % | — | 5,100 | 0.12 | % | — | |||||||||||||||
| Total Yanacocha, Peru | 1,600 | 0.32 | % | 10,000 | 2,900 | 0.16 | % | — | 4,500 | 0.20 | % | 10,000 | 7,100 | 0.19 | % | 10,000 | |||||||||||||||
| NuevaUnión, Chile (5) | 50 | % | 162,800 | 0.19 | % | 310,000 | 307,400 | 0.33 | % | 1,010,000 | 470,200 | 0.28 | % | 1,320,000 | 629,200 | 0.37 | % | 2,310,000 | |||||||||||||
| Norte Abierto, Chile (6) | 50 | % | 57,600 | 0.24 | % | 140,000 | 551,200 | 0.19 | % | 1,060,000 | 608,800 | 0.20 | % | 1,200,000 | 361,800 | 0.18 | % | 650,000 | |||||||||||||
| Alumbrera, Argentina (7) | 37.5 | % | 45,700 | 0.37 | % | 170,000 | 6,700 | 0.25 | % | 20,000 | 52,400 | 0.36 | % | 190,000 | 2,700 | 0.21 | % | — | |||||||||||||
| TOTAL SOUTH AMERICA | 267,700 | 0.23 | % | 630,000 | 1,224,500 | 0.25 | % | 3,020,000 | 1,492,200 | 0.24 | % | 3,650,000 | 1,119,200 | 0.29 | % | 3,190,000 | |||||||||||||||
| Australia | |||||||||||||||||||||||||||||||
| Boddington, Western Australia | 100 | % | 101,300 | 0.11 | % | 110,000 | 257,300 | 0.12 | % | 300,000 | 358,600 | 0.12 | % | 410,000 | 6,200 | 0.09 | % | — | |||||||||||||
| TOTAL AUSTRALIA | 101,300 | 0.11 | % | 110,000 | 257,300 | 0.12 | % | 300,000 | 358,600 | 0.12 | % | 410,000 | 6,200 | 0.09 | % | — | |||||||||||||||
| Nevada | |||||||||||||||||||||||||||||||
| NGM, Nevada (8) | 38.5 | % | 9,800 | 0.16 | % | 20,000 | 80,100 | 0.14 | % | 110,000 | 89,900 | 0.14 | % | 130,000 | 11,500 | 0.15 | % | 20,000 | |||||||||||||
| TOTAL NEVADA | 9,800 | 0.16 | % | 20,000 | 80,100 | 0.14 | % | 110,000 | 89,900 | 0.14 | % | 130,000 | 11,500 | 0.15 | % | 20,000 | |||||||||||||||
| TOTAL NEWMONT | 507,200 | 0.33 | % | 1,680,000 | 1,985,300 | 0.26 | % | 5,070,000 | 2,492,500 | 0.27 | % | 6,750,000 | 1,236,000 | 0.28 | % | 3,470,000 |
| (1) | Resources are reported exclusive of reserves. | |
| (2) | Resources are calculated at a copper price of $3.25 per pound for 2019 and 2018. Tonnage amounts have been rounded to the nearest 100,000. | |
| (3) | Measured and Indicated Resources (combined) are equivalent to Mineralized Material disclosed in Newmont’s Form 10-K filing. | |
| (4) | Project is currently undeveloped. Resource estimates provided by Teck. | |
| (5) | Project is currently undeveloped. Resource estimates provided by the NuevaUnión joint venture. | |
| (6) | Project is currently undeveloped. Resource estimates provided by the Norte Abierto joint venture. | |
| (7) | Resource estimates provided by Glencore. | |
| (8) | Resource estimates provided by Barrick, the operator of the NGM joint venture. | |
| Attributable Proven, Probable and Combined Silver Reserves (1) Metric Units | ||||||||||||||||||||||||||||
| December 31, 2019 | December 31, 2018 | |||||||||||||||||||||||||||
| Proven Reserves | Probable Reserves | Proven and Probable Reserves | Proven and Probable Reserves | |||||||||||||||||||||||||
| Newmont | Tonnage (2) | Grade | Silver (3) | Tonnage (2) | Grade | Silver (3) | Tonnage (2) | Grade | Silver (3) | Metallurgical | Tonnage (2) | Grade | Silver (3) | |||||||||||||||
| Deposits/Districts | Share | (x1000 tonnes) | (g/tonne) | (x1000 ozs) | (x1000 tonnes) | (g/tonne) | (x1000 ozs) | (x1000 tonnes) | (g/tonne) | (x1000 ozs) | Recovery (3) | (x1000 tonnes) | (g/tonne) | (x1000 ozs) | ||||||||||||||
| North America | ||||||||||||||||||||||||||||
| Peñasquito Open Pits, Mexico (4) | 100% | 105,200 | 37.43 | 126,630 | 304,500 | 32.25 | 315,830 | 409,700 | 33.58 | 442,460 | 90% | — | — | |||||||||||||||
| Peñasquito Stockpiles, Mexico (5) | 100% | 4,500 | 53.29 | 7,730 | 27,300 | 24.10 | 21,170 | 31,800 | 28.24 | 28,900 | 86% | — | — | |||||||||||||||
| TOTAL NORTH AMERICA | 109,700 | 38.08 | 134,360 | 331,800 | 31.58 | 337,000 | 441,500 | 33.20 | 471,360 | 89% | — | — | ||||||||||||||||
| South America | ||||||||||||||||||||||||||||
| Yanacocha Open Pits and Underground, Peru (6) | 51.35% | 4,500 | 10.22 | 1,500 | 56,700 | 18.43 | 33,600 | 61,200 | 17.84 | 35,100 | 46% | 66,600 | 16.73 | 35,820 | ||||||||||||||
| Yanacocha Stockpiles, Peru (5) | 51.35% | 1,200 | 39.85 | 1,640 | 1,400 | 41.74 | 1,920 | 2,600 | 40.85 | 3,560 | 58% | 3,600 | 39.20 | 4,510 | ||||||||||||||
| Yanacocha Leach Pads, Peru (7) | 51.35% | — | — | 53,000 | 8.19 | 13,950 | 53,000 | 8.19 | 13,950 | 6% | 49,600 | 8.50 | 13,460 | |||||||||||||||
| Total Yanacocha, Peru | 5,700 | 17.13 | 3,140 | 111,100 | 13.85 | 49,470 | 116,800 | 14.01 | 52,610 | 36% | 119,800 | 53,790 | ||||||||||||||||
| Cerro Negro, Argentina (8) | 100% | 1,100 | 98.48 | 3,400 | 7,300 | 76.70 | 17,940 | 8,400 | 79.51 | 21,340 | 75% | — | — | |||||||||||||||
| Pueblo Viejo, Dominican Republic (9) | 40% | 6,700 | 14.45 | 3,130 | 40,900 | 16.30 | 21,440 | 47,600 | 16.04 | 24,570 | 77% | — | — | |||||||||||||||
| NuevaUnión, Chile (10) | 50% | — | — | 776,900 | 1.54 | 38,440 | 776,900 | 1.54 | 38,440 | 65% | — | — | ||||||||||||||||
| Norte Abierto, Chile (11) | 50% | — | — | 598,800 | 1.52 | 29,340 | 598,800 | 1.52 | 29,340 | 74% | — | — | ||||||||||||||||
| TOTAL SOUTH AMERICA | 13,500 | 22.04 | 9,670 | 1,535,000 | 3.17 | 156,630 | 1,548,500 | 3.34 | 166,300 | 60% | 119,800 | 14.00 | 53,790 | |||||||||||||||
| Nevada | ||||||||||||||||||||||||||||
| NGM, Nevada (12) | 38.5% | 5,800 | 8.18 | 1,550 | 58,800 | 6.99 | 13,210 | 64,600 | 7.10 | 14,760 | 38% | — | — | |||||||||||||||
| Phoenix, Nevada (13) | 100% | — | — | — | — | — | 0.00 | — | 0% | 132,800 | 7.50 | 31,910 | ||||||||||||||||
| TOTAL NEVADA | 5,800 | 8.18 | 1,550 | 58,800 | 6.99 | 13,210 | 64,600 | 7.10 | 14,760 | 38% | 132,800 | 7.50 | 31,910 | |||||||||||||||
| TOTAL NEWMONT | 129,000 | 35.03 | 145,580 | 1,925,600 | 8.19 | 506,840 | 2,054,600 | 9.88 | 652,420 | 76% | 252,600 | 10.60 | 85,700 |
| (1) | See footnote (1) to the Gold Reserves table above. Silver reserves for 2019 and 2018 were calculated at a silver price of $16 per ounce. | |
| (2) | See footnote (2) to the Gold Reserves table above. Tonnages are rounded to nearest 100,000. | |
| (3) | See footnote (3) to the Gold Reserves table above. Ounces may not recalculate as they are rounded to the nearest 10,000. | |
| (4) | Silver cut-off grade varies with gold, lead and zinc credits. | |
| (5) | Stockpiles are comprised primarily of material that has been set aside to allow processing of higher grade material in the mills. Stockpiles increase or decrease depending on current mine plans. Stockpile reserves are reported separately where ounces exceed 100,000 and are greater than 5% of the total site-reported reserves. | |
| (6) | Silver cut-off grade varies with gold and copper credits. | |
| (7) | Leach Pad material is the material on leach pads at the end of the year from which silver remains to be recovered. In-process material reserves are reported separately where tonnage or ounces are greater than 5% of the total site-reported reserves and ounces are greater than 100,000. | |
| (8) | Silver cut-off grade varies with gold credits. | |
| (9) | The Pueblo Viejo mine, which is 40 percent owned by Newmont, is accounted for as an equity method investment. Reserve estimates provided by Barrick, the operator of Pueblo Viejo. | |
| (10) | Project is currently undeveloped. Reserve estimates provided by the NuevaUnión joint venture. | |
| (11) | Project is currently undeveloped. Reserve estimates provided by the Norte Abierto joint venture. | |
| (12) | Reserve estimates provided by Barrick, the operator of the NGM joint venture. | |
| (13) | Property was contributed to NGM on July 1, 2019. | |
| Attributable Silver Mineral Resources (1)(2) – December 31, 2019, Metric Units | |||||||||||||||||||||||||||
| Measured Resource | Indicated Resource | Measured and Indicated Resource (3) | Inferred Resource | ||||||||||||||||||||||||
| Newmont | Tonnage | Grade | Silver | Tonnage | Grade | Silver | Tonnage | Grade | Silver | Tonnage | Grade | Silver | |||||||||||||||
| Deposits/Districts | Share | (x1000 tonnes) | (g/tonne) | (x1000 ozs) | (x1000 tonnes) | (g/tonne) | (x1000 ozs) | (x1000 tonnes) | (g/tonne) | (x1000 ozs) | (x1000 tonnes) | (g/tonne) | (x1000 ozs) | ||||||||||||||
| North America | |||||||||||||||||||||||||||
| Peñasquito, Mexico | 100 | % | 37,300 | 26.69 | 32,000 | 304,000 | 24.57 | 240,170 | 341,300 | 24.81 | 272,170 | 193,600 | 25.96 | 161,610 | |||||||||||||
| Noche Buena, Mexico | 50 | % | — | — | 27,500 | 12.35 | 10,920 | 27,500 | 12.35 | 10,920 | 2,500 | 8.08 | 640 | ||||||||||||||
| Sandman, Nevada | 100 | % | — | — | 1,200 | 6.83 | 260 | 1,200 | 6.83 | 260 | 1,100 | 4.12 | 140 | ||||||||||||||
| Galore Creek (4) | 50 | % | 128,400 | 5.79 | 23,900 | 423,400 | 3.75 | 51,020 | 551,800 | 4.22 | 74,920 | 99,100 | 2.65 | 8,440 | |||||||||||||
| TOTAL NORTH AMERICA | 165,700 | 10.49 | 55,900 | 756,100 | 12.44 | 302,370 | 921,800 | 12.09 | 358,270 | 296,300 | 17.93 | 170,830 | |||||||||||||||
| South America | |||||||||||||||||||||||||||
| Conga, Peru | 51.35 | % | — | — | 356,300 | 2.06 | 23,580 | 356,300 | 2.06 | 23,580 | 89,900 | 1.12 | 3,250 | ||||||||||||||
| Yanacocha Open Pits and Stockpiles | 51.35 | % | 4,600 | 2.99 | 440 | 7,800 | 12.91 | 3,250 | 12,400 | 9.25 | 3,690 | 4,400 | 28.12 | 4,020 | |||||||||||||
| Yanacocha Underground | 51.35 | % | — | — | 1,600 | 73.57 | 3,690 | 1,600 | 73.57 | 3,690 | 5,100 | 13.27 | 2,180 | ||||||||||||||
| Total Yanacocha, Peru | 4,600 | 2.99 | 440 | 9,400 | 22.96 | 6,940 | 14,000 | 16.40 | 7,380 | 9,500 | 20.30 | 6,200 | |||||||||||||||
| Cerro Negro, Argentina | 100 | % | 2,800 | 14.33 | 1,320 | 9,300 | 32.42 | 9,590 | 12,100 | 28.13 | 10,910 | 700 | 47.75 | 1,330 | |||||||||||||
| Pueblo Viejo, Dominican Republic (5) | 40 | % | 11,300 | 14.39 | 5,240 | 77,100 | 11.14 | 27,610 | 88,400 | 11.55 | 32,850 | 21,700 | 10.61 | 7,400 | |||||||||||||
| NuevaUnión, Chile (6) | 50 | % | 159,500 | 0.96 | 4,940 | 231,500 | 1.23 | 9,150 | 391,000 | 1.12 | 14,090 | 362,300 | 1.30 | 15,140 | |||||||||||||
| Norte Abierto, Chile (7) | 50 | % | 77,300 | 1.20 | 2,990 | 596,900 | 1.07 | 20,560 | 674,200 | 1.09 | 23,550 | 369,600 | 0.95 | 11,330 | |||||||||||||
| TOTAL SOUTH AMERICA | 255,500 | 1.82 | 14,930 | 1,280,500 | 2.37 | 97,430 | 1,536,000 | 2.28 | 112,360 | 853,700 | 1.63 | 44,650 | |||||||||||||||
| Nevada | |||||||||||||||||||||||||||
| NGM, Nevada (8) | 38.5 | % | 3,300 | 6.07 | 640 | 55,300 | 5.73 | 10,180 | 58,600 | 5.75 | 10,820 | 7,800 | 6.12 | 1,540 | |||||||||||||
| TOTAL NEVADA | 3,300 | 6.07 | 640 | 55,300 | 5.73 | 10,180 | 58,600 | 5.75 | 10,820 | 7,800 | 6.12 | 1,540 | |||||||||||||||
| TOTAL NEWMONT | 424,500 | 5.24 | 71,470 | 2,091,900 | 6.10 | 409,980 | 2,516,400 | 5.95 | 481,450 | 1,157,800 | 5.83 | 217,020 |
| (1) | Resources are reported exclusive of reserves. | |
| (2) | Resource for 2019 and 2018 was calculated at a silver price of $20 per ounce. Tonnage amounts have been rounded to the nearest 100,000. | |
| (3) | Measured and Indicated Resources (combined) are equivalent to Mineralized Material disclosed in Newmont’s Form 10-K filing. | |
| (4) | Project is currently undeveloped. Resource estimates provided by Teck. | |
| (5) | Resource estimates provided by Barrick, the operator of Pueblo Viejo. | |
| (6) | Project is currently undeveloped. Resource estimates provided by the NuevaUnión joint venture. | |
| (7) | Project is currently undeveloped. Resource estimates provided by the Norte Abierto joint venture. | |
| (8) | Resource estimates provided by Barrick, the operator of the NGM joint venture. |
| Attributable Zinc Reserves (1) Metric Units | |||||||||||||||||||||||||||
| December 31, 2019 | |||||||||||||||||||||||||||
| Proven Reserves | Probable Reserves | Proven and Probable Reserves | |||||||||||||||||||||||||
| Newmont | Tonnage (2) | Grade | Zinc (3) | Tonnage (2) | Grade | Zinc (3) | Tonnage (2) | Grade | Zinc (3) | Metallurgical | |||||||||||||||||
| Deposits/Districts | Share | (x1000 tonnes) | (Zn %) | (Tonnes) | (x1000 tonnes) | (Zn %) | (Tonnes) | (x1000 tonnes) | (Zn %) | (Tonnes) | Recovery | ||||||||||||||||
| North America | |||||||||||||||||||||||||||
| Peñasquito, Mexico | 100 | % | 108,100 | 0.93 | % | 1,000,000 | 330,500 | 0.71 | % | 2,360,000 | 438,600 | 0.77 | % | 3,360,000 | 81 | % | |||||||||||
| TOTAL NEWMONT | 108,100 | 0.93 | % | 1,000,000 | 330,500 | 0.71 | % | 2,360,000 | 438,600 | 0.77 | % | 3,360,000 | 81 | % |
| (1) | See footnote (1) to the Gold Reserves table above. Zinc reserves for 2019 were calculated at a zinc price of $1.20 per pound. | |
| (2) | See footnote (2) to the Gold Reserves table above. Tonnages are rounded to nearest 100,000. | |
| (3) | See footnote (3) to the Gold Reserves table above. Tonnes may not recalculate as they are rounded to the nearest 10,000. | |
| Attributable Zinc Resources (1)(2) – December 31, 2019, Metric Units | |||||||||||||||||||||||||||||||
| Measured Resource | Indicated Resource | Measured and Indicated Resource (3) | Inferred Resource | ||||||||||||||||||||||||||||
| Newmont | Tonnage | Grade | Zinc | Tonnage | Grade | Zinc | Tonnage | Grade | Zinc | Tonnage | Grade | Zinc | |||||||||||||||||||
| Deposits/Districts | Share | (x1000 tonnes) | (Zn%) | (tonnes) | (x1000 tonnes) | (Zn%) | (tonnes) | (x1000 tonnes) | (Zn%) | (tonnes) | (x1000 tonnes) | (Zn%) | (tonnes) | ||||||||||||||||||
| North America | |||||||||||||||||||||||||||||||
| Peñasquito, Mexico | 100 | % | 36,000 | 0.64 | % | 230,000 | 293,100 | 0.55 | % | 1,620,000 | 329,100 | 0.56 | % | 1,850,000 | 188,600 | 0.50 | % | 950,000 | |||||||||||||
| TOTAL NEWMONT | 36,000 | 0.64 | % | 230,000 | 293,100 | 0.55 | % | 1,620,000 | 329,100 | 0.56 | % | 1,850,000 | 188,600 | 0.50 | % | 950,000 |
| (1) | Resources are reported exclusive of reserves. | |
| (2) | Resources are calculated at a zinc price of $1.45 per pound for 2019. Tonnage amounts have been rounded to the nearest 100,000. | |
| (3) | Measured and Indicated Resources (combined) are equivalent to Mineralized Material disclosed in Newmont’s Form 10-K filing. | |
| Attributable Lead Reserves (1) Metric Units | |||||||||||||||||||||||||||
| December 31, 2019 | |||||||||||||||||||||||||||
| Proven Reserves | Probable Reserves | Proven and Probable Reserves | |||||||||||||||||||||||||
| Newmont | Tonnage (2) | Grade | Lead (3) | Tonnage (2) | Grade | Lead (3) | Tonnage (2) | Grade | Lead (3) | Metallurgical | |||||||||||||||||
| Deposits/Districts | Share | (x1000 tonnes) | (Pb %) | (Tonnes) | (x1000 tonnes) | (Pb %) | (Tonnes) | (x1000 tonnes) | (Pb %) | (Tonnes) | Recovery | ||||||||||||||||
| North America | |||||||||||||||||||||||||||
| Peñasquito Open Pits (4) | 100 | % | 103,600 | 0.39 | % | 400,000 | 303,200 | 0.32 | % | 970,000 | 406,800 | 0.34 | % | 1,370,000 | 75 | % | |||||||||||
| Peñasquito Stockpiles (5) | 100 | % | 4,500 | 0.54 | % | 20,000 | 27,300 | 0.32 | % | 90,000 | 31,800 | 0.35 | % | 110,000 | 64 | % | |||||||||||
| TOTAL NEWMONT | 108,100 | 0.39 | % | 420,000 | 330,500 | 0.32 | % | 1,060,000 | 438,600 | 0.34 | % | 1,480,000 | 74 | % |
| (1) | See footnote (1) to the Gold Reserves table above. Lead reserves for 2019 were calculated at a lead price of $0.95 per pound. | |
| (2) | See footnote (2) to the Gold Reserves table above. Tonnages are rounded to nearest 100,000. | |
| (3) | See footnote (3) to the Gold Reserves table above. Tonnes may not recalculate as they are rounded to the nearest 10,000. | |
| (4) | Lead cut-off grade varies with level of gold, silver and zinc credits. | |
| (5) | Stockpiles are comprised primarily of material that has been set aside to allow processing of higher grade material in the mills. Stockpiles increase or decrease depending on current mine plans. Stockpile reserves are reported separately where ounces exceed 100,000 and are greater than 5% of the total site-reported reserves. | |
| Attributable Lead Resources (1)(2) – December 31, 2019, Metric Units | |||||||||||||||||||||||||||||||
| Measured Resource | Indicated Resource | Measured and Indicated Resource (3) | Inferred Resource | ||||||||||||||||||||||||||||
| Newmont | Tonnage | Grade | Lead | Tonnage | Grade | Lead | Tonnage | Grade | Lead | Tonnage | Grade | Lead | |||||||||||||||||||
| Deposits/Districts | Share | (x1000 tonnes) | (Pb%) | (tonnes) | (x1000 tonnes) | (Pb%) | (tonnes) | (x1000 tonnes) | (Pb%) | (tonnes) | (x1000 tonnes) | (Pb%) | (tonnes) | ||||||||||||||||||
| North America | |||||||||||||||||||||||||||||||
| Peñasquito, Mexico | 100 | % | 36,000 | 0.28 | % | 100,000 | 293,100 | 0.24 | % | 700,000 | 329,100 | 0.24 | % | 800,000 | 188,600 | 0.27 | % | 510,000 | |||||||||||||
| TOTAL NEWMONT | 36,000 | 0.28 | % | 100,000 | 293,100 | 0.24 | % | 700,000 | 329,100 | 0.24 | % | 800,000 | 188,600 | 0.27 | % | 510,000 |
| (1) | Resources are reported exclusive of reserves. | |
| (2) | Resources are calculated at a lead price of $1.15 per pound for 2019. Tonnage amounts have been rounded to the nearest 100,000. | |
| (3) | Measured and Indicated Resources (combined) are equivalent to Mineralized Material disclosed in Newmont’s Form 10-K filing. | |
| Attributable Molybdenum Reserves (1) Metric Units | ||||||||||||||||||||||||||
| December 31, 2019 | ||||||||||||||||||||||||||
| Proven Reserves | Probable Reserves | Proven and Probable Reserves | ||||||||||||||||||||||||
| Newmont | Tonnage (2) | Grade | Molybdenum (3) | Tonnage (2) | Grade | Molybdenum (3) | Tonnage (2) | Grade | Molybdenum (3) | Metallurgical | ||||||||||||||||
| Deposits/Districts | Share | (x1000 tonnes) | (Mo %) | (Tonnes) | (x1000 tonnes) | (Mo %) | (Tonnes) | (x1000 tonnes) | (Mo %) | (Tonnes) | Recovery | |||||||||||||||
| South America | ||||||||||||||||||||||||||
| NuevaUnión, Chile (4) | 50 | % | — | — | 776,900 | 0.02 | % | 120,000 | 776,900 | 0.02 | % | 120,000 | 48 | % | ||||||||||||
| TOTAL NEWMONT | — | — | 776,900 | 0.02 | % | 120,000 | 776,900 | 0.02 | % | 120,000 | 48 | % |
| (1) | See footnote (1) to the Gold Reserves table above. Molybdenum reserves for 2019 were calculated based on a molybdenum price set by NuevaUnión joint venture. | |
| (2) | See footnote (2) to the Gold Reserves table above. Tonnages are rounded to nearest 100,000. | |
| (3) | See footnote (3) to the Gold Reserves table above. Tonnes may not recalculate as they are rounded to the nearest 10,000. | |
| (4) | Project is currently undeveloped. Resource estimates provided by NuevaUnión joint venture. | |
| Attributable Molybdenum Resources (1)(2) – December 31, 2019, Metric Units | |||||||||||||||||||||||||||||||
| Measured Resource | Indicated Resource | Measured and Indicated Resource (3) | Inferred Resource | ||||||||||||||||||||||||||||
| Newmont | Tonnage | Grade | Molybdenum | Tonnage | Grade | Molybdenum | Tonnage | Grade | Molybdenum | Tonnage | Grade | Molybdenum | |||||||||||||||||||
| Deposits/Districts | Share | (x1000 tonnes) | (Mo%) | (tonnes) | (x1000 tonnes) | (Mo%) | (tonnes) | (x1000 tonnes) | (Mo%) | (tonnes) | (x1000 tonnes) | (Mo%) | (tonnes) | ||||||||||||||||||
| South America | |||||||||||||||||||||||||||||||
| NuevaUnión, Chile (4) | 50 | % | 159,500 | 0.01 | % | 10,000 | 231,500 | 0.01 | % | 20,000 | 391,000 | 0.01 | % | 30,000 | 362,300 | 0.01 | % | 40,000 | |||||||||||||
| Alumbrera, Argentina (5) | 37.5 | % | 43,900 | 0.01 | % | 10,000 | 2,300 | 0.01 | % | — | 46,200 | 0.01 | % | 10,000 | 400 | 0.01 | % | — | |||||||||||||
| TOTAL NEWMONT | 203,400 | 0.01 | % | 20,000 | 233,800 | 0.01 | % | 20,000 | 437,200 | 0.01 | % | 40,000 | 362,700 | 0.01 | % | 40,000 |
| (1) | Resources are reported exclusive of reserves. | |
| (2) | Resources for NuevaUnión and Alumbrera are calculated based on a molybdenum price set by NuevaUnión joint venture and Glencore, respectively. Tonnage amounts have been rounded to the nearest 100,000. | |
| (3) | Measured and Indicated Resources (combined) are equivalent to Mineralized Material disclosed in Newmont’s Form 10-K filing. | |
| (4) | Project is currently undeveloped. Resource estimates provided by NuevaUnión joint venture. | |
| (5) | Resource estimates provided by Glencore. | |
About Newmont
Newmont is the world’s leading gold company and a producer of copper, silver, zinc and lead. The Company’s world-class portfolio of assets, prospects and talent is anchored in favorable mining jurisdictions in North America, South America, Australia and Africa. Newmont is the only gold producer listed in the S&P 500 Index and is widely recognized for its principled environmental, social and governance practices. The Company is an industry leader in value creation, supported by robust safety standards, superior execution and technical proficiency. Newmont was founded in 1921 and has been publicly traded since 1925.
Cautionary Statement:
The “reserves” disclosed in this release have been prepared in compliance with Industry Guide 7 published by the SEC. As used in this news release, the term “reserve” means that part of a mineral deposit that can be economically and legally extracted or produced at the time of the reserve determination. The term “economically,” as used in this definition, means that profitable extraction or production has been established or analytically demonstrated in a feasibility study to be viable and justifiable under reasonable investment and market assumptions. The term “legally,” as used in this definition, does not imply that all permits needed for mining and processing have been obtained or that other legal issues have been completely resolved. However, for a reserve to exist, Newmont must have a justifiable expectation, based on applicable laws and regulations, that issuance of permits or resolution of legal issues necessary for mining and processing at a particular deposit will be accomplished in the ordinary course and in a timeframe consistent with Newmont’s current mine plans. Reserves in this news release are aggregated from the proven and probable classes.
The term “Proven Reserves” used in the tables of this news release means reserves for which (a) quantity is computed from dimensions revealed in outcrops, trenches, workings or drill holes; (b) grade and/or quality are computed from the results of detailed sampling; and (c) the sites for inspection, sampling and measurements are spaced so closely and the geologic character is sufficiently defined that size, shape, depth and mineral content of reserves are well established. The term “Probable Reserves” means reserves for which quantity and grade are computed from information similar to that used for proven reserves, but the sites for sampling are farther apart or are otherwise less closely spaced. The degree of assurance, although lower than that for proven reserves, is high enough to assume continuity between points of observation. Newmont classifies all reserves as Probable on its development projects until a year of production has confirmed all assumptions made in the reserve estimates. Proven and Probable reserves include gold, copper, silver, zinc, lead or molybdenum attributable to Newmont’s ownership or economic interest. Proven and probable reserves were calculated using cut-off grades. The term “cut-off grade” means the lowest grade of mineralized material considered economic to process. Cut-off grades vary between deposits depending upon prevailing economic conditions, mineability of the deposit, by-products, amenability of the ore to gold, copper, silver, zinc, lead, molybdenum extraction and type of milling or leaching facilities available.
Notice for U.S. Investors:
The terms “resources” and “Measured, Indicated and Inferred resources” are used in this news release. Investors are advised that the SEC does not recognize these terms and “resources” have not been prepared in accordance with Industry Guide 7. Newmont has determined that such “resources” would be substantively the same as those prepared using the Guidelines established by the Society of Mining, Metallurgy and Exploration (SME) and defined as “Mineral Resource”. Estimates of resources are subject to further exploration and development, are subject to additional risks, and no assurance can be given that they will eventually convert to future reserves. Inferred Resources, in particular, have a great amount of uncertainty as to their existence and their economic and legal feasibility. Investors are cautioned not to assume that any part or all of the Inferred Resource exists, or is economically or legally mineable. Also, disclosure of contained ounces is permitted under the SME Guideline and other regulatory guidelines, such as Canada’s NI 43-101 and Australia’s JORC. However, the SEC generally requires mineral resource information in SEC-filed documents to be reported only as in-place tonnage and grade. Investors are reminded that even if significant mineralization is discovered and converted to reserves, during the time necessary to ultimately move such mineralization to production the economic feasibility of production may change. See the Company’s Annual Report for the “Proven and Probable Reserve” and “Mineralized Material” tables prepared in compliance with the SEC’s Industry Guide 7, available at www.newmont.com and on www.sec.gov. Investors are reminded that the tables presented in the Annual Report are estimates as of December 31, 2019 and were presented on an attributable basis reflecting the Company’s ownership interest at such time.
Cautionary Statement Regarding Forward Looking Statements:
This release may contain “forward-looking statements” within the meaning of Section 27A of the Securities Act of 1933, as amended, and Section 21E of the Securities Exchange Act of 1934, as amended, which are intended to be covered by the safe harbor created by such sections and other applicable laws. Such forward-looking statements may include, without limitation, estimates and expectations of future production, mine plans, operational and project development, exploration outlook, and operational and financial performance. Where the Company expresses or implies an expectation or belief as to future events or results, such expectation or belief is expressed in good faith and believed to have a reasonable basis. However, such statements are subject to risks, uncertainties, assumptions and other factors, which could cause actual results to differ materially from future results expressed or implied by the “forward-looking statements”. For a more detailed discussion of risks and other factors that might impact future looking statements, see the Company’s Quarterly Report on Form 10-Q for the quarter ended June 30, 2019 under the heading “Risk Factors”, filed with the U.S. Securities and Exchange Commission (the “SEC”) and available on the SEC website or www.newmontgoldcorp.com, as well as the Company’s other SEC filings. Investors are also encouraged to refer to the Company’s 2019 Form 10-K, which is expected to be filed on or about February 20, 2020, with the SEC under the headings “Risk Factors” and “Forward-Looking Statements” for additional information, The Company does not undertake any obligation to release publicly revisions to any “forward-looking statement,” including, without limitation, outlook, to reflect events or circumstances after the date of this news release, or to reflect the occurrence of unanticipated events, except as may be required under applicable securities laws. Investors should not assume that any lack of update to a previously issued “forward-looking statement” constitutes a reaffirmation of that statement. Continued reliance on “forward-looking statements” is at investors’ own risk.
Qualified Person
The technical information about the Company’s mineral properties contained in this news release has been approved by Mr. Donald Doe, Group Executive Reserves, who is a “qualified person” within the meaning of National Instrument 43-101.

View source version on businesswire.com: https://www.businesswire.com/news/home/20200213005222/en/
Newmont Mining Corporation
Investor Contact
Jessica Largent, 303-837-5484
[email protected]
Media Contact
Omar Jabara, 303-837-5114
[email protected]
Source: Newmont Corporation
Original Article: https://www.newmont.com/newsroom/news-details/?newsId=23852c53-7035-4c11-aad9-6692f161ad41


