DENVER–(BUSINESS WIRE)– Newmont Corporation (NYSE: NEM, TSX: NGT) reported higher gold Mineral Reserves (“reserves”) of 96.1 million attributable ounces for 2022 compared to the Company’s 92.8 million ounces at the end of 2021. Newmont has significant upside to other metals, including more than 15 billion pounds of copper reserves and nearly 600 million ounces of silver reserves.
This press release features multimedia. View the full release here: https://www.businesswire.com/news/home/20230223005160/en/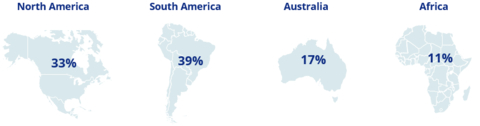
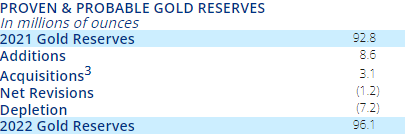
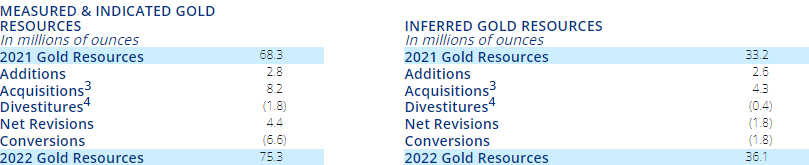
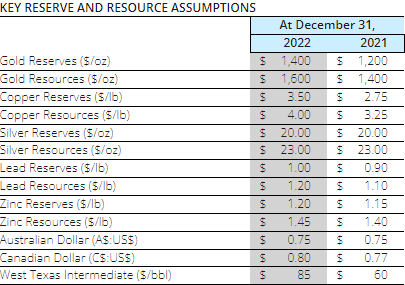
PERCENTAGE OF GOLD RESERVES BY JURISDICTION
“In 2022, Newmont replaced depletion and grew reserves by nearly 4 percent as we continued to focus on extending mine life, developing districts and discovering new opportunities in the most favorable mining jurisdictions. Our diverse, global portfolio of operations and projects delivers steady production for at least the next decade, leading the industry with approximately six million gold ounces per year. Supported by the most extensive exploration program in the industry, our team is actively building a profitable and resilient production pipeline for the next several decades.”
– Tom Palmer, President and Chief Executive Officer
2022 RESERVES & RESOURCES HIGHLIGHTS
- Robust gold reserves of 96.1 million ounces
- Over 90 percent of gold reserves in top-tier jurisdictions
- Addition of 8.6 million ounces in 2022 primarily due to 4.4 million attributable ounces from additions at Pueblo Viejo and 2.8 million from exploration at Newmont’s managed operations; further improved by 3.1 million ounces from Newmont’s increase in ownership of Yanacocha to 100 percent in 2022
- Underpinned by a strong base of operating sites with gold reserve life of 10 years or more, including Boddington, Tanami, Ahafo, Peñasquito, Cerro Negro, Merian, Pueblo Viejo and Nevada Gold Mines (NGM), and further enhanced by our six other managed mines and organic project pipeline
- Significant gold reserves per share with 120 ounces per 1,000 shares
- Measured & Indicated Gold Mineral Resources of 75.3 million ounces and Inferred Resources of 36.1 million ounces
- Significant exposure to copper with 15.7 billion pounds in reserves, 17.9 billion pounds in Measured & Indicated resources and 8.6 billion pounds in Inferred resources
- Additional exposure to other metals including silver, lead and zinc
PERCENTAGE OF GOLD RESERVES BY JURISDICTION1
Newmont’s reserve base is a key differentiator with over 90 percent of gold reserves located in top-tier jurisdictions, an average reserve grade of 1.09 grams per tonne and an operating reserve life of more than 10 years at six managed sites and two non-managed joint ventures, with significant upside potential from a robust organic project pipeline. In addition, Newmont has substantial exposure to other metals, with 68 million gold equivalent ounces2 of reserves from copper, silver, lead, zinc and molybdenum.
For 2022, Newmont reported 96.1 million ounces of gold Mineral Reserves, a 3.6 percent increase from the prior year total of 92.8 million ounces. Additions of 8.6 million ounces and acquisitions3 of 3.1 million ounces were partially offset by depletion of 7.2 million ounces and unfavorable net revisions of 1.2 million ounces.
Additions before revisions of 8.6 million ounces through exploration and technical studies met the Company’s target despite higher costs. Notable reserve additions for the year from Newmont’s operating sites included:
- Cerro Negro added 0.8 million ounces primarily due to drilling in the Eastern Districts
- Merian added 0.5 million attributable ounces primarily due to drilling at the Merian 2 open pit
- Tanami added 0.4 million ounces primarily due to drilling at Liberator and Auron
- Ahafo North added 0.2 million ounces primarily due to drilling
- Newmont’s 40 percent interest in Pueblo Viejo added 4.4 million attributable ounces, and its 38.5 percent interest in NGM added 1.4 million attributable ounces
Net unfavorable revisions include 0.5 million ounces at Yanacocha due to updated models, technical assumptions and revised mine designs, as well as 0.2 million ounces at Merian and Éléonore due to revised technical assumptions and costs. Additional net negative revisions of 0.7 million ounces were attributable to NGM, mainly at Turquoise Ridge and Carlin. Negative revisions were partially offset by favorable revisions of 0.5 million ounces at Pueblo Viejo.
Newmont’s 38.5 percent interest in NGM represented 18.6 million attributable ounces of gold reserves at year end, compared to 19.3 million ounces at the end of 2021. Newmont’s 40 percent interest in Pueblo Viejo represented 8.2 million attributable ounces of gold reserves at year end, compared to 3.6 million ounces at the end of 2021.
Gold reserve grade improved 2 percent to 1.09 grams per tonne compared to 1.06 grams per tonne in the prior year, primarily due to higher grade reserves from the Company’s 40 percent equity ownership in Pueblo Viejo and positive results from the Company’s underground managed operations, including Cerro Negro, Tanami and Musselwhite, as well as increased equity ownership in Yanacocha.
In 2022, Newmont reported Measured and Indicated Gold Mineral Resources of 75.3 million ounces, a 10 percent increase from the prior year total of 68.3 million ounces. Inferred Gold Mineral Resources totaled 36.1 million ounces, a 9 percent increase from the prior year total of 33.2 million ounces. In total, resource conversions to reserves were more than offset by a combination of acquisitions, additions and net positive revisions.
Measured and Indicated Gold Mineral Resources added through exploration programs were 2.8 million ounces and included notable additions before revisions of 0.5 million ounces at Ahafo South underground, 0.5 million ounces at Yanacocha, 0.4 million attributable ounces at NGM, 0.2 million ounces at Cerro Negro, 0.2 million ounces at Peñasquito and 0.2 million ounces at Ahafo North. Acquisitions added 8.2 million ounces, including 7.1 million ounces at Conga and 1.1 million ounces at Yanacocha, while the divestiture of Agua Rica had an impact of 1.8 million ounces.
Measured and Indicated Gold Mineral Resources reported net positive revisions of 4.4 million ounces primarily driven by 0.6 million ounces at Peñasquito, 0.5 million ounces at Tanami, 0.5 million ounces at CC&V, 0.5 million ounces at Musselwhite and 0.4 million ounces at Ahafo South underground. Additionally NGM added 1.4 million attributable ounces, primarily at Cortez and Carlin, and Pueblo Viejo added 0.5 million attributable ounces. Positive revisions were partially offset by negative revisions, including 0.4 million ounces at the Ahafo South open pit.
Inferred Gold Mineral Resources added through exploration programs were 2.6 million ounces and included notable additions before revisions of 0.4 million ounces at Cerro Negro, 0.4 million ounces at Ahafo South underground, 0.4 million ounces at Porcupine underground, 0.1 million ounces at Tanami and 0.1 million ounces at Éléonore. Additionally, NGM added 0.9 million attributable ounces. Acquisitions added 4.3 million ounces, including 2.6 million ounces at Yanacocha and 1.4 million ounces at Conga, while the divestiture of Agua Rica had an impact of 0.4 million ounces.
Inferred Gold Mineral Resources reported unfavorable net revisions of 1.8 million ounces, primarily driven by negative revisions of 0.3 million ounces at Ahafo South underground, 0.2 million ounces at Porcupine open pit, 0.1 million ounces at Ahafo South open pit and 0.1 million ounces at Éléonore. Additionally, Pueblo Viejo had negative revisions of 1.2 million attributable ounces. Negative revisions were partially offset by positive revisions of 0.2 million ounces at CC&V and 0.2 million attributable ounces at NGM.
Newmont’s Measured and Indicated Gold Mineral Resource grade increased slightly to 0.67 grams per tonne compared to 0.66 grams per tonne in the prior year. Inferred Gold Mineral Resource grade of 0.70 grams per tonne increased slightly compared to 0.69 grams per tonne in the prior year.
OTHER METALS
In 2022, copper reserves increased slightly to 15.7 billion pounds from 15.1 billion pounds in the prior year, primarily due to increased equity at Yanacocha. Measure and Indicated copper resources increased slightly to 17.9 billion pounds from 17.8 billion pounds, primarily due to increased equity at Conga and Yanacocha. Inferred copper resources remained flat at 8.6 billion pounds as compared to the prior year.
Silver reserves increased to 593 million ounces from 568 million ounces in the prior year, primarily due to increased equity at Yanacocha. Measured and Indicated silver resources also increased to 500 million ounces from 422 million ounces in the prior year, primarily due to increased equity at Yanacocha and Conga. Inferred silver resources decreased to 152 million ounces from 163 million ounces in the prior year, primarily due to the divestiture of Agua Rica and resource conversion at Cerro Negro.
Lead reserves decreased to 2.3 billion pounds from 2.6 billion pounds in the prior year, and zinc reserves also decreased to 5.5 billion pounds from 6.3 billion pounds. These decreases were primarily due to depletion at Peñasquito. Measured and Indicated lead resources increased to 1.6 billion pounds from 1.2 billion pounds, while Inferred lead resources decreased to 440 million pounds from 480 million pounds in the prior year. Measured and Indicated zinc resources increased to 3.7 billion pounds from 2.7 billion pounds and Inferred zinc resources decreased to 1.0 billion pounds from 1.1 billion pounds in the prior year. The increases in Measured and Indicated lead and zinc resources were primarily due to positive revision at Peñasquito. The decreases in Inferred lead and zinc resources were primarily due to negative revisions and conversion at Peñasquito.
EXPLORATION OUTLOOK
Newmont’s attributable exploration expenditure for managed operations is expected to be approximately $200 million in 2023 with 80 percent of total exploration investment dedicated to near-mine expansion programs and the remaining 20 percent allocated to the advancement of greenfield projects.
Additionally, Newmont’s share of exploration investment for its non-managed joint ventures will total approximately $25 million.
Geographically, the Company expects to invest approximately 32 percent in North America, 30 percent in South America, 18 percent in Africa and the remainder in Australia and other locations.
________________________________________________
1 North America includes 38.5 percent interest in Nevada Gold Mines; South America includes Newmont’s 40 percent interest in Pueblo Viejo.
2 Gold Equivalent Ounces (GEOs) are calculated using 2022 Mineral Reserve pricing for Gold ($1,400/oz.), Copper ($3.50/lb.), Silver ($20.00/oz.), Lead ($1.00/lb.), and Zinc ($1.20/lb.) and Resource pricing for Gold ($1,600/oz.), Copper ($4.00/lb.), Silver ($23.00/oz.), Lead ($1.20/lb.), and Zinc ($1.45/lb.) and metallurgical recoveries for each metal on a site by site basis, as metal * [(metal price * metal recovery) / (gold price * gold recovery)].
3 In 2022, the Company increased its ownership interest in Yanacocha to 100% by acquiring Buenaventura’s 43.65% and Sumitomo’s 5% noncontrolling interest, respectively.
4 In November 2022, Newmont sold its 18.75% ownership in Agua Rica.
GOLD RESERVE SENSITIVITY
A $100 increase in gold price would result in an approximate three percent increase in gold reserves while a $100 decrease in gold price would result in an approximate seven percent decrease in gold reserves. These sensitivities assume an oil price of $85 per barrel (WTI), Australian dollar exchange rate of $0.75 and Canadian dollar exchange rate of $0.80. These sensitivities assume all other inputs remain equal, including all cost and capital assumptions, which may impact the reality of these approximate estimates.
For additional details on Newmont’s reported gold, copper, silver, lead, zinc and molybdenum Mineral Reserves and Mineral Resources, please refer to the tables at the end of this release.
RESERVE AND RESOURCE TABLES
Proven and probable reserves are based on extensive drilling, sampling, mine modeling and metallurgical testing from which we determined economic feasibility. The reference point for mineral reserves is the point of delivery to the process plant. Metal price assumptions, adjusted for our exchange rate assumption, are based on considering such factors as market forecasts, industry consensus and management estimates. The price sensitivity of reserves depends upon several factors including grade, metallurgical recovery, operating cost, waste-to-ore ratio and ore type. Metallurgical recovery rates vary depending on the metallurgical properties of each deposit and the production process used. The reserve tables below list the average metallurgical recovery rate for each deposit, which takes into account the relevant processing methods. The cut-off grade, or lowest grade of mineralization considered economic to process, varies between deposits depending upon prevailing economic conditions, mineability of the deposit, by-products, amenability of the ore to gold, copper, silver, lead, zinc or molybdenum extraction and type of milling or leaching facilities available. Reserve estimates may have non-material differences in comparison to our joint venture partners due to differences in classification and rounding methodology.
The proven and probable reserve figures presented herein are estimates based on information available at the time of calculation. No assurance can be given that the indicated levels of recovery of gold, copper, silver, lead, zinc and molybdenum will be realized. Ounces of gold or silver or pounds of copper, lead, zinc or molybdenum included in the proven and probable reserves are those contained prior to losses during metallurgical treatment. Reserve estimates may require revision based on actual production. Market fluctuations in the price of gold, copper, silver, lead, zinc and molybdenum, as well as increased production costs or reduced metallurgical recovery rates, could render certain proven and probable reserves containing higher cost reserves uneconomic to exploit and might result in a reduction of reserves.
The measured, indicated, and inferred resource figures presented herein are estimates based on information available at the time of calculation and are exclusive of reserves. A “mineral resource” is a concentration or occurrence of solid material of economic interest in or on the Earth’s crust in such form, grade, or quality and quantity that there are reasonable prospects for eventual economic extraction. The location, quantity, grade or quality, continuity and other geological characteristics of a mineral resource are known, estimated or interpreted from specific geological evidence and knowledge, including sampling. The reference point for mineral resources is in situ. Mineral resources are sub-divided, in order of increasing geological confidence, into inferred, indicated and measured categories. Ounces of gold and silver or pounds of copper, zinc, lead, and molybdenum included in the measured, indicated and inferred resources are those contained prior to losses during metallurgical treatment. The terms “measured resource,” “indicated resource,” and “inferred resource” mean that part of a mineral resource for which quantity and grade or quality are estimated on the basis of geological evidence and sampling that is considered to be comprehensive, adequate, or limited, respectively. Market fluctuations in the price of gold, silver, copper, zinc, lead and molybdenum, as well as increased production costs or reduced metallurgical recovery rates, could change future estimates of resources.
We publish reserves annually, and will recalculate reserves at December 31, 2023, taking into account metal prices, changes, if any, to future production and capital costs, divestments and depletion as well as any acquisitions and additions during 2023.


