Hecla reports record annual revenue
COEUR D’ALENE, Idaho–(BUSINESS WIRE)– Hecla Mining Company (NYSE:HL) today announced fourth quarter and full year 2020 financial and operating results.
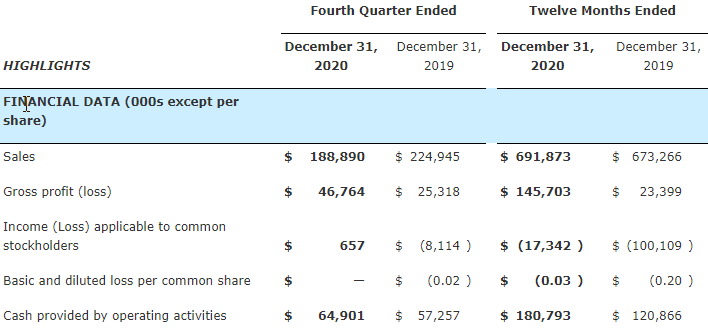
HIGHLIGHTS
- Fourth quarter sales of $188.9 million; cash flow from operations of $64.9 million; free cash flow $28.3 million1 net income of $0.8 million; adjusted net income applicable to common shareholders of $13.0 million, or $0.02 per share2; and adjusted EBITDA of $55.8 million.3
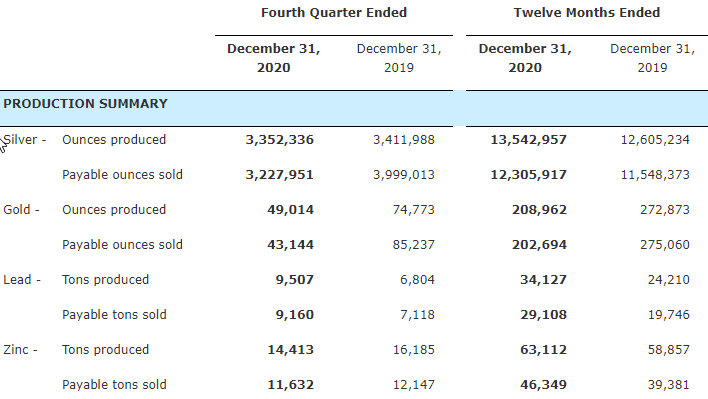
- 2020 silver production of 13.5 million ounces, up 7% and gold production of 208,962 ounces, down 23%, from 2019, which was Hecla’s highest annual gold production.
- 2020 sales of $691.9 million (the highest in the Company’s history); cash flow from operations of $180.8 million; free cash flow of $89.8 million1; adjusted net income applicable to common shareholders of $23.1 million, or $0.04 per share2; net loss of $16.8 million; and adjusted EBITDA of $224.3 million.3
- Third highest silver and gold reserves in Company’s 130-year history despite significant interruptions to 2020 exploration program due to COVID-19.
- Exploration discoveries at Midas, Casa Berardi, San Sebastian, Heva Hosco, and Kinskuch expect to be further drilled in 2021.
- Net debt reduction of approximately $81 million, or 17%, from March 31, 2020.
- Year-end cash position of $130 million, an increase of $67 million from 2019 with the credit facility undrawn.
- All-Injury Frequency Rate (AIFR) of 1.22 for 2020, lowest in the Company’s history and a reduction of 24% over 2019.
- Lucky Friday returned to full production levels in the fourth quarter of 2020.
- Production guidance increases projected silver production over 2020 production.
“The COVID pandemic provided significant challenges to Hecla and the mining industry; however, due to our people and the jurisdictions we operate in, Hecla exceeded the high end of our pre-COVID silver guidance by 1.4 million ounces,” said Phillips S. Baker, Jr., President and CEO. “We saw modest disruptions in Quebec and Mexico; however, these did not materially impact our business. During the year we refinanced our long-term debt now due in 2028, and through solid free cash flow generation, added cash to the balance sheet, reduced our net debt, and increased dividends.”
Baker continued, “As we look to 2021, we see three significant value drivers. First, with Lucky Friday running at full production, positive results from the work at Casa Berardi, and the continued consistency of Greens Creek, we expect to grow silver production and generate significant free cash flow. Silver production from our United States silver mines is expected to go from 8 million ounces in 2018 to almost 15 million ounces by 2023, further increasing Hecla’s position as the most significant US silver producer.”
“Second, we start the year with the 3rd highest reserves in our history despite disruptions to our planned exploration and definition drilling programs due to COVID‑19, and we expect reserve growth in 2021 from a normal drilling program. Finally, Hecla’s 2021 exploration program is following up on high-grade intercepts that have the potential to expand existing or develop new high-quality deposits in some of the world’s best mining jurisdictions. Examples of this are Midas’ Green Racer Sinter target where we have made a multi-ounce gold discovery in a never before drilled target and at San Sebastian’s El Bronco vein where we are seeing high-grade over significant widths,” Baker said.
FINANCIAL OVERVIEW
Items impacting income (loss) applicable to common shareholders for the 2020 periods compared to 2019 include the following:
- Gross profit for the fourth quarter was higher by $21.4 million due primarily to higher metal prices, Casa Berardi’s higher-grade underground stopes and Lucky Friday’s return to full production.
- Full-year gross profit was $122.3 million higher, principally due to lower costs and depreciation at Nevada, higher quantities of silver, lead and zinc sold and higher realized silver and gold prices.
- Exploration and pre-development expense was $8.5 million for the fourth quarter and $18.3 million for 2020, compared to $3.0 million and $19.1 million, respectively, in 2019. The fourth quarter increase was enabled by cash flow generation at our operating mines with the increase primarily at Midas and San Sebastian.
- Ramp-up and suspension costs for the fourth quarter of $0.8 million and $24.9 million for 2020, compared to $3.3 million and $12.1 million, respectively, for the fourth quarter and full-year of 2019. The full-year 2020 costs were higher primarily due to 1) ramp-up of Lucky Friday prior to return to full production in the fourth quarter, 2) suspension costs in Nevada, and 3) temporary suspension costs at Casa Berardi and San Sebastian in response to COVID-19.
- Losses on metal derivative contracts for the fourth quarter and 2020 of $9.3 million and $22.1 million, respectively, compared to losses of $1.3 million and $4.0 million in the fourth quarter and 2019, respectively. During 2019, the Company settled in-the-money contracts prior to their maturity date, for cash proceeds of approximately $6.7 million, with no such early settlements in 2020.
- Foreign exchange losses of $5.8 million and $4.6 million were recognized in the fourth quarter and 2020, respectively, compared to losses of $1.5 million and $8.2 million, respectively, in 2019. The losses were primarily due to changes in the Canadian dollar’s value relative to the U.S. dollar.
- Interest expense was $10.7 million in the fourth quarter and $49.6 million for the full year of 2020 compared to $14.7 million and $48.4 million, respectively, for 2019. The interest expense in 2020 was primarily related to our Senior Notes.
- Income tax benefit for the fourth quarter of $1.1 million and a small provision for the full year of 2020, compared to benefits of $4.1 million and $24.1 million, respectively, for 2019.
Cash provided by operating activities for the fourth quarter and 2020 of $64.9 million and $180.8 million, was $7.6 million and $59.9 million higher, respectively, compared to the prior year periods. The increase in the fourth quarter of 2020 was primarily due to lower spending in Nevada and higher sales. Quarterly increase would have been higher except ore in Nevada was stockpiled for the bulk sample. The increase for the full year of 2020 was due to higher prices, lower Nevada spending and the Lucky Friday ramp-up.
Adjusted EBITDA3 of $224.3 million in 2020, $51.0 million more than 2019. The increase in 2020 was primarily due to higher sales and lower spending in Nevada.
Fourth quarter capital expenditures totaled $40.3 million, including $10.5 million at Greens Creek, $16.4 million at Casa Berardi, and $11.1 million at Lucky Friday. Capital expenditures for the year 2020 totaled $99.9 million, compared to $128.1 million in 2019.
Metals Prices
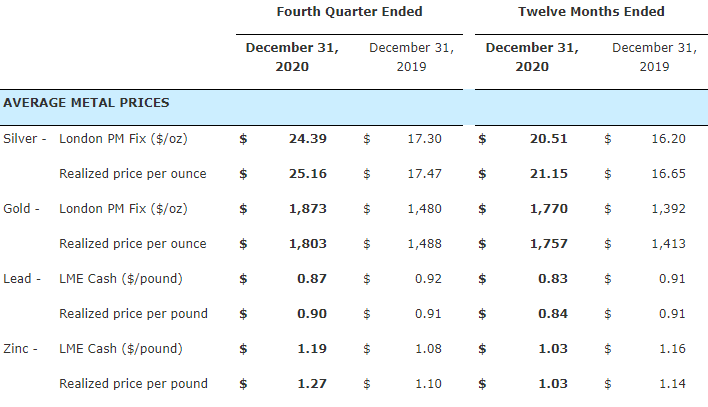
*Realized prices are calculated by dividing gross revenues for each metal (which include the price adjustments and gains and losses on the forward contracts discussed above) by the payable quantities of each metal included in products sold during the period.
Base Metals Forward Sales Contracts
The following table summarizes the quantities of base metals committed under financially settled forward sales contracts, other than provisional hedges (which address changes in prices between shipment and settlement with customers), at December 31, 2020:
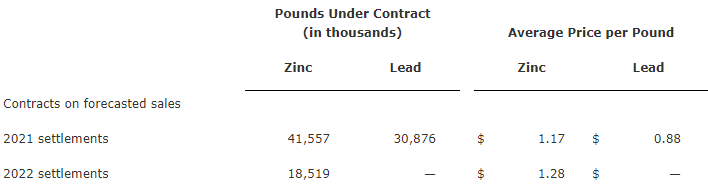
The contracts represent 33% of the forecasted payable zinc production for the next two years at an average price of $1.21 per pound, and 39% of the forecasted payable lead production for the next year at an average price of $0.88 per pound.
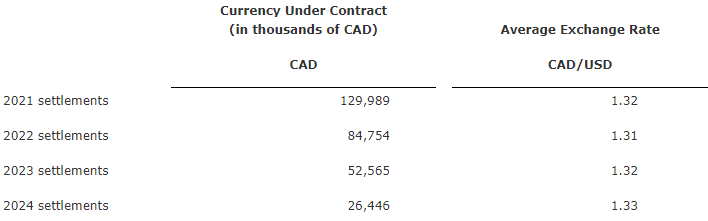
Foreign Currency Forward Purchase Contracts
The following table summarizes the Canadian dollars the Company has committed to purchase under foreign exchange forward contracts at December 31, 2020:
OPERATIONS OVERVIEW
Overview
The following table provides the production summary on a consolidated basis for the fourth quarter and twelve months ended December 31, 2020 and 2019:
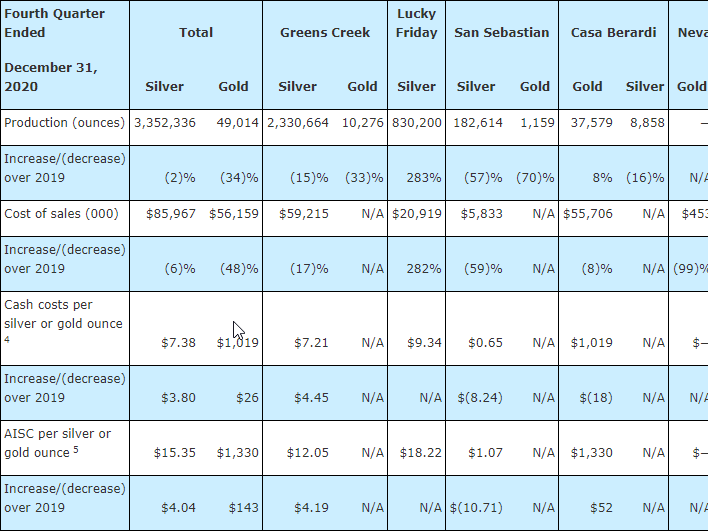
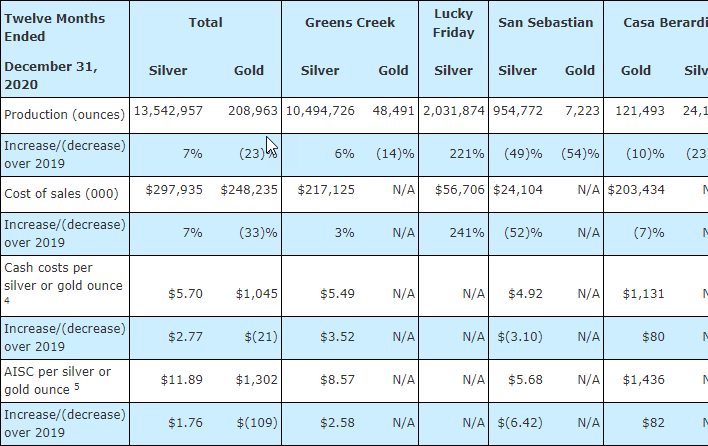
The following tables provide a summary of the final production, cost of sales and other direct production costs and depreciation, depletion and amortization (referred to herein as “cost of sales”), cash cost, after by-product credits (“cash cost”), per silver or gold ounce, and All in Sustaining Cost, after by-product credits (“AISC”), per silver and gold ounce, for the fourth quarter and twelve months ended December 31, 2020:
Greens Creek Mine – Alaska
The increase in silver production for the full year resulted from higher grades. The mill operated at an average of 2,236 tons per day (tpd) for the full year. Fourth quarter production was affected by a significant weather event in December when southeast Alaska was impacted by high winds and heavy rains that caused major damage in the area and communities.
The higher cost of sales in 2020 were due to higher sales volumes. The increase in per silver ounce cash costs and AISC was primarily due to higher concentrate treatment costs and lower by-product credits, on a per-ounce basis, with these items partially offset by lower capital spending for AISC.
For the full year of 2020, Greens Creek generated cash provided by operating activities of approximately $182.6 million and spent $23.0 million on additions to properties, plants and equipment, resulting in free cash flow of $159.6 million.1
Proven and Probable silver reserves decreased primarily due to COVID-19 limiting drilling to one-third of the amount drilled in 2019, changes to the mine plan, and less favorable smelter terms. This decline compares to average additions of nearly 8 million ounces per year for the past four years. Measured and Indicated resource increased due to reclassification of reserves and Inferred resource. Measured and Indicated Mineral Resources, inclusive of Mineral Reserves is down only 3% from 2019.
Casa Berardi – Quebec
Annual gold production decreased by 10%, compared to 2019, primarily due to the Government of Quebec’s COVID‑19 three-week suspension order and the third quarter planned mill repairs. Fourth quarter production increased 8% over the prior year period due to more tons milled and higher grades. The mill operated at an average of 4,129 tpd in the fourth quarter 2020 and 3,699 tpd for the year.
Lower quarterly and annual cost of sales were due to stripping the East Mine Crown Pillar Pit Extension (XCMP) in 2019 partially offset by increased quantities of waste and ore extracted from the pit and higher haulage costs due to deepening of the pit. However, milling and administrative costs were higher due to costs for pre-crushing of ore to allow for increased throughput, and higher costs for mill improvements, maintenance and reagents. These factors impacted mining and milling costs, along with lower gold production, resulting in increased cash costs and AISC, after by-product credits.
For the full year of 2020, Casa Berardi generated cash provided by operating activities of approximately $68.5 million and spent $40.9 million on additions to properties, plants and equipment, resulting in free cash flow of $27.6 million.1
Proven and Probable gold reserves decreased approximately 10% to 1.54 million ounces. Most of the decreases were due to mining depletion and engineering changes. The 2020 drilling program at Casa Berardi was also impacted by COVID. Despite the drilling delays, approximately 85 thousand ounces were added to reserve by drilling in 2020.
Measured and Indicated gold resources increased 19% to 1.25 million ounces given exploration additions and some reclassification from reserves given engineering changes. Measured and Indicated Mineral Resources, inclusive of Mineral Reserves, increased 1% over last year.
Lucky Friday Mine – Idaho
At the Lucky Friday Mine, 2.0 million and 0.8 million ounces of silver were produced in 2020 and the fourth quarter, respectively. Lucky Friday returned to full production in the fourth quarter.
The cost of sales for the fourth quarter was $20.9 million, and the cash cost per silver ounce4 was $9.34. AISC5 was $18.22 per silver ounce.
Proven and Probable reserves declined 4% due primarily to mining depletion; the current mine plan is unchanged at 16 years (2036). Measured and Indicated resources for silver and lead increased 5%.
San Sebastian – Mexico
At the San Sebastian Mine, 1.0 million ounces of silver and 7,223 ounces of gold were produced. For the fourth quarter, 0.2 million ounces of silver and 1,159 ounces of gold were produced. Mining was completed in the third quarter and milling completed in the fourth quarter of 2020. The mill operated at an average of 474 tpd for the year when in production.
The lower cost of sales and silver per ounce cash costs4 was primarily due to lower mining costs, higher by-product, partially offset by lower silver production, and for AISC, lower capital and exploration spending.
For the full year of 2020, San Sebastian generated cash provided by operating activities of approximately $14.4 million and spent $0.6 million on additions to properties, plants and equipment, resulting in free cash flow of $13.8 million.1
The Company continues to explore this highly prospective land package and will evaluate further mining based on exploration results.
Nevada Operations
During the second half of 2020, all ore mined at Nevada Operations was stockpiled, with no ore milled and no production reported during the period. Mining of refractory ore at Fire Creek in areas with existing development was completed in the fourth quarter with most of the material shipped to a third-party processor by February 2021. The bulk test demonstrated that larger scale, more productive mining methods could be applied successfully to this material. Ground conditions were as good or better than expected and water in the test area was readily managed. The bulk test refractory ore is being processed by a third party through a tolling agreement. While the processing is not yet complete, the recovery information to date follows the grade-recovery curve established through bench testing. Metal prices increased significantly since the tolling agreement was signed, and it is no longer attractive for the third party to displace their own feed to toll. Discussions are underway with another processor with surplus capacity. Fire Creek is expected to be placed on care and maintenance in the second quarter of 2021.
SILVER AND GOLD RESERVE SUMMARY
Proven and Probable silver and gold reserves dropped 11% for the year to 188 million ounces of silver and 2.4 million ounces of gold. Lead and zinc reserves dropped 9% and 12% to 740 thousand tons of lead and 886 thousand tons of zinc. Due to the Company’s focus on essential mining during implemented COVID-19 protocols, the 2020 exploration programs were disrupted company-wide with approximately one-third less drilling achieved at Greens Creek than in 2019 coupled with significant third-party assay laboratory delays.
Measured and Indicated silver ounces increased 5% to a record 228 million ounces, an increase of 10.3 million ounces over 2019 with increases due to limited drilling and reclassification of reserve at Greens Creek and remodeling at Lucky Friday. Measured and Indicated gold ounces decreased 37% to 3.7 million ounces, a reduction of 2.1 million ounces, due to reclassification of resources in Nevada and the Heva Hosco project, respectively. Measured and Indicated base metals increased overall, with lead increasing 5% for a total of 921 thousand tons and zinc increasing 2% at 1,132 thousand tons.
Inferred silver resources are essentially unchanged from last year with a slight drop of 1% to 454 million ounces. Inferred gold resources increased 12% to 5.5 million ounces due to reclassification of higher resource classes in Nevada and the increased Inferred resource overall at the Heva Hosco Project. Inferred base metal resources are down slightly with a 3% change in lead to 467.6 thousand tons and a 5% change in zinc to 425.1 thousand tons. Base metal changes are mostly due to small losses and reclassification to higher classes at Greens Creek and remodeling of the Hugh Zone polymetallic zone at San Sebastian.
Please refer to the reserves and resources table at the end of this news release for a complete breakdown of the Company’s reserves and resources.
EXPLORATION AND PRE-DEVELOPMENT
Exploration
Fourth quarter exploration (including corporate development) expenses were $8.0 million, over half of the full year expenditures and an increase of $5.6 million compared to the fourth quarter 2019 primarily due to increased activity and focus on Midas, Casa Berardi, and San Sebastian.
During the quarter, there were two new discoveries: Green Racer Sinter at Midas and the 160 Zone eastern extension at Casa Berardi.
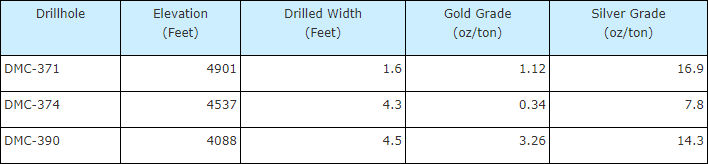
At Midas, four core rigs intersected mineralization in five of seven targets. At the Green Racer Sinter, a target with no previous drilling located two miles east of the main mine, detailed surface mapping identified an outcrop of spicular geyserite sinter with anomalous gold. The deeper holes are encountering the same favorable host rocks as those of the historic Midas mine where mineralization had an average grade of 0.81 oz/ton gold and 11.3 oz/ton silver over an average width of 4.0 feet. The following table shows the strength of mineralization in three recent holes (the surface is at an elevation of 5,434 feet):
At Casa Berardi, a new discovery was made in the 160 Zone 500 feet east of the current resource blocks and the zone open in all directions. The discovery drillhole intersected 0.32 oz/ton gold over 9.5 feet estimated true width including 1.16 oz/ton gold over 2.0 feet estimated true width.
San Sebastian exploration focused on the El Tigre and El Bronco veins discovered under thick soil cover this year. So far, the veins are strong structures that in places have over 28 feet of true thickness, almost a mile of strike length down to 1,000 feet below the surface and are open. The best results to date include 44.5 oz/ton silver and 0.22 oz/ton gold over 9.5 feet estimated true width in the El Bronco vein and 16.2 oz/ton silver and 0.09 oz/ton gold over 3.5 feet estimated true width in the El Tigre vein.
Please refer to the assay results tables at the end of this news release for more complete drill assay highlights.
2021 Exploration Program
Exploration expenditures for 2021 are estimated to be $30 million. Greens Creek and Casa Berardi programs should each be about 15% of the total expenditures with surface programs in addition to their normal underground exploration.
San Sebastian should also represent 15% of the exploration spend, building on the developing resources of the El Bronco, El Tigre, and El Toro veins.
Nevada exploration is targeted at 25% of the total, with the majority spent at Midas. At Hollister, exploration of the Hatter Graben is expected to be advanced by further developing the decline in order to test a portion of the Hatter Graben resource and explore additional Hatter Graben veins further to the south. At Fire Creek and Aurora, any drilling programs will occur later in the year following further target definition.
Almost 10% of the exploration budget is targeted for Kinskuch in an effort to expand the 2018 discoveries that established a strike length of 2.2 miles of silver, zinc, and lead mineralization offsetting drillhole intercepts such as 9.3 oz/ton silver, 6.5% zinc, and 2.3% lead over 8.2 feet that is open in all directions. The Heva Hosco program will spend about 5% of the total with the majority of the drilling offsetting a 2018 intercept in a high-grade quartz vein grading 0.84 oz/ton gold over 7.6 feet (drilled length).
Pre-development – Montanore/Rock Creek
Pre-development spending was $0.6 million in the fourth quarter and $2.4 million for the full year 2020, principally to advance the permitting at Montanore/Rock Creek.
At Montanore, the Kootenai National Forest’s (KNF) final Supplemental Environment Impact Study (SEIS) and Record of Decision (ROD) are expected later in 2021. At Rock Creek, the KNF partially approved the Plan of Operation to reflect the ROD and the Montana Department of Environmental Quality approved modifications to the existing Exploration License to match the ROD. Decisions on litigation challenging decisions of the US Fish and Wildlife Service and the KNF are expected later in the year.
2021 ESTIMATES6
2021 Production Outlook
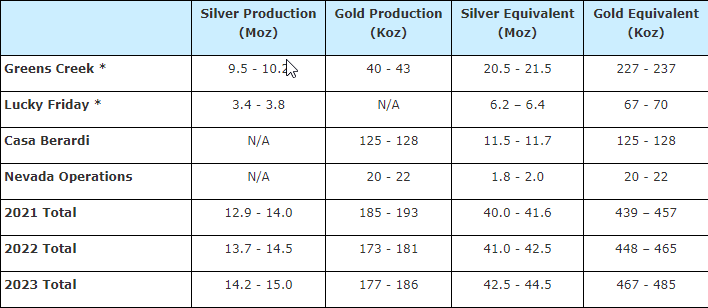
* Equivalent ounces include Lead and Zinc production
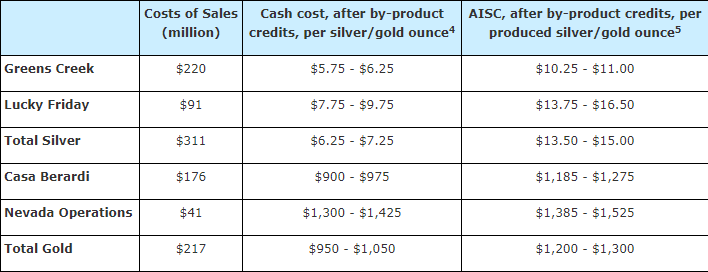
2021 Cost Outlook
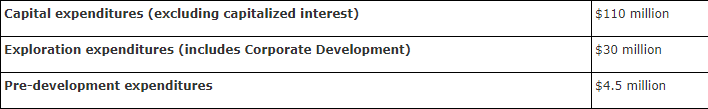
2021 Capital and Exploration Outlook
DIVIDENDS
Common
On February 16, 2021, theBoard of Directors declared a quarterly cash dividend of $0.00875 per share of common stock, consisting of $0.00375 per share for the minimum dividend component and $0.005 per share for the silver-linked dividend component. The common dividend payable on or about March 19, 2021, to stockholders of record on March 8, 2021. The realized silver price was $25.16 in the fourth quarter satisfying the criterion for the silver-linked dividend component of the Company’s dividend policy.
Preferred
TheBoard of Directors also declared a quarterly cash dividend of $0.875 per share of preferred stock, payable on or about April 1, 2021, to stockholders of record on March 15, 2021.
INVESTOR VIRTUAL OUTREACH
Conference Call Information
A conference call and webcast will be held today, at 9:00 a.m. Eastern Time to discuss fourth quarter and year-end 2020 financial results. You may join the conference call by dialing toll-free 1-833-350-1380 or for international by dialing 1-647-689-6934. The Conference ID is 7412488. Please dial-in and provide the Conference ID number at least 10 minutes prior to the start time to join the call and mitigate any hold times.
Hecla’s live webcast can be accessed at www.hecla-mining.com under Investors/Events & Webcasts (https://ir.hecla-mining.com/news-events/events-webcasts/default.aspx). The webcast will also be archived on the site.
One-on-One Calls
Hecla will be holding a Virtual Investor Event on Friday, February 19, from 11:30 a.m. to 1:30 p.m. Eastern Time inviting shareholders, investors, and other interested parties to schedule a personal, 30-minute virtual meeting (video or telephone) with a member of senior management. Click on the link below to schedule a call (You can also copy and paste the link into your web browser.). If you are unable to book a time, either due to high demand or for other reasons, please reach out to Jeanne DuPont at [email protected] or at 208-769-4177.
- Operations call with Lauren Roberts, SR VP and COO and senior mine management: https://calendly.com/2020-q4-vie/operations
- Finance call with Lindsay Hall, SR VP and CFO and Russell Lawlar, Treasurer: https://calendly.com/2020-q4-vie/finance
- Call with Phil Baker, President and CEO: https://calendly.com/2020-q4-vie/ceo
Planned Videocasts
Hecla will be conducting a series of videocasts commencing later in 2021 that will provide additional information on the Company, silver and the industry. These will be available on the Company’s website at www.hecla-mining.com and various social media platforms.
ABOUT HECLA
Founded in 1891, Hecla Mining Company (NYSE:HL) is a leading low-cost U.S. silver producer with operating mines in Alaska and Idaho and is a growing gold producer with an operating mine Quebec, Canada. The Company also has exploration and pre-development properties in eight world-class silver and gold mining districts in the U.S., Canada and Mexico, and an exploration office and investments in early-stage silver exploration projects in Canada.
NOTES
Non-GAAP Financial Measures
Non-GAAP financial measures are intended to provide additional information only and do not have any standard meaning prescribed by United States generally accepted accounting principles (GAAP). These measures should not be considered in isolation or as a substitute for measures of performance prepared in accordance with GAAP. The non-GAAP financial measures cited in this release and listed below are reconciled to their most comparable GAAP measure at the end of this release.
(1) Free cash flow is a non-GAAP measure calculated as cash provided by operating activities less additions to properties, plants and equipment.
(2)Adjusted net (loss) income applicable to common shareholders is a non-GAAP measurement, a reconciliation of which to net (loss) income applicable to common stockholders, the most comparable GAAP measure, can be found at the end of the release. Adjusted net (loss) income is a measure used by management to evaluate the Company’s operating performance but should not be considered an alternative to net (loss) income as defined by GAAP. They exclude certain impacts which are of a nature which we believe are not reflective of our underlying performance. Management believes that adjusted net income (loss) per common share provides investors with the ability to better evaluate our underlying operating performance.
(3) Adjusted EBITDA is a non-GAAP measurement, a reconciliation of which to net income, the most comparable GAAP measure, can be found at the end of the release. Adjusted EBITDA is a measure used by management to evaluate the Company’s operating performance but should not be considered an alternative to net income, or cash provided by operating activities as those terms are defined by GAAP and does not necessarily indicate whether cash flows will be sufficient to fund cash needs. In addition, the Company may use it when formulating performance goals and targets under its incentive program.
(4) Cash cost, after by-product credits, per silver and gold ounce is a non-GAAP measurement, a reconciliation of which to cost of sales and other direct production costs and depreciation, depletion and amortization (sometimes referred to as “cost of sales” in this release), can be found at the end of the release. It is an important operating statistic that management utilizes to measure each mine’s operating performance. It also allows the benchmarking of performance of each mine versus those of our competitors. As a primary silver mining company, management also uses cash cost, after by-product credits, per silver ounce on an aggregate basis – aggregating the Greens Creek, Lucky Friday and San Sebastian mines – to compare performance with that of other primary silver mining companies. Gold, lead and zinc produced have been treated as by-product credits in calculating silver costs per ounce. With regard to Casa Berardi and Nevada Operations, management uses cash cost, after by-product credits, per gold ounce to compare its performance with other gold mines with a by-product credit recognized for the value of their silver production. Similarly, the statistic is useful in identifying acquisition and investment opportunities as it provides a common tool for measuring the financial performance of other mines with varying geologic, metallurgical and operating characteristics. In addition, the Company may use it when formulating performance goals and targets under its incentive program.
(5) All in sustaining cost (AISC), after by-product credits, is a non-GAAP measurement, a reconciliation of which to cost of sales and other direct production costs and depreciation, depletion and amortization, the closest GAAP measurement, can be found in the end of the release. AISC, after by-product credits, includes cost of sales and other direct production costs, expenses for reclamation and exploration at the mine sites, corporate exploration related to sustaining operations, and all site sustaining capital costs. AISC, after by-product credits, is calculated net of depreciation, depletion, and amortization and by-product credits.
Current GAAP measures used in the mining industry, such as cost of goods sold, do not capture all the expenditures incurred to discover, develop and sustain silver and gold production. Management believes that all in sustaining costs is a non-GAAP measure that provides additional information to management, investors and analysts to help (i) in the understanding of the economics of our operations and performance compared to other producers and (ii) in the transparency by better defining the total costs associated with production. Similarly, the statistic is useful in identifying acquisition and investment opportunities as it provides a common tool for measuring the financial performance of other mines with varying geologic, metallurgical and operating characteristics. In addition, the Company may use it when formulating performance goals and targets under its incentive program.
Other
(6) Expectations for 2021 include silver, gold, lead and zinc production from Greens Creek, Lucky Friday, San Sebastian, Casa Berardi, and Nevada Operations converted using Au $1,525/oz, Ag $17/oz, Zn $1.00/lb, and Pb $0.85/lb. Numbers may be rounded.
Cautionary Statement Regarding Forward Looking Statements, Including 2021 Outlook
This news release contains “forward-looking statements” within the meaning of Section 27A of the Securities Act of 1933, as amended, and Section 21E of the Securities Exchange Act of 1934, as amended, which are intended to be covered by the safe harbor created by such sections and other applicable laws, including Canadian securities laws. Such forward-looking statements may include, without limitation: (i) estimates of full-year 2021, 2022 and 2023 silver and gold production, 2021 cost of sales, cash costs, after by-product credits, AISC, after by-product credits as well as estimated spending on capital, exploration, and pre-development (which assumes metal prices of gold at $1,650/oz, Ag $18/oz, Zn $0.95/lb, Pb $0.85/lb; USD/CAD assumed to be $0.77, USD/MXN assumed to be $0.05; (ii) the Company’s mineral reserves and resources; (iii) exploration discoveries at Midas, Casa Berardi, San Sebastian, Heva Hosco, Kinskuch and other exploration targets expect to be further drilled in 2021; (iv) expectation to grow silver production and generate significant free cash flow generation in 2021; (v) expectation reserves will grow in 2021 from a normal drilling program; (vi) Fire Creek is expected to be placed on care and maintenance in the second quarter of 2021; (vii) location and allocation of exploration expenditures; (viii) Montanore SEIS and ROD are expected later in 2021; (ix) decisions on litigation challenges decisions at Rock Creek are expected in 2020; (x) production from our United States silver mines is expected to go from 8 million ounces in 2018 to almost 15 million ounces by 2023; and (xi) the Company expects to continue exploration at San Sebastian.
Estimates or expectations of future events or results are based upon certain assumptions, which may prove to be incorrect. Such assumptions, include, but are not limited to: (a) there being no significant change to current geotechnical, metallurgical, hydrological and other physical conditions; (b) permitting, development, operations and expansion of the Company’s projects being consistent with current expectations and mine plans; (c) political/regulatory developments in any jurisdiction in which the Company operates being consistent with its current expectations; (d) the exchange rate for the Canadian dollar to the U.S. dollar, being approximately consistent with current levels; (e) certain price assumptions for gold, silver, lead and zinc; (f) prices for key supplies being approximately consistent with current levels; (g) the accuracy of our current mineral reserve and mineral resource estimates; and (h) the Company’s plans for development and production will proceed as expected and will not require revision as a result of risks or uncertainties, whether known, unknown or unanticipated. Where the Company expresses or implies an expectation or belief as to future events or results, such expectation or belief is expressed in good faith and believed to have a reasonable basis. However, such statements are subject to risks, uncertainties and other factors, which could cause actual results to differ materially from future results expressed, projected or implied by the “forward-looking statements.” Such risks include, but are not limited to gold, silver and other metals price volatility, operating risks, currency fluctuations, increased production costs and variances in ore grade or recovery rates from those assumed in mining plans, community relations, conflict resolution and outcome of projects or oppositions, litigation, political, regulatory, labor and environmental risks, and exploration risks and results, including that mineral resources are not mineral reserves, they do not have demonstrated economic viability and there is no certainty that they can be upgraded to mineral reserves through continued exploration. For a more detailed discussion of such risks and other factors, see the Company’s 2019 Form 10-K, filed on February 10, 2020, with the Securities and Exchange Commission (SEC), as well as the Company’s other SEC filings, including the Company’s 2020 10-K expected to be filed on February 18, 2021. The Company does not undertake any obligation to release publicly revisions to any “forward-looking statement,” including, without limitation, outlook, to reflect events or circumstances after the date of this news release, or to reflect the occurrence of unanticipated events, except as may be required under applicable securities laws. Investors should not assume that any lack of update to a previously issued “forward-looking statement” constitutes a reaffirmation of that statement. Continued reliance on “forward-looking statements” is at investors’ own risk.
Cautionary Statements to Investors on Reserves and Resources
Reporting requirements in the United States for disclosure of mineral properties as of December 31, 2020 and earlier are governed by the SEC’s Securities Act Industry Guide 7, entitled “Description of Property by Issuers Engaged or to be Engaged in Significant Mining Operations” (Guide 7). Effective January 1, 2021, the SEC has issued new rules rescinding Guide 7. Mining companies are not required to comply with the new rules until the first fiscal year beginning on or after January 1, 2021. Thus, the Company will be required to comply with the new rules when filing its Form 10-K for the fiscal year ended December 31, 2021. The Company is also a “reporting issuer” under Canadian securities laws, which require estimates of mineral resources and reserves to be prepared in accordance with Canadian National Instrument 43-101 (NI 43-101). NI 43-101 requires all disclosure of estimates of potential mineral resources and reserves to be disclosed in accordance with its requirements. Such Canadian information is included herein to satisfy the Company’s “public disclosure” obligations under Regulation FD of the SEC and to provide U.S. holders with ready access to information publicly available in Canada.
Reporting requirements in the United States for disclosure of mineral properties under Guide 7 compared to the new SEC rules (Item 1300 of Regulation S-K under the Securities and Exchange Act of 1934) and the requirements in Canada under NI 43-101 standards are substantially different. This document contains a summary of certain estimates of the Company, not only of Proven and Probable reserves within the meaning of Guide 7, but also of mineral resource and mineral reserve estimates estimated in accordance with the new SEC rules and definitional standards of the Canadian Institute of Mining, Metallurgy and Petroleum referred to in NI 43-101. Under Guide 7, the term “reserve” means that part of a mineral deposit that can be economically and legally extracted or produced at the time of the reserve determination. The term “economically”, as used in the definition of reserve, means that profitable extraction or production has been established or analytically demonstrated to be viable and justifiable under reasonable investment and market assumptions. The term “legally”, as used in the definition of reserve, does not imply that all permits needed for mining and processing have been obtained or that other legal issues have been completely resolved. However, for a reserve to exist, Hecla must have a justifiable expectation, based on applicable laws and regulations, that issuance of permits or resolution of legal issues necessary for mining and processing at a particular deposit will be accomplished in the ordinary course and in a timeframe consistent with Hecla’s current mine plans. The terms “Measured resources”, “Indicated resources,” and “Inferred resources” are mining terms as defined in accordance with the new SEC rules and NI 43-101. These terms are not defined under Guide 7 and prior to January 1, 2021, were not normally permitted to be used in reports and registration statements filed with the SEC in the United States, except where required to be disclosed by foreign law. The term “resource” does not equate to the term “reserve”. Under Guide 7, the material described herein as “Indicated resources” and “Measured resources” would be characterized as “mineralized material” and is permitted to be disclosed in tonnage and grade only, not ounces. The category of “inferred resources” is not recognized by Guide 7. Investors are cautioned not to assume that any part or all of the mineral deposits in such categories will ever be converted into Proven or Probable reserves. “Resources” have a great amount of uncertainty as to their existence, and great uncertainty as to their economic and legal feasibility. It cannot be assumed that all or any part of such a “resource” will ever be upgraded to a higher category or will ever be economically extracted. Investors are cautioned not to assume that all or any part of a “resource” exists or is economically or legally mineable. Investors are also especially cautioned that the mere fact that such resources may be referred to in ounces of silver and/or gold, rather than in tons of mineralization and grades of silver and/or gold estimated per ton, is not an indication that such material will ever result in mined ore which is processed into commercial silver or gold.
Qualified Person (QP) Pursuant to Canadian National Instrument 43-101
Kurt D. Allen, MSc., CPG, Director – Exploration of Hecla Limited and Keith Blair, MSc., CPG, Chief Geologist of Hecla Limited, who serve as a Qualified Person under National Instrument 43-101(“NI 43-101”), supervised the preparation of the scientific and technical information concerning Hecla’s mineral projects in this news release, including with respect to the newly acquired Nevada projects. Information regarding data verification, surveys and investigations, quality assurance program and quality control measures and a summary of analytical or testing procedures for the Greens Creek Mine are contained in a technical report titled “Technical Report for the Greens Creek Mine” effective date December 31, 2018, and for the Lucky Friday Mine are contained in a technical report titled “Technical Report for the Lucky Friday Mine Shoshone County, Idaho, USA” effective date April 2, 2014, for Casa Berardi are contained in a technical report titled “Technical Report on the mineral resource and mineral reserve estimate for Casa Berardi Mine, Northwestern Quebec, Canada” effective date December 31, 2018 (the “Casa Berardi Technical Report”), and for the San Sebastian Mine, Mexico, are contained in a technical report prepared for Hecla titled “Technical Report for the San Sebastian Ag-Au Property, Durango, Mexico” effective date September 8, 2015 . Also included in these four technical reports is a description of the key assumptions, parameters and methods used to estimate mineral reserves and resources and a general discussion of the extent to which the estimates may be affected by any known environmental, permitting, legal, title, taxation, socio-political, marketing, or other relevant factors. Information regarding data verification, surveys and investigations, quality assurance program and quality control measures and a summary of sample, analytical or testing procedures for the Fire Creek Mine are contained in a technical report prepared for Klondex Mines, dated March 31, 2018; the Hollister Mine dated May 31, 2017, amended August 9, 2017; and the Midas Mine dated August 31, 2014, amended April 2, 2015. Copies of these technical reports are available under Hecla’s and Klondex’s profiles on SEDAR at www.sedar.com. Mr. Allen and Mr. Blair reviewed and verified information regarding drill sampling, data verification of all digitally collected data, drill surveys and specific gravity determinations relating to all the mines. The review encompassed quality assurance programs and quality control measures including analytical or testing practice, chain-of-custody procedures, sample storage procedures and included independent sample collection and analysis. This review found the information and procedures meet industry standards and are adequate for Mineral Resource and Mineral Reserve estimation and mine planning purposes.
Original Article: https://ir.hecla-mining.com/news-events/current-news/news-details/2021/Hecla-Reports-Fourth-Quarter-and-Full-year-2020-Results/default.aspx


