(All amounts expressed in US dollars, tabular amounts in millions, unless otherwise stated)
Vancouver, August 10, 2022: Fortuna Silver Mines Inc. (NYSE: FSM) (TSX: FVI) (“Fortuna” or the “Company”) today reported its financial and operating results for the second quarter of 2022.
Second Quarter 2022 Highlights
Operational
- Gold and silver production of 62,171 ounces and 1,652,895 ounces, respectively. An increase of 100% and a decrease of 13% respectively compared to the second quarter of 2021 (“Q2 2021”). Gold equivalent production of 96,7123 ounces.
- AISC1 per ounce of gold sold of $1,151 for the Lindero Mine and $1,565 for the Yaramoko Mine. AISC1,2 per silver equivalent ounce of payable silver sold of $15.41 and $18.19 for the San Jose Mine and Caylloma Mine, respectively.
- All mine operations performed in line with annual guidance projections.
- Total recordable injury frequency rate of 3.01 with zero lost time injuries in over 3.1 million hours worked.
Financial
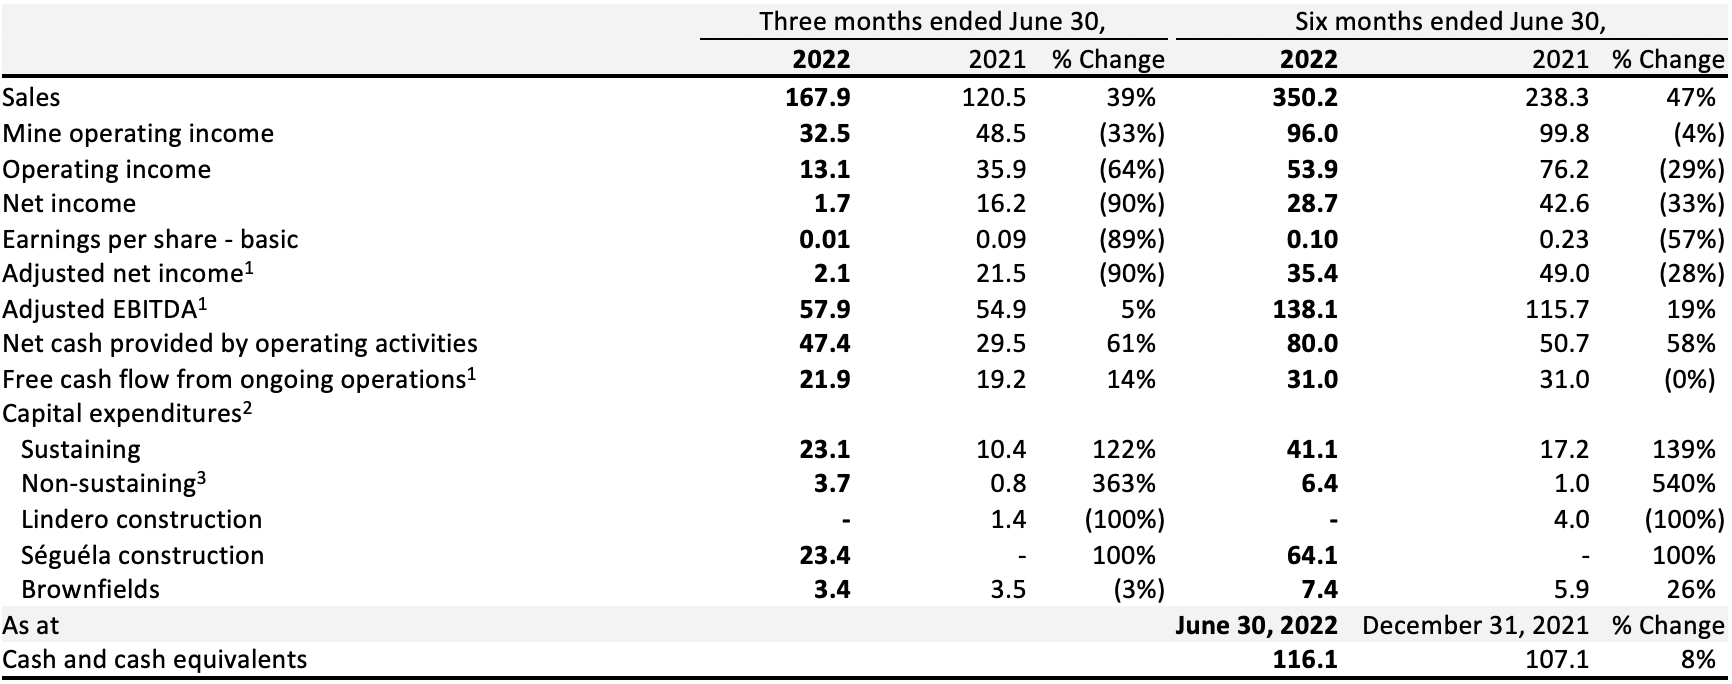
- Net income of $1.7 million or $0.01 per share, compared to $16.2 million or $0.09 net income per share reported in Q2 2021. Adjusted net income1 of $2.1 million compared to $21.5 million reported in Q2 2021
- Sales of $167.9 million, an increase of 39% from the $120.5 million reported in Q2 2021
- Consolidated realized prices of $1,870 per ounce and $22.62 per ounce for gold and silver respectively
- Adjusted EBITDA1 of $57.9 million compared to $54.9 million reported in Q2 2021
- Free cash flow from ongoing operations1 of $21.9 million compared to $19.2 million reported in Q2 2021
- As at June 30, 2022, the Company had cash and cash equivalents of $116.1 million, and available liquidity of $136.1 million
Growth and Development
- Séguéla construction 66% complete as of the end of June. On-time and on-budget for first gold pour in mid-2023
- Fortuna continued to expand mineralization at the Sunbird discovery outside of the current reported inferred mineral resource (refer to Fortuna news release dated June 7, 2022: “Fortuna drills 18.3 g/t gold over 11.9 meters at the Séguéla Project, Côte d’Ivoire”)
Jorge A. Ganoza, President and CEO, commented, “Our business generated healthy free cash flow of $21.9 million in spite of declining metal prices in the quarter and the compounding negative price adjustments this triggers on our concentrate sales.” Mr. Ganoza continued, “Costs across our operations are tracking in the upper range of annual guidance in spite of inflationary pressures. Our teams are focused on the implementation of productivity initiatives to help mitigate rising input costs.” Mr. Ganoza concluded, “I am extremely pleased with the delivery of our team at the Séguéla project. Key construction and procurement activities have been largely derisked as we remain on budget and on track to deliver first gold pour in mid-2023. Once in operation we expect Séguéla to be a flagship low cost, long lived operation for the Company.”
- 1 Refer to Non-IFRS financial measures
- 2 AISC/oz Ag Eq calculated at realized metal prices, refer to mine site results for realized prices and Non-IFRS Financial Measures for silver equivalent ratio
- 3 Gold equivalent production includes gold, silver, lead and zinc and is calculated using the following metal prices: US$1,869/oz Au, US$22.62/oz Ag, US$2,240/t Pb and US$3,948/t Zn or Au:Ag = 1:82.65, Au:Pb = 1:0.83, Au:Zn = 1:0.47
- 1 Refer to Non-IFRS Financial Measures section at the end of this news release and to the MD&A accompanying the Company’s financial statements on SEDAR at www.sedar.com for a description of the calculation of these measures.
- 2 Capital expenditures are presented on a cash basis
- 3 Non-sustaining expenditures include greenfields exploration Figures may not add due to rounding
Second Quarter 2022 Results
Net income in Q2 2022 was $1.7 million compared to $16.2 million in Q2 2021. The change in net income was mainly driven by lower sales at San Jose of $20.7 million due to declining silver prices and corresponding negative concentrate sales adjustments, and lower production. Additional items impacting the quarter were a $4.0 million write down of low-grade stockpile inventory at Yaramoko, and higher G&A expenses. The increase in G&A was related to $1.2 million of non-recurrent items and higher expenses associated with the Roxgold acquisition.
Other items contained in net income were a foreign exchange loss of $3.1 million, withholding taxes of $4.0 million, and a gain of $5.9 million on derivative contracts ($6.4 million unrealized gain and $0.6 million realized loss).
Sales for the three months ended June 30, 2022 were $167.9 million, an increase of 39% from the $120.5 million compared to the same period of 2021. Negative sales price adjustments in the quarter were $6.6 million compared to positive adjustments of $1.4 million in Q2 2021. Sales by mine in the three months ended June 30, 2022 were as follows:
- Lindero recognized adjusted sales of $57.2 million from 30,546 ounces of gold ounces sold, a 68% increase from the same period in 2021. Higher gold sales were the result of increased performance at the three-stage crushing and stacking facility.
- Yaramoko recognized adjusted sales of $45.9 million from 24,598 ounces of gold sold.
- San Jose recognized adjusted sales of $39.6 million, a 34% decrease from the $60.3 million reported in the same period in 2021. Lower sales were driven by a 13% decrease in the volume of silver and 16% decrease in the volume of gold ounces sold which was driven by lower mined grades and lower realized silver prices.
- Caylloma recognized adjusted sales of $25.2 million, a 3% decrease from the $26.0 million reported in the same period in 2021. The decrease in sales was the result of lower realized prices for silver as well as a decline in gold production which is in line with plan.
Outlook on Cost and Inflation
Inflationary pressures continued in the second quarter of 2022 as a result of geopolitical events, supply chain constraints and increases in the cost of energy and commodities. These inflationary pressures were realized in the Company’s cost structure as prices increased for several key consumables including diesel, reagents, explosives and steel. The impact of inflation has been the most pronounced at the Lindero mine.
The inflation situation remains dynamic and the Company expects higher input costs to remain for the second half of the year and beyond. To mitigate inflationary pressure on its cost structure the Company will continue to focus on operational efficiencies and cost optimization across all mining operations. However, even with these efforts it is expected the continued cost pressure will push the San Jose and Lindero mines towards the upper end of our cost guidance.
Yaramoko’s all-in sustaining cost for the year is expected to be at the upper end of guidance as a result of additional capital development to provide earlier access than planned to the QV Prime zone at Bagassi South. The production benefit of access to QV Prime will be in 2023 and 2024 as activities through the second half of 2022 will focus primarily on development to the ore body and preparation for mining.
Caylloma remains on track to achieve cost guidance.
Liquidity
Total liquidity available to the Company as at June 30, 2022 was $136.1 million. The Company’s $200.0 million revolving credit facility was fully available as at the end of June 2022 and $20.0 million remained undrawn. Subsequent to June 30, 2022, the Company repaid $20.0 million to the credit facility bringing the total amount drawn to $160.0 million of the available $200.0 million.
Free cash flow from ongoing operations for the three months ended June 30, 2022 was $21.9 million compared to $19.2 million in Q2 2021. The increase was driven by positive changes in working capital and lower taxes paid compared to Q2 2021.
Construction and exploration expenses at Séguéla were $25.3 million for Q2 2022 and $68.1 million year to date.
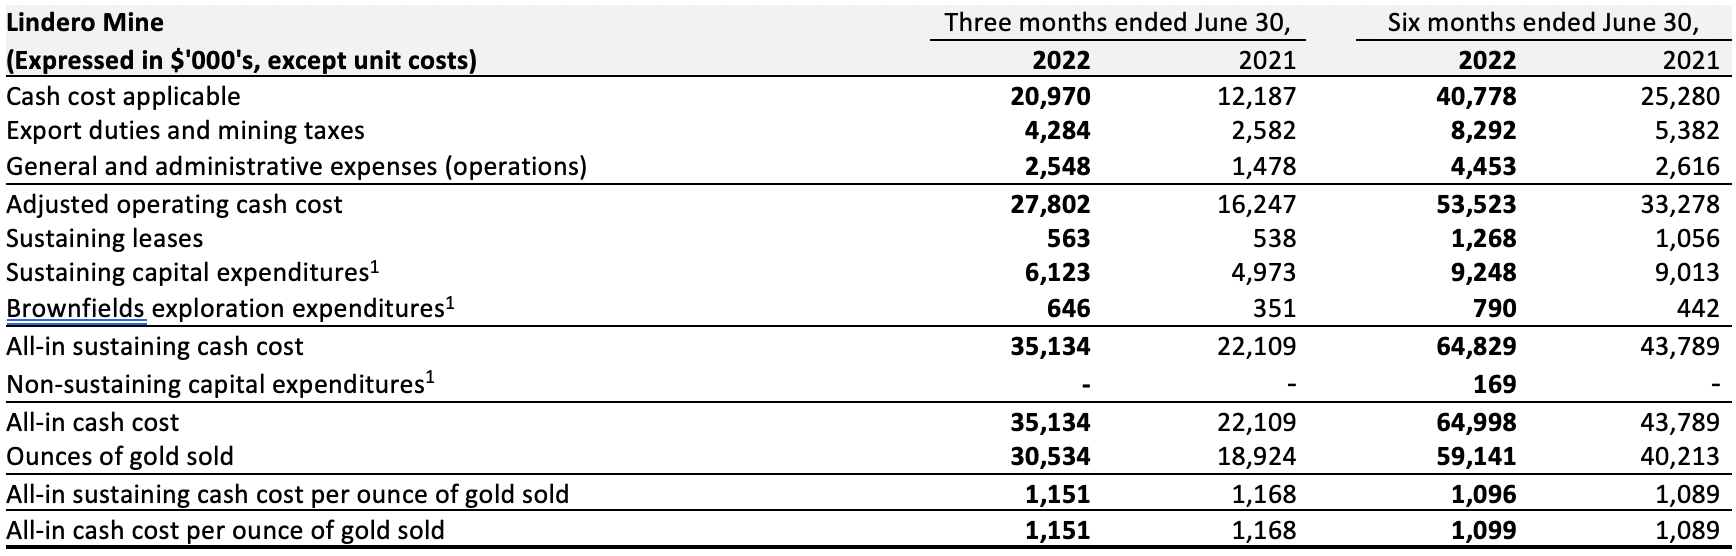
Lindero Mine, Argentina
- 1 Cash cost and AISC are non-IFRS financial measures. Refer to Non-IFRS Financial Measures.
The COVID-19 absenteeism impact on production experienced at the beginning of 2022 has been greatly mitigated by strong production in the second quarter.
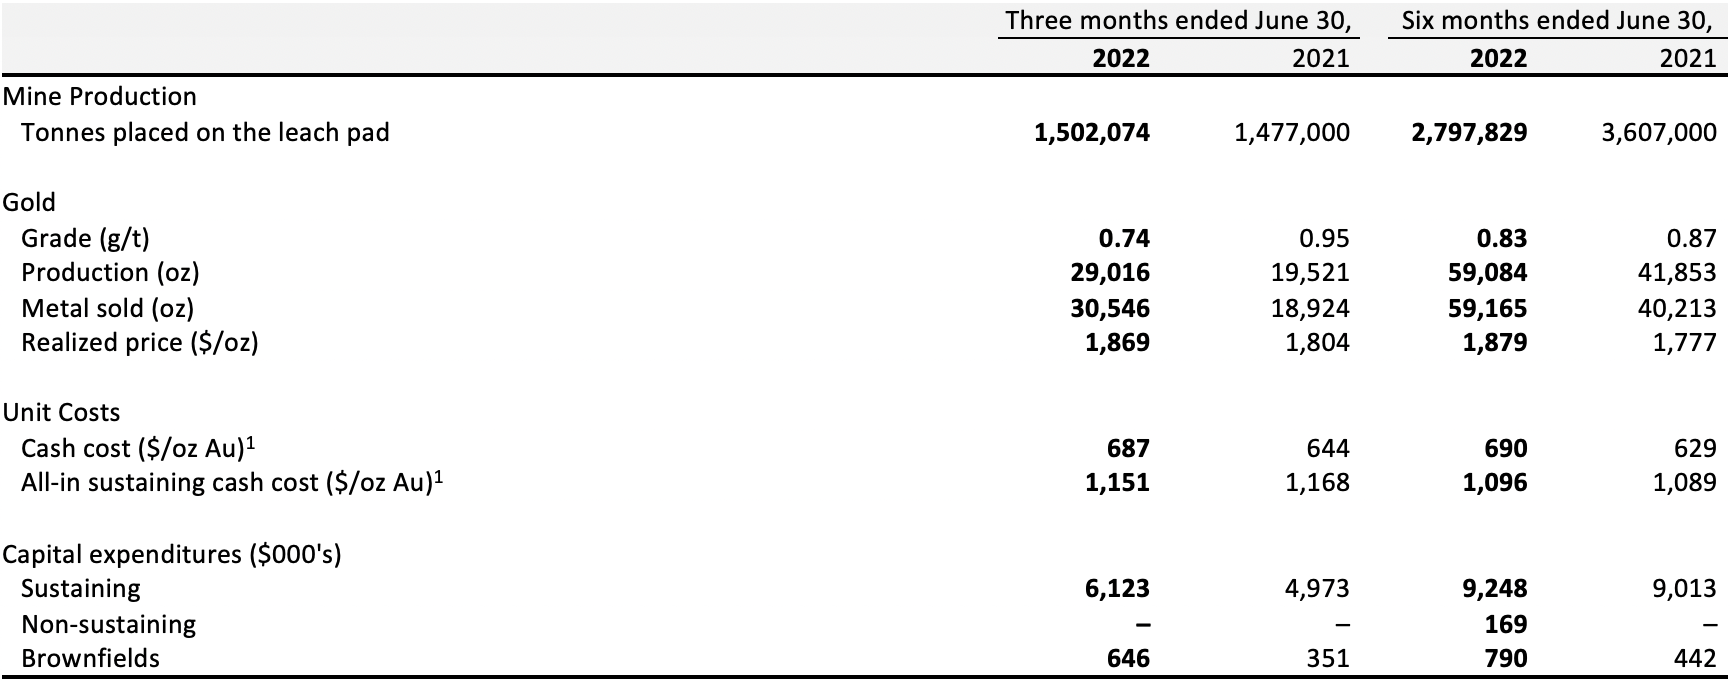
In the second quarter of 2022, a total of 1,502,074 tonnes of ore were placed on the heap leach pad, averaging 0.74 g/t gold, containing an estimated 35,784 ounces of gold. Gold production for Q2 2022 totaled 29,016 ounces, representing a 49% increase year-over-year. Higher gold production is explained by an increase in performance of the three-stage crushing and stacking circuits, which delivered 99% of the 1.5 million tonnes of ore placed on the pad in the quarter, compared to 46% or 0.7 million tonnes of the 1.47 million tonnes placed in the comparable quarter a year ago. Mine production was 2.2 million tonnes of mineralized material with a strip ratio of 1:1. The operation experienced a positive reconciliation for ore sent to the leach pad during the second quarter, with grades sampled at the plant being 17% higher than estimated from the reserve model.
As part of the continuous measures to improve productivity, management has implemented various high impact optimization initiatives to capture efficiencies at both the processing plant and the mining operation, some of which were implemented during the second quarter. These initiatives include: the optimization of cyanide recovery at the SART plant to significantly reduce fresh make-up cyanide consumption; lowering the consumption of sulfuric acid at the SART plant, whilst maintaining its efficiency rate and copper balance; and optimizing the mining strategy by implementing additional temporary ramps to significantly decrease trucking distance, improve truck productivity, and ultimately reduce trucking hours and total fleet diesel consumption, supporting the Company´s carbon footprint reduction strategy.
Cash cost per gold ounce sold was $687 for Q2 2022, compared to $644 in the second quarter of 2021. Cash costs per ounce of gold was higher due to higher consumable prices, mainly related to diesel, explosives, cyanide and cement, higher service costs related to equipment rentals, and higher labor costs due to foreign exchange and inflation. This was partially offset by the higher volume of gold sold.
All-in sustaining cash costs per gold ounce sold was $1,151 during Q2 2022 compared with $1,168 in the second quarter of 2021. All-in sustaining costs for the second quarter of 2022 were impacted by the production issues described above and offset by lower sustaining capital related to timing effects.
Sustaining capital for the quarter primarily consisted of spending on leach pad expansion and mine maintenance. Brownfields capital mainly relates to exploration at the Arizaro project.
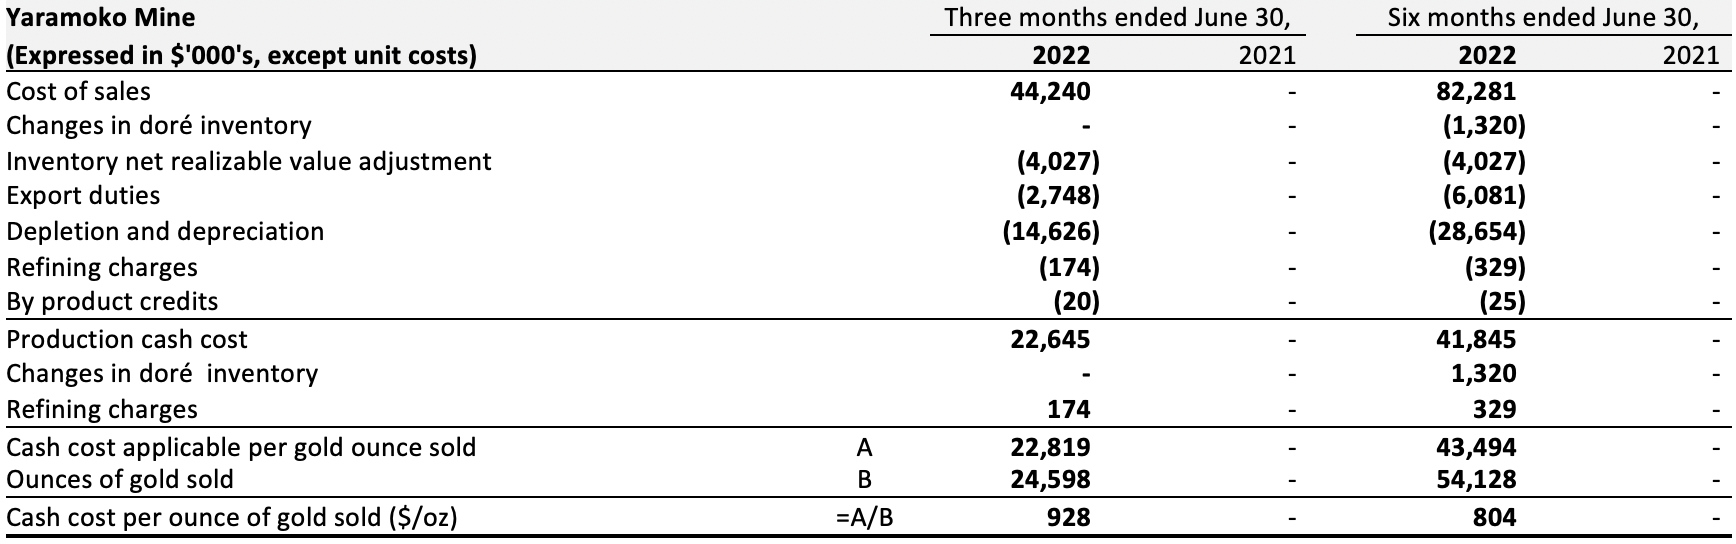
Yaramoko Mine Complex, Burkina Faso
- 1 Cash cost and AISC are non-IFRS financial measures. Refer to Non-IFRS Financial Measures.
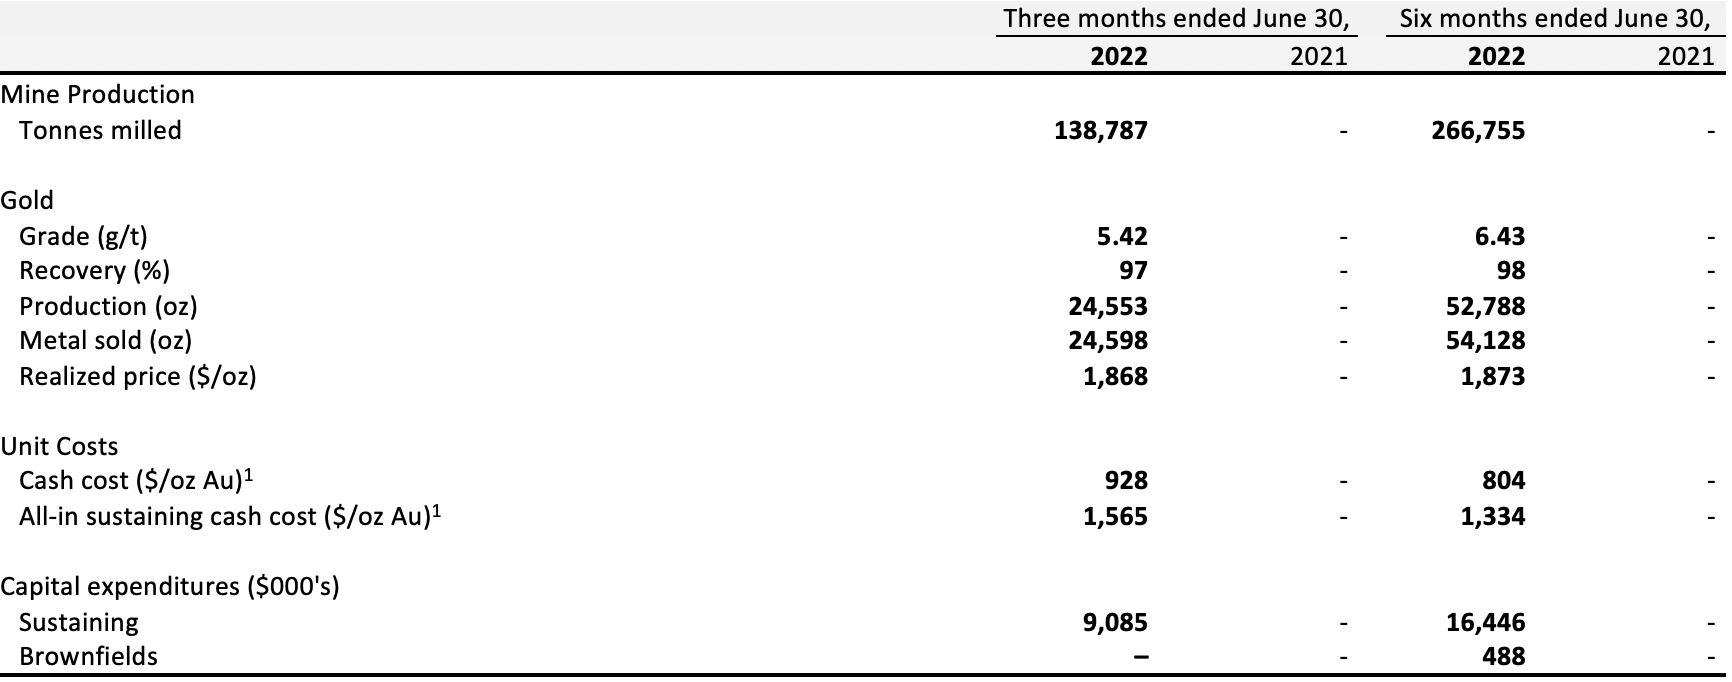
- 2 The Yaramoko Mine was acquired as part of the acquisition of Roxgold which completed on July 2, 2021. As such comparative figures for the comparative periods in 2021 are not presented.
The Yaramoko Mine produced 24,553 ounces of gold in the second quarter of 2022 with an average gold head grade of 5.42 g/t, which is in line with the mining sequence and Mineral Reserve estimate. Gold production at the Yaramoko Mine is on track to meet the annual guidance range.
Cash cost per gold ounce sold was $928, which was below plan, primarily due to higher mine production and lower indirect costs during Q2 2022, slightly offset by lower head grade.
All-in sustaining cash cost per gold ounce sold was $1,565 for Q2 2022, which was below plan, primarily due to higher production, partially offset by a write-down of low grade stockpiles to net realizable value.
Sustaining capital for the Q2 2022 consisted primarily of mine development.
San Jose Mine, Mexico
- 1 Production cash cost silver equivalent and All-in sustaining cash cost silver equivalent are calculated using realized metal prices for each period respectively
- 2 Production cash cost, Production cash cost silver equivalent, and All-in sustaining cash cost silver equivalent are Non-IFRS Financial Measures, refer to Non-IFRS Financial Measures
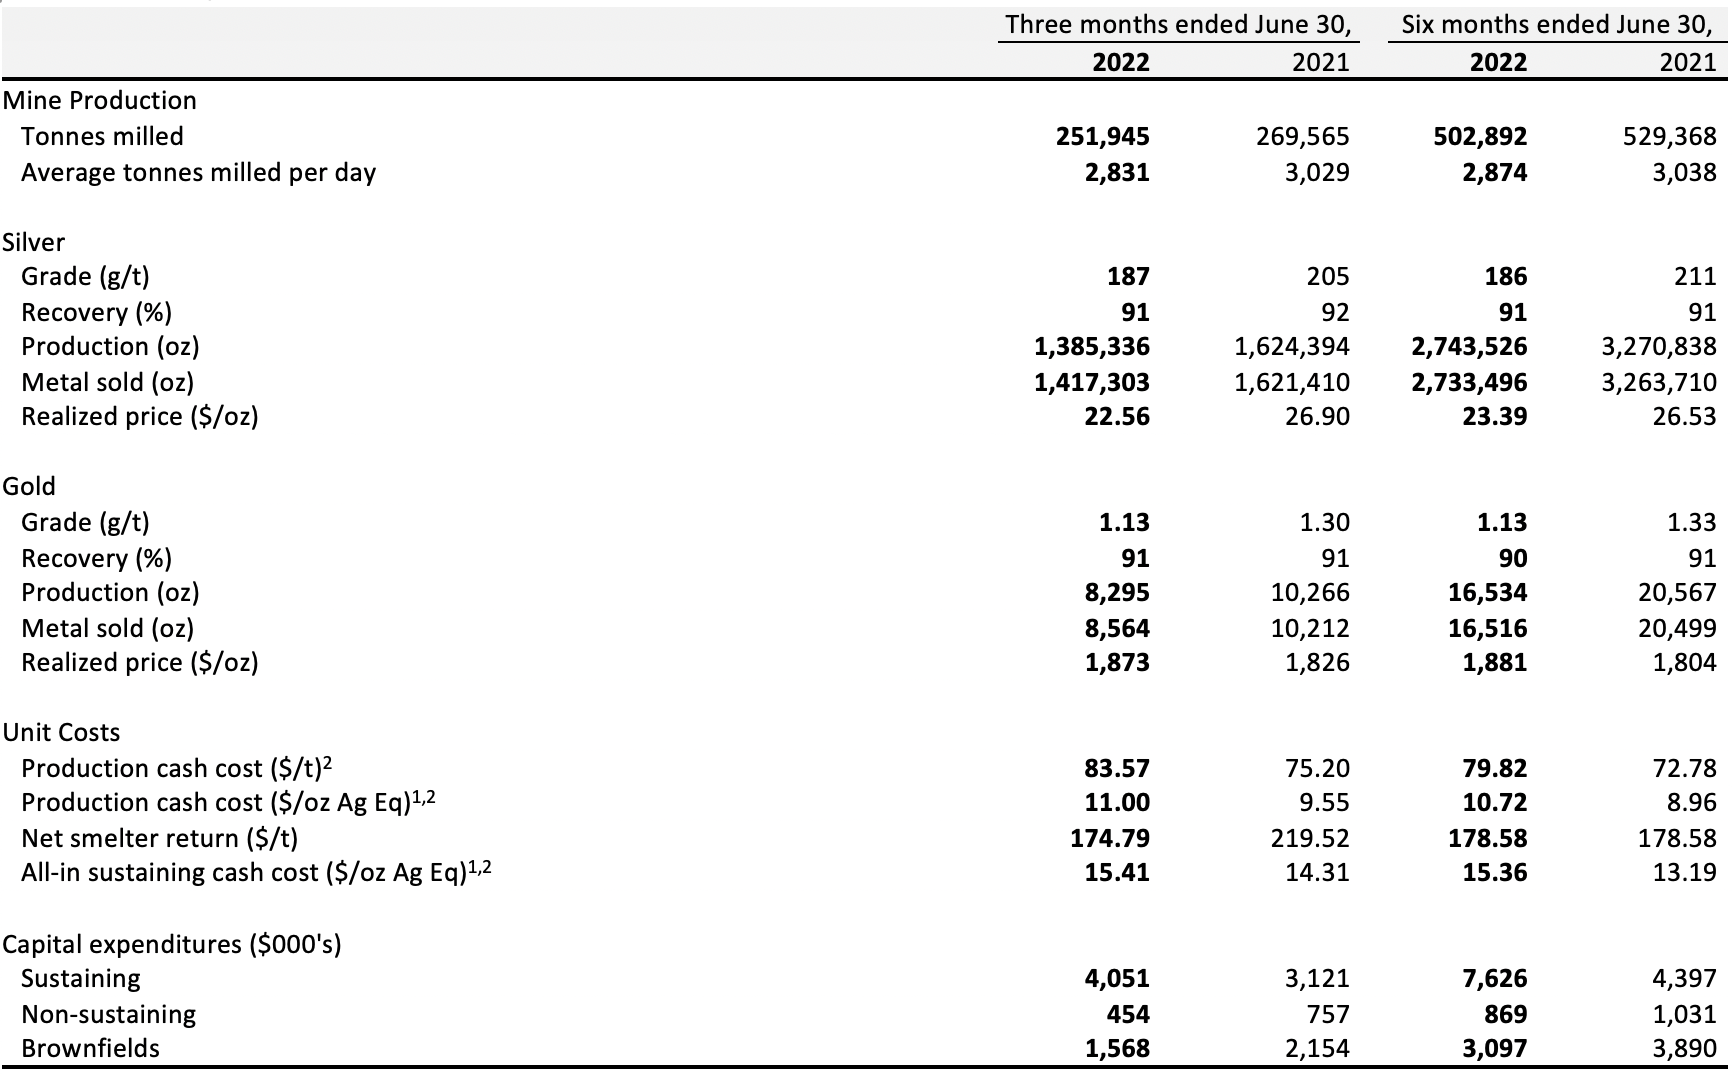
In the second quarter of 2022, the San Jose Mine produced 1,385,336 ounces of silver and 8,295 ounces of gold, 15% and 19% lower, respectively, than the comparable period in the prior year. The decreases are a result of a combination of 7% lower mill throughput, and lower average head grades of 9% for silver and 13% for gold, which are in line with the mining sequence and Mineral Reserve estimates. The mine remains on track to achieve its annual production guidance.
The San Jose team has successfully implemented long hole stoping in select areas of the mine in 2022, with the aim to improve production capacity and reduce total mining cost per tonne. In addition, a new underground shotcrete plant was commissioned in the second quarter which is expected to reduce overall mining cycle times and support costs.
The cash cost per tonne for the three months ended June 30, 2022 was $83.57 per tonne compared to $75.20 per tonne in the same period in 2021 primarily due to inflation, non-recurring maintenance and lower tonnes processed.
The all-in sustaining cash cost of payable silver equivalent for the second quarter in 2022 increased 8% to $15.41 per ounce, compared to $14.31 per ounce for the same period in 2021. The increase in all-in sustaining costs was primarily due to the result of lower silver equivalent ounces sold and increased cash costs as highlighted above.
Capital expenditures in the quarter primarily consisted of mine development. Capital expenditures were lower than the same period in 2021 primarily due to timing.
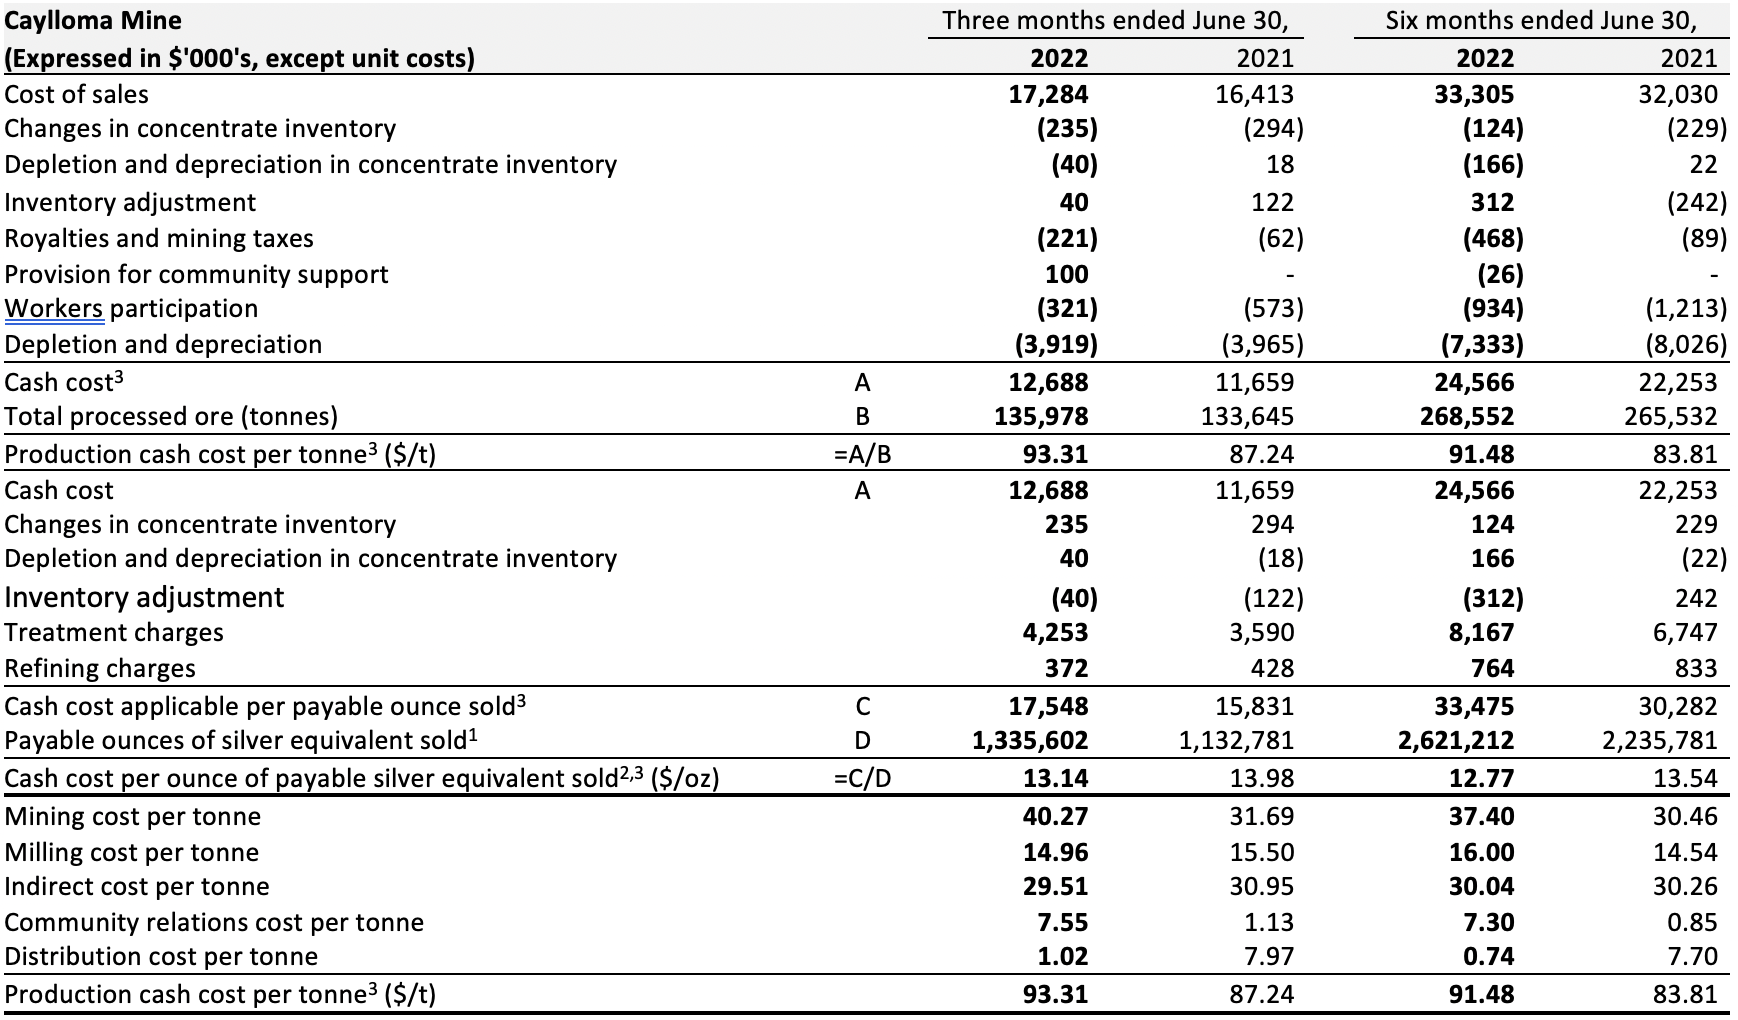
Caylloma Mine, Peru
- 1 Production cash cost silver equivalent and All-in sustaining cash cost silver equivalent are calculated using realized metal prices for each period respectively
- 2 Production cash cost, Production cash cost silver equivalent, and All-in sustaining cash cost silver equivalent are Non-IFRS Financial Measures, refer to Non-IFRS Financial Measures
The Caylloma Mine produced 267,559 ounces of silver, 7.6 million pounds of lead, and 10.9 million pounds of zinc during the three months ended June 30, 2022. The operation delivered another strong quarter of operational performance and is tracking well to deliver total production in the upper range of guidance. Silver production had an average head grade of 77 g/t which was in line with expectation. Lead production was 6% lower than the comparable period due to lower grades while zinc production was 7% lower than the comparable period due to lower grades. Gold production totaled 307 ounces with an average head grade of 0.17 g/t which was in line with expectations.
The cash cost per tonne of processed ore for the three months ended June 30, 2022 increased 7% to $93.31 compared to $87.24 in the same period in 2021. The increase was mainly the result of high inflation on mine costs, unexpected dewatering costs and increased mill maintenance.
The all-in sustaining cash cost for the three months ended June 30, 2022 decreased 4% to $18.19 per ounce compared to $18.94 per ounce for the same period in 2021. The decrease was mainly driven by higher silver equivalent production due to lower realized silver prices.
Sustaining capital expenditures for the quarter primarily related to greater execution of the development located in level 16 and the opening of level 18. The decrease in Brownfields capital expenditures was due to lower spending on drilling and development.
Qualified Person
Eric Chapman, Senior Vice President of Technical Services, is a Professional Geoscientist of the Association of Professional Engineers and Geoscientists of the Province of British Columbia (Registration Number 36328), and is the Company’s Qualified Person (as defined by National Instrument 43-101). Mr. Chapman has reviewed and approved the scientific and technical information contained in this news release and has verified the underlying data.
Non-IFRS Financial Measures
The Company has disclosed certain financial measures and ratios in this news release which are not defined under the International Financial Reporting Standards (“IFRS”), as issued by the International Accounting Standards Board, and are not disclosed in the Company’s financial statements, including but not limited to: cash cost per ounce of gold sold; all-in sustaining cash cost per ounce of gold sold; all-in cash cost per ounce of gold sold; total production cash cost per tonne; cash cost per payable ounce of silver equivalent sold; all-in sustaining cash cost per payable ounce of silver equivalent sold; all-in cash cost per payable ounce of silver equivalent sold; free cash flow from ongoing operations; adjusted net income; adjusted EBITDA and working capital.
These non-IFRS financial measures and non-IFRS ratios are widely reported in the mining industry as benchmarks for performance and are used by management to monitor and evaluate the Company’s operating performance and ability to generate cash. The Company believes that, in addition to financial measures and ratios prepared in accordance with IFRS, certain investors use these non-IFRS financial measures and ratios to evaluate the Company’s performance. However, the measures do not have a standardized meaning under IFRS and may not be comparable to similar financial measures disclosed by other companies. Accordingly, non-IFRS financial measures and non-IFRS ratios should not be considered in isolation or as a substitute for measures and ratios of the Company’s performance prepared in accordance with IFRS. The Company has calculated these measures consistently for all periods presented.
To facilitate a better understanding of these measures and ratios as calculated by the Company, descriptions are provided below. In addition, see “Non-IFRS Financial Measures” in the Company’s management’s discussion and analysis for the three and six months ended June 30, 2022 (“Q2 2022 MD&A”), which section is incorporated by reference in this news release, for additional information regarding each non-IFRS financial measure and non-IFRS ratio disclosed in this news release, including an explanation of their composition; an explanation of how such measures and ratios provide useful information to an investor and the additional purposes, if any, for which management of Fortuna uses such measures and ratio. The Q2 2022 MD&A may be accessed on SEDAR at www.sedar.com under the Company’s profile, Fortuna Silver Mines Inc.
Except as otherwise described in the Q2 2022 MD&A, the Company has calculated these measures consistently for all periods presented.
Adjusted Net Income for the Three and Six Months Ended June 30, 2022 and 2021
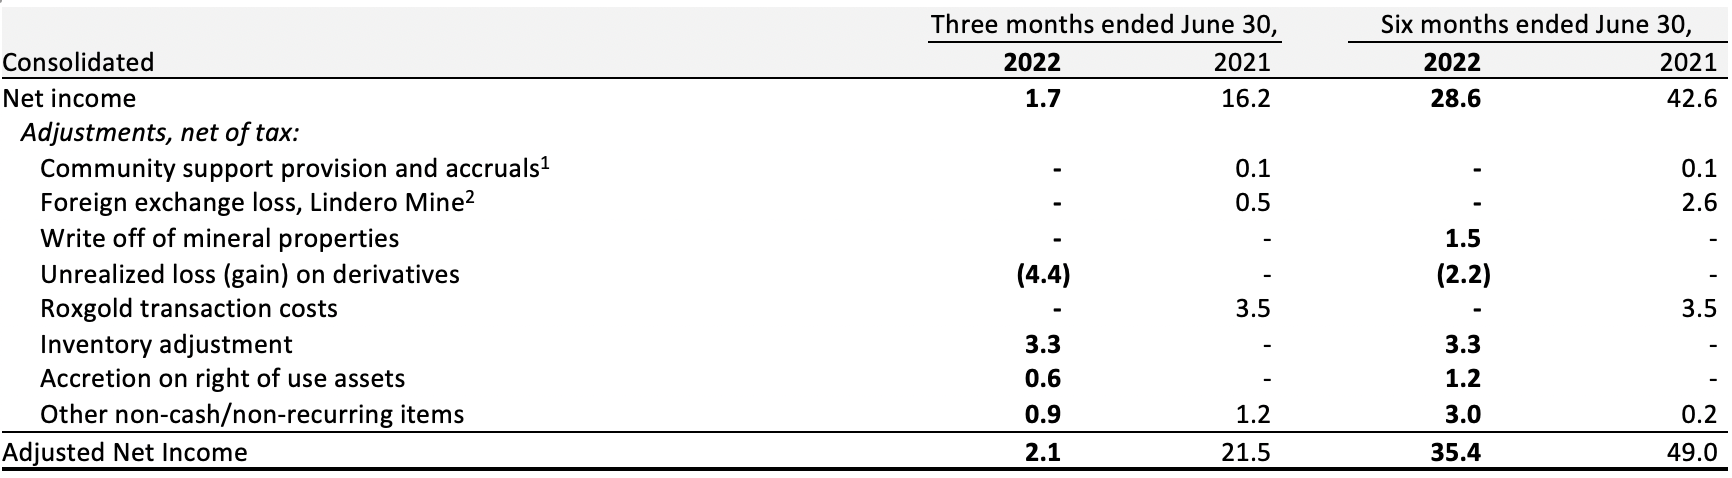
- 1 Amounts are recorded in Cost of sales
- 2 Amounts are recorded in General and Administration
- Figures may not add due to rounding
Adjusted EBITDA for the Three and Six Months Ended June 30, 2022 and 2021
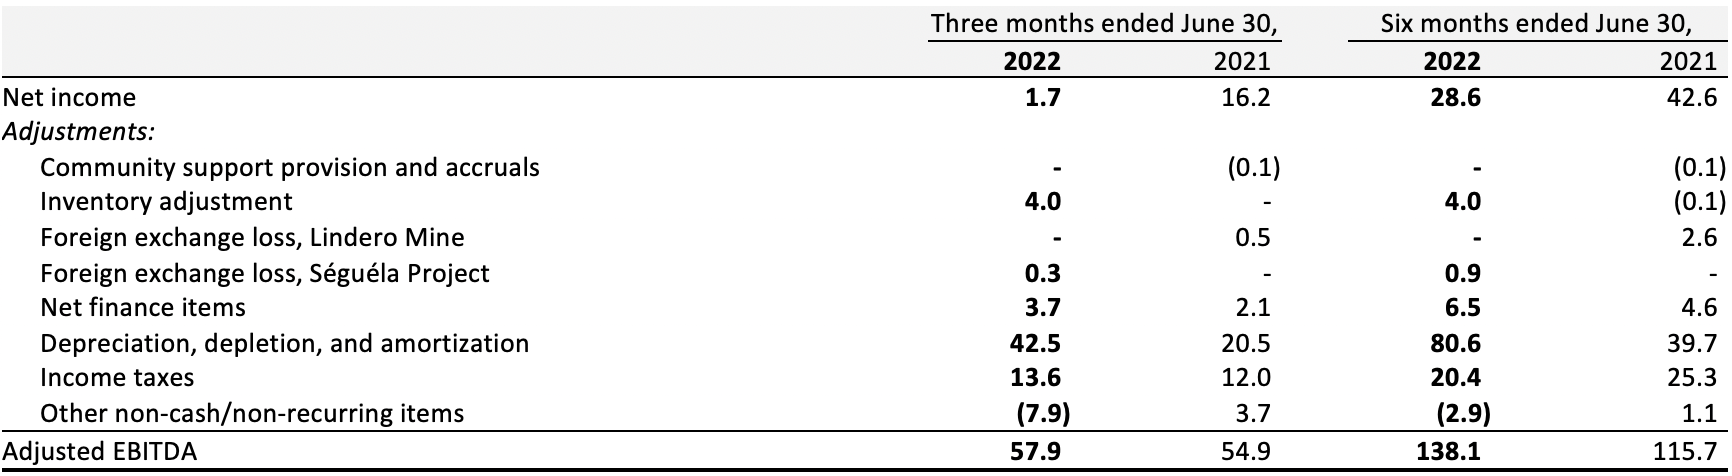
- Figures may not add due to rounding
Free Cash Flow from ongoing operations for the Three and Six Months Ended June 30, 2022 and 2021
In 2022, the Company changed the method for calculating Free Cash Flow from Ongoing Operations. The calculation now uses taxes paid as opposed to the previous method which used current income taxes. While this may create larger quarter over quarter fluctuations due to the timing of income tax payments, management believes the revised method is a better representation of the Free Cash Flow generated by the Company’s ongoing operations. Comparative values from 2021 have been restated using the change in methodology.
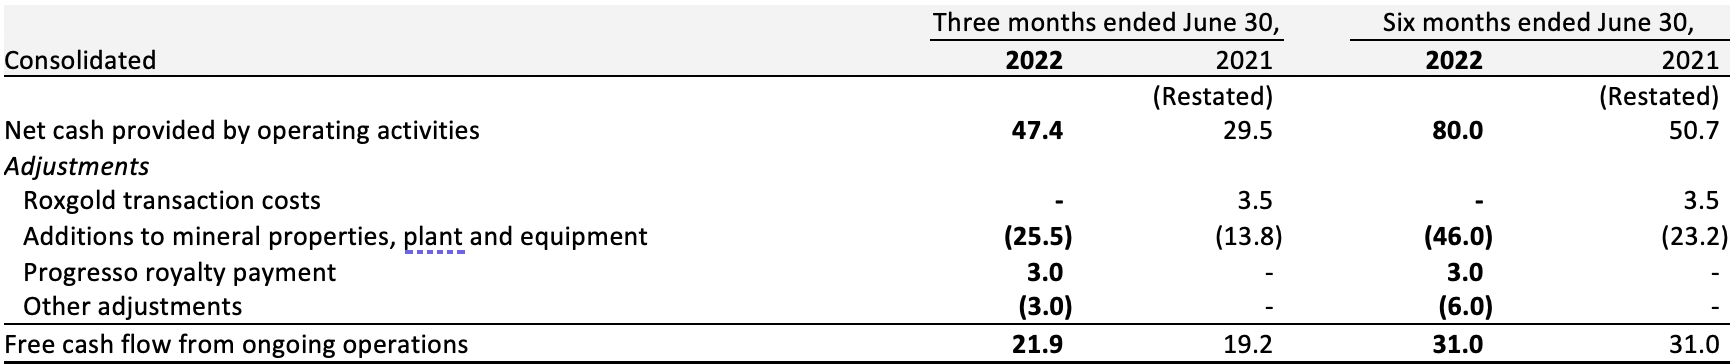
- Figures may not add due to rounding
Cash Cost per Ounce of Gold Sold for the Three and Six Months Ended June 30, 2022 and 2021
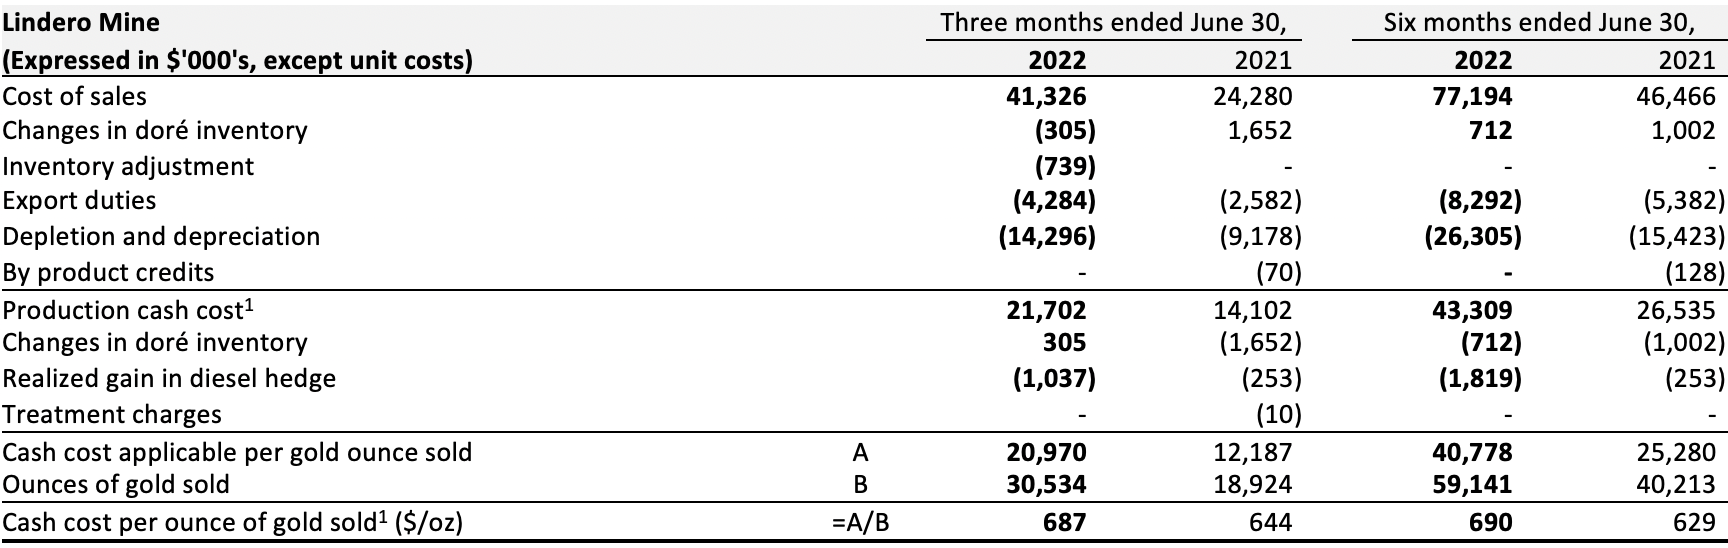
- 1 June 30, 2021 restated, Sustaining leases moved to All-In Sustaining
All-in Sustaining Cash Cost per Ounce of Gold Sold for the Three and Six Months Ended June 30, 2022 and 2021
- 1 Presented on a cash basis

- 1 Presented on a cash basis
Production Cash Cost per Tonne and Cash Cost per Payable Ounce of Silver Equivalent Sold

- 1 Silver equivalent sold for Q2 2022 is calculated using a silver to gold ratio of 83.0:1 (Q2 2021: 67.9:1). Silver equivalent sold for YTD 2022 is calculated using a silver to gold ratio of 80.5:1 (YTD 2021: 68.0:1).
- 2 Silver equivalent is calculated using the realized prices for gold and silver. Refer to Financial Results – Sales and Realized Prices
- 3 June 30, 2021 restated, Sustaining leases moved to All-In Sustaining
- 1 Silver equivalent sold for Q2 2022 is calculated using a silver to gold ratio of 82.9:1 (Q2 2021: 68.1:1), silver to lead ratio of 1:22.5 pounds (Q2 2021: 1:27.9), and silver to zinc ratio of 1:12.8 pounds (Q2 2021: 1:20.0). Silver equivalent sold for YTD 2022 is calculated using a silver to gold ratio of 79.8:1 (YTD 2021: 67.8:1), silver to lead ratio of 1:22.5 pounds (YTD 2021: 1:28.2), and silver to zinc ratio of 1:13.4 pounds (YTD 2021: 1:20.6).
- 2 Silver equivalent is calculated using the realized prices for gold, silver, lead, and zinc. Refer to Financial Results – Sales and Realized Prices
- 3 June 30, 2021 restated, Sustaining leases moved to All-In Sustaining
Original Article: https://fortunasilver.com/investors/news/fortuna-reports-results-for-the-second-quarter-of-2022/


