Record operating cash flow of $86 million in the fourth quarter and $297 million in 2019
TORONTO, Feb. 19, 2020 (GLOBE NEWSWIRE) — Alamos Gold Inc. (TSX:AGI; NYSE:AGI) (“Alamos” or the “Company”) today reported its financial results for the quarter and year ended December 31, 2019.
“We reported a solid fourth quarter and 2019. We met our production guidance for the fifth consecutive year, and we met our cost guidance with a 10% reduction in total cash costs from a year ago. Stronger gold prices and lower costs drove a 40% increase in operating cash flow,” said John A. McCluskey, President and Chief Executive Officer.
“We expect 2020 will be a transformational year for Alamos driven by several significant catalysts. On the back of another substantial increase in Mineral Reserves and Resources at Island Gold it is clear the ore body is evolving into a world class deposit. A Phase III expansion study will be completed in the second quarter and is expected to showcase a larger, highly profitable and longer-life operation. The lower mine expansion at Young-Davidson is on track for completion in June after which we expect to transition to strong free cash flow growth,” Mr. McCluskey added.
Fourth Quarter 2019
- Produced 122,100 ounces of gold, consistent with guidance, driven by strong performances at Young-Davidson and Island Gold
- Island Gold produced 38,600 ounces of gold and generated mine-site free cash flow1 of $9.4 million
- Young-Davidson produced 48,000 ounces of gold and achieved underground mining rates of 7,000 tonnes per day (“tpd”), exceeding budgeted mining rates for the fourth consecutive quarter and marking the second highest quarterly mining rate ever. Construction of the lower mine expansion remains on schedule with the tie-in of the upper and lower mines on track for completion in June 2020
- Sold 127,148 ounces of gold at an average realized price of $1,463 per ounce for record revenues of $186.0 million
- Record cash flow from operating activities of $77.8 million (and a record $85.7 million, or $0.22 per share, before changes in working capital1), reflecting higher gold prices and operating margins
- Consolidated total cash costs1 of $722 per ounce were in line with annual guidance and 6% lower than the fourth quarter of 2018, driven by low cost production growth at Island Gold
- All-in sustaining costs (“AISC”)1 decreased slightly from the fourth quarter of 2018 to $972 per ounce, reflecting the timing of capital spending. Full year AISC of $951 per ounce were in line with guidance
- Reported adjusted net earnings1 of $32.1 million, or $0.08 per share1, include adjustments for unrealized foreign exchange gains recorded within deferred taxes of $8.6 million, partially offset by other one-time losses and tax adjustments totaling $2.7 million
- Realized net earnings of $38.0 million, or $0.10 per share
- Ended the quarter with no debt, cash and cash equivalents of $182.8 million, and equity securities of $22.8 million
- Completed construction of the Cerro Pelon mine ahead of schedule and achieved initial production in the fourth quarter
- Announced a 50% increase to the quarterly dividend, commencing in the first quarter of 2020
Full Year 2019
- Produced 494,500 ounces of gold, meeting production guidance for the fifth consecutive year
- Island Gold exceeded guidance with record production of 150,400 ounces, driving record mine-site free cash flow1 of $64.5 million
- Sold 494,702 ounces of gold at an average realized price of $1,381 per ounce for record revenues of $683.1 million
- Total cash costs1 of $720 per ounce and AISC1 of $951 per ounce were both in line with guidance. Cost of sales of $1,054 per ounce were 2% below guidance reflecting lower amortization charges
- Realized adjusted net earnings1 of $83.5 million, or $0.21 per share1, a 326% increase compared to 2018. Adjusted net earnings include adjustments for unrealized foreign exchange gains recorded within both deferred taxes and foreign exchange of $13.5 million, partially offset by other items totaling $0.9 million
- Reported net earnings of $96.1 million, or $0.25 per share
- Record cash flow from operating activities of $260.4 million ($296.9 million, or $0.76 per share, before changes in working capital1, a 40% increase from 2018)
- Generated total mine-site free cash flow of $61.7 million1 with strong cash flow more than funding the lower mine expansion at Young-Davidson, exploration activities at Island Gold, and construction of Cerro Pelon
- Reported year end 2019 Mineral Reserves of 9.7 million ounces, a slight increase over 2018 with additions at Island Gold, La Yaqui Grande and Kirazlı more than offsetting mining depletion (2)
- Ongoing exploration success at Island Gold drove a 21% increase in Mineral Reserves and 46% increase in Inferred Mineral Resources from the end of 2018 for a combined increase of nearly one million ounces
- Received permit approval for the Phase II expansion of Island Gold to 1,200 tpd in May 2019
- Completed permitting of the La Yaqui Grande project in Mexico in July 2019
- Announced the suspension of construction activities at the Kirazlı project in Turkey pending the renewal of the Company’s mining concessions which expired on October 13, 2019
- Received the “Best Corporate Social Responsibility Practice 2019” award from the Mexican Center for Philanthropy (Cemefi) and the Alliance for Corporate Social Responsibility in Mexico (AliaRSE) for the Company’s voluntary relocation program of residents from Mulatos to Matarachi in Mexico
- Repurchased 2.7 million shares at a cost of $11.4 million, or $4.17 per share under the Normal Course Issuer Bid (“NCIB”)
- Paid $15.6 million in dividends, double the amount paid in 2018
- Sold non-core royalties to Metalla Royalty & Streaming Ltd. (“Metalla”) for 2.1 million shares of Metalla, currently valued at $12.4 million
(1) Refer to the “Non-GAAP Measures and Additional GAAP Measures” disclosure at the end of this press release and associated MD&A for a description and calculation of these measures.
(2) Refer to press release dated February 18, 2020 entitled: “Alamos Gold Reports Mineral Reserves and Resources for the Year-Ended 2019”.
Highlight Summary
| Three Months Ended December 31, | Years Ended December 31, | |||||||
| 2019 | 2018 | 2019 | 2018 | |||||
| Financial Results (in millions) | ||||||||
| Operating revenues | $186.0 | $163.1 | $683.1 | $651.8 | ||||
| Cost of sales (1) | $136.0 | $207.1 | $521.4 | $639.4 | ||||
| Earnings (loss) from operations | $41.6 | ($51.3 | ) | $126.0 | ($22.6 | ) | ||
| Net earnings (loss) | $38.0 | ($71.5 | ) | $96.1 | ($72.6 | ) | ||
| Adjusted net earnings (2) | $32.1 | $4.3 | $83.5 | $19.6 | ||||
| Earnings before interest, depreciation and amortization (2) | $88.4 | $43.0 | $296.4 | $195.2 | ||||
| Cash provided by operations before working capital and cash taxes(2) | $85.7 | $52.8 | $296.9 | $212.7 | ||||
| Cash provided by operating activities | $77.8 | $47.4 | $260.4 | $213.9 | ||||
| Capital expenditures (sustaining) (2) | $23.3 | $21.4 | $76.8 | $63.8 | ||||
| Capital expenditures (growth) (2) | $43.6 | $36.4 | $169.1 | $139.2 | ||||
| Capital expenditures (capitalized exploration) (3) | $6.0 | $3.7 | $17.7 | $18.5 | ||||
| Operating Results | ||||||||
| Gold production (ounces) | 122,100 | 125,600 | 494,500 | 505,000 | ||||
| Gold sales (ounces) | 127,148 | 131,161 | 494,702 | 509,879 | ||||
| Per Ounce Data | ||||||||
| Average realized gold price | $1,463 | $1,244 | $1,381 | $1,278 | ||||
| Average spot gold price (London PM Fix) | $1,481 | $1,227 | $1,393 | $1,268 | ||||
| Cost of sales per ounce of gold sold (includes amortization) (1) | $1,070 | $1,579 | $1,054 | $1,254 | ||||
| Total cash costs per ounce of gold sold (2) | $722 | $770 | $720 | $802 | ||||
| All-in sustaining costs per ounce of gold sold (2) | $972 | $983 | $951 | $989 | ||||
| Share Data | ||||||||
| Earnings per share, basic and diluted | $0.10 | ($0.18 | ) | $0.25 | ($0.19 | ) | ||
| Adjusted earnings per share, basic and diluted(2) | $0.08 | $0.01 | $0.21 | $0.05 | ||||
| Weighted average common shares outstanding (basic) (000’s) | 391,076 | 390,540 | 390,160 | 389,816 | ||||
| Financial Position (in millions) | ||||||||
| Cash and cash equivalents | $182.8 | $206.0 |
(1) Cost of sales includes mining and processing costs, royalties, and amortization expense.
(2) Refer to the “Non-GAAP Measures and Additional GAAP Measures” disclosure at the end of this press release and associated MD&A for a description and calculation of these measures.
(3) Includes capitalized exploration at Mulatos and Island Gold.
| Three Months Ended December 31, | Years Ended December 31, | |||||||||||
| 2019 | 2018 | 2019 | 2018 | |||||||||
| Gold production (ounces) | ||||||||||||
| Young-Davidson | 48,000 | 50,900 | 188,000 | 180,000 | ||||||||
| Mulatos | 34,100 | 35,600 | 142,000 | 175,500 | ||||||||
| Island Gold | 38,600 | 29,000 | 150,400 | 105,800 | ||||||||
| El Chanate (1) | 1,400 | 10,100 | 14,100 | 43,700 | ||||||||
| Gold sales (ounces) | ||||||||||||
| Young-Davidson | 51,694 | 51,944 | 188,785 | 185,593 | ||||||||
| Mulatos | 34,127 | 38,819 | 141,496 | 175,104 | ||||||||
| Island Gold | 39,652 | 30,199 | 149,746 | 105,520 | ||||||||
| El Chanate (1) | 1,675 | 10,199 | 14,675 | 43,662 | ||||||||
| Cost of sales (in millions)(2) | ||||||||||||
| Young-Davidson | $59.4 | $61.5 | $231.1 | $235.0 | ||||||||
| Mulatos | $35.8 | $38.4 | $138.9 | $173.1 | ||||||||
| Island Gold | $36.4 | $28.7 | $129.4 | $106.5 | ||||||||
| El Chanate | $4.4 | $78.5 | $22.0 | $124.8 | ||||||||
| Cost of sales per ounce of gold sold (includes amortization) | ||||||||||||
| Young-Davidson | $1,149 | $1,184 | $1,224 | $1,266 | ||||||||
| Mulatos | $1,049 | $989 | $982 | $989 | ||||||||
| Island Gold | $918 | $950 | $864 | $1,009 | ||||||||
| El Chanate | $2,627 | $7,697 | $1,499 | $2,858 | ||||||||
| Total cash costs per ounce of gold sold (3) | ||||||||||||
| Young-Davidson | $766 | $764 | $800 | $822 | ||||||||
| Mulatos | $820 | $793 | $784 | $786 | ||||||||
| Island Gold | $507 | $570 | $495 | $589 | ||||||||
| El Chanate | $2,448 | $1,304 | $1,390 | $1,289 | ||||||||
| Mine-site all-in sustaining costs per ounce of gold sold (3),(4) | ||||||||||||
| Young-Davidson | $1,083 | $974 | $1,047 | $1,017 | ||||||||
| Mulatos | $891 | $881 | $868 | $855 | ||||||||
| Island Gold | $653 | $834 | $656 | $781 | ||||||||
| El Chanate | $2,448 | $1,333 | $1,411 | $1,317 | ||||||||
| Capital expenditures (sustaining, growth and capitalized exploration) (in millions)(3) | ||||||||||||
| Young-Davidson | $27.0 | $23.1 | $99.9 | $86.6 | ||||||||
| Mulatos(5) | $9.5 | $11.8 | $54.2 | $35.3 | ||||||||
| Island Gold (6) | $24.7 | $16.8 | $68.9 | $66.1 | ||||||||
| El Chanate | $— | $0.1 | $— | $0.6 | ||||||||
| Other | $11.7 | $9.7 | $40.6 | $32.9 |
(1) El Chanate ceased mining activities in October 2018 and transitioned to residual leaching.
(2) Cost of sales includes mining and processing costs, royalties and amortization.
(3) Refer to the “Non-GAAP Measures and Additional GAAP Measures” disclosure at the end of this press release and associated MD&A for a description and calculation of these measures.
(4) For the purposes of calculating mine-site all-in sustaining costs, the Company does not include an allocation of corporate and administrative and share based compensation expenses.
(5) Includes capitalized exploration at Mulatos of $1.3 for the three and twelve months ended December 31, 2019 ($0.6 million and $2.9 million for the three and twelve months ended December 31, 2018).
(6) Includes capitalized exploration at Island Gold of $4.7 million and $16.4 million for the three and twelve months ended December 31, 2019 ($3.1 million and $15.6 million for the three and twelve months ended December 31, 2018)
Outlook and Strategy
| 2020 Guidance | |||||
| Young-Davidson | Island Gold | Mulatos | Other (2) | Total | |
| Gold production (000’s ounces) | 145-160 | 130-145 | 150-160 | 425-465 | |
| Cost of sales, including amortization (in millions) (4) | $207 | $120 | $168 | — | $ 495 |
| Cost of sales, including amortization ($ per ounce) (4) | $1,360 | $880 | $1,085 | — | $ 1,130 |
| Total cash costs ($ per ounce) (1) | $910-950 | $520-560 | $840-880 | — | $770-810 |
| All-in sustaining costs ( $ per ounce) (1) | — | $1,020-1,060 | |||
| Mine-site all-in sustaining costs ($ per ounce) (1),(3) | $1,110-1,150 | $780-820 | $940-980 | — | — |
| Amortization costs ($ per ounce) (1) | $430 | $340 | $225 | — | $ 340 |
| Capital expenditures (in millions) | |||||
| Sustaining capital(1) | $30-35 | $35-40 | $15-20 | — | $80-95 |
| Growth capital(1) | $45-50 | $15-20 | $5 | $10 | $75-85 |
| Capitalized exploration(1) | $1 | $19 | — | $5 | $ 25 |
| Total capital expenditures and capitalized exploration(1) | $76-86 | $69-79 | $20-25 | $15 | $180-205 |
(1) Refer to the “Non-GAAP Measures and Additional GAAP” disclosure at the end of this press release and associated MD&A for a description of these measures.
(2) Includes growth capital and capitalized exploration at the Company’s development projects (Turkey, Lynn Lake, Esperanza and Quartz Mountain).
(3) For the purposes of calculating mine-site all-in sustaining costs at individual mine sites, the Company does not include an allocation of corporate and administrative and share based compensation expenses to the mine sites.
(4) Cost of sales includes mining and processing costs, royalties, and amortization expense, and is calculated based on the mid-point of guidance.
The Company’s long-term strategic objective is to generate increasing returns for its shareholders through low-cost production and free cash flow growth from its existing operations and portfolio of development projects. The Company was successful in achieving these objectives in 2019, with production of 494,500 ounces of gold and a 10% reduction in total cash costs driving record operating cash flow. In addition, the Company made substantial progress on its growth initiatives having completed construction of the low-cost Cerro Pelon mine in Mexico, and advancing construction of the lower mine expansion at Young-Davidson.
With several significant near term positive catalysts, 2020 is expected to be a transformational year for Alamos. These include the recently announced substantial increase in high-grade Mineral Reserves and Resources at Island Gold; the Phase III expansion study of Island Gold which is expected to be competed in June and demonstrate a larger, very profitable, long-life operation; the completion of the lower mine expansion at Young-Davidson which remains on track for June; and the transition to strong company-wide free cash flow starting in the second half of 2020.
Production is expected to temporarily decrease in 2020 to between 425,000 and 465,000 ounces of gold. This reflects the previously guided lower production from Young-Davidson during the first half of 2020 while completing the tie-in of the upper and lower mines, as well as the end of production at El Chanate. Total cash cost guidance of $770 to $810 per ounce and AISC guidance of $1,020 to $1,060 per ounce are temporarily higher reflecting lower gold production at Young-Davidson during the tie-in period in the first half of 2020. Gold production in the first quarter of 2020 is expected to be within a range of 105,000 to 110,000 ounces, consistent with annual guidance. Costs are expected to be higher in the first half of 2020 and decrease in the second half with the completion of the lower mine tie-in at Young-Davidson. In 2021, production is expected to increase to approximately 500,000 ounces at lower costs driven by higher mining and production rates at Young-Davidson.
The construction of the lower mine infrastructure at Young-Davidson is in the final stages. The tie-in of the lower mine recently commenced and remains on schedule to be completed in June 2020. During this previously guided downtime of the Northgate shaft, ore will be trucked to surface from the upper mine at a rate of approximately 2,500 tpd. Given the lower production rate and a full workforce to support ongoing development during this period, total cash costs and mine-site AISC are expected to increase significantly in the first half of the year. Following completion of the tie-in, underground mining rates are anticipated to increase from approximately 6,500 tpd to a rate of 7,500 tpd by the end of 2020. This is expected to drive Young-Davidson production higher and costs significantly lower in the second half of 2020.
Capital spending at Young-Davidson in 2020 is expected to be between $75 and $85 million, down from 2019 levels. Capital spending is expected to be lower during the second half of 2020 with approximately 60% of the capital budget planned for the first half of the year to complete the lower mine expansion. Combined with higher production and lower costs, Young-Davidson is expected to generate strong free cash flow in the second half of 2020. Higher mining rates are expected to drive annual gold production to approximately 200,000 ounces at lower costs in 2021.
Gold production at Island Gold in 2020 is expected to be marginally lower than 2019, with higher throughput offset by lower grades. Mined grades are expected to be higher during the first half of 2020 and lower during the second half of the year reflecting mine sequencing. Total cash costs and mine-site all-in sustaining costs are expected to increase slightly from 2019.
Capital spending at Island Gold is expected to be between $50 and $60 million in 2020, excluding capitalized exploration. The Company is undertaking a number of projects to support the growing operation and mine life. This includes an expansion of the tailings facility and the construction of a new administration building, dry facility, and underground workshop.
The Company is currently conducting a Phase III expansion study at Island Gold beyond 1,200 tpd, which is expected to be completed during the second quarter of 2020. This study will incorporate the recently released 2019 year end Mineral Reserve and Resource update for Island Gold which included substantial growth in Mineral Reserves and Resources. The Company expects this study will demonstrate Island Gold as a larger, more profitable, long-life operation.
A total of $21 million has been budgeted in 2020 for surface and underground exploration at Island Gold to follow up on ongoing exploration success. The 2020 program will be focused on continuing to define new near mine Mineral Resources across the two-kilometre long Island Gold Main Zone which remains open laterally and down-plunge across multiple areas of focus.
Production from the Mulatos District in 2020 is expected to be consistent with long term guidance of 150,000 to 160,000 ounces of gold. Ore will be mined and stacked from multiple sources in 2020, including the Mulatos, El Victor and San Carlos open pits, as well as the newly constructed Cerro Pelon mine. In addition, the crushing and stacking of surface stockpiles will ramp up through the year as mining activities wind down in the San Carlos and El Victor pits in the first half of 2020.
Total cash costs are expected to increase slightly from 2019 reflecting the processing of lower recovery stockpiles, which carry non-cash historical inventory costs resulting in a higher reported cash cost per ounce. Mine-site all-in sustaining costs are also expected to increase due to higher sustaining capital, mainly related to waste stripping activities at Cerro Pelon.
Capital spending across the Mulatos District is expected to total $20 to $25 million, the majority of which is sustaining capital. The Company expects to make a construction decision on the La Yaqui Grande project during the second quarter of 2020. La Yaqui Grande is fully permitted having received the approval of the environmental impact assessment during the second quarter of 2019 and the Change in Land Use permit in July 2019.
Capital spending on the Company’s development projects and capitalized exploration at existing operations is expected to total $35 million in 2020. The majority of this spending will be focused on exploration at Island Gold and exploration, permitting and development activities at Lynn Lake.
With $183 million of cash and cash equivalents, no debt, and growing cash flow from its operations, the Company is well positioned to fund its internal growth initiatives, and expects to transition to strong free cash flow generation in the second half of 2020.
Fourth Quarter and Year End 2019 Results
Young-Davidson Financial and Operational Review
| Three Months Ended December 31, | Years Ended December 31, | |||||||||
| 2019 | 2018 | 2019 | 2018 | |||||||
| Gold production (ounces) | 48,000 | 50,900 | 188,000 | 180,000 | ||||||
| Gold sales (ounces) | 51,694 | 51,944 | 188,785 | 185,593 | ||||||
| Financial Review (in millions) | ||||||||||
| Operating Revenues | $75.9 | $64.4 | $262.1 | $236.3 | ||||||
| Cost of sales (1) | $59.4 | $61.5 | $231.1 | $235.0 | ||||||
| Earnings from operations | $16.5 | $2.9 | $31.0 | $1.3 | ||||||
| Cash provided by operating activities | $38.9 | $23.6 | $112.7 | $97.5 | ||||||
| Capital expenditures (sustaining) (2) | $16.4 | $10.8 | $46.2 | $35.8 | ||||||
| Capital expenditures (growth) (2) | $10.6 | $12.3 | $53.7 | $50.8 | ||||||
| Mine-site free cash flow (2) | $11.9 | $0.5 | $12.8 | $10.9 | ||||||
| Cost of sales, including amortization per ounce of gold sold (1) | $1,149 | $1,184 | $1,224 | $1,266 | ||||||
| Total cash costs per ounce of gold sold (2) | $766 | $764 | $800 | $822 | ||||||
| Mine-site all-in sustaining costs per ounce of gold sold (2),(3) | $1,083 | $974 | $1,047 | $1,017 | ||||||
| Underground Operations | ||||||||||
| Tonnes of ore mined | 644,010 | 588,956 | 2,452,623 | 2,280,399 | ||||||
| Tonnes of ore mined per day (“tpd”) | 7,000 | 6,402 | 6,720 | 6,248 | ||||||
| Average grade of gold (4) | 2.65 | 2.71 | 2.56 | 2.51 | ||||||
| Metres developed | 2,925 | 2,975 | 11,519 | 12,009 | ||||||
| Mill Operations | ||||||||||
| Tonnes of ore processed | 622,002 | 745,567 | 2,571,319 | 2,683,692 | ||||||
| Tonnes of ore processed per day | 6,761 | 8,104 | 7,045 | 7,353 | ||||||
| Average grade of gold (4) | 2.65 | 2.39 | 2.46 | 2.31 | ||||||
| Contained ounces milled | 53,043 | 57,192 | 203,452 | 190,701 | ||||||
| Average recovery rate | 92 | % | 92 | % | 91 | % | 92 | % |
(1) Cost of sales includes mining and processing costs, royalties and amortization.
(2) Refer to the “Non-GAAP Measures and Additional GAAP Measures” disclosure at the end of this press release and associated MD&A for a description and calculation of these measures.
(3) For the purposes of calculating mine-site all-in sustaining costs, the Company does not include an allocation of corporate and administrative and share based compensation expenses.
(4) Grams per tonne of gold (“g/t Au”).
Young-Davidson produced 48,000 ounces of gold in the fourth quarter of 2019, 6% below the same period of 2018 due to lower tonnes processed as a result of depleting low grade stockpiles in the third quarter of 2019. For the full year, Young-Davidson met the high end of guidance with production of 188,000 ounces.
Underground mining rates averaged 7,000 tpd in the fourth quarter, exceeding guidance and marking a 9% increase from the prior year. Mining rates exceeded full year guidance of 6,500 tpd in every quarter this year, with the fourth quarter being the highest quarter since 2017 and second highest quarterly mining rate ever. Mining rates averaged 6,720 tpd for the year, an 8% increase compared to 2018 due to improved operating performance from the mid-mine infrastructure. Underground grades mined in the fourth quarter of 2.65 g/t Au were consistent with annual guidance. For the full year, underground grades mined of 2.56 g/t Au were slightly below annual guidance, reflecting lower grades mined during the first half of the year.
Mill throughput of 6,761 tpd was lower than the prior year period as only underground ore was processed in the fourth quarter with low-grade surface stockpiles having been largely depleted. For the full year, mill throughput was relatively consistent with 2018, with more underground ore processed in 2019 offset by a reduction in the processing of surface stockpiles. Mill recoveries of 92% in the quarter and 91% for the year were in line with guidance and the prior year.
Lower Mine Construction and Tie-In
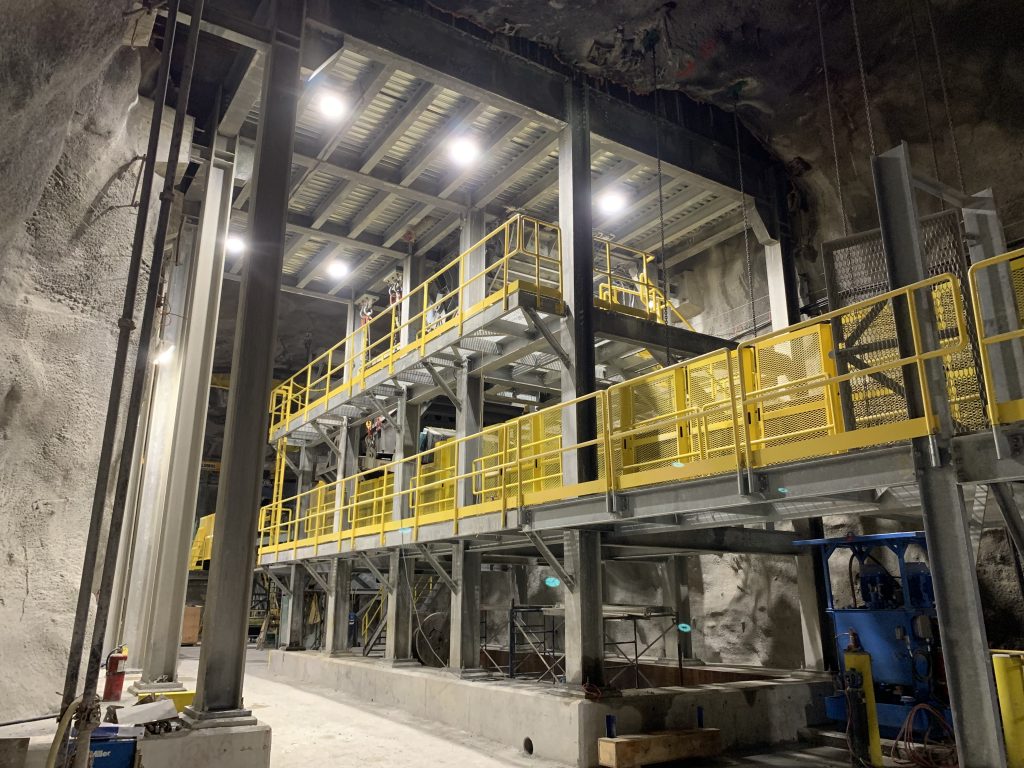
Substantial progress on the lower mine expansion was made in the fourth quarter of 2019, including completion of the ore passes from the upper mine (9590 level) feeding the lower mine coarse ore bin (9025 level) above the crusher. Installation of the grizzlies and rock breaker have commenced and are expected to be completed in the second quarter of 2020.
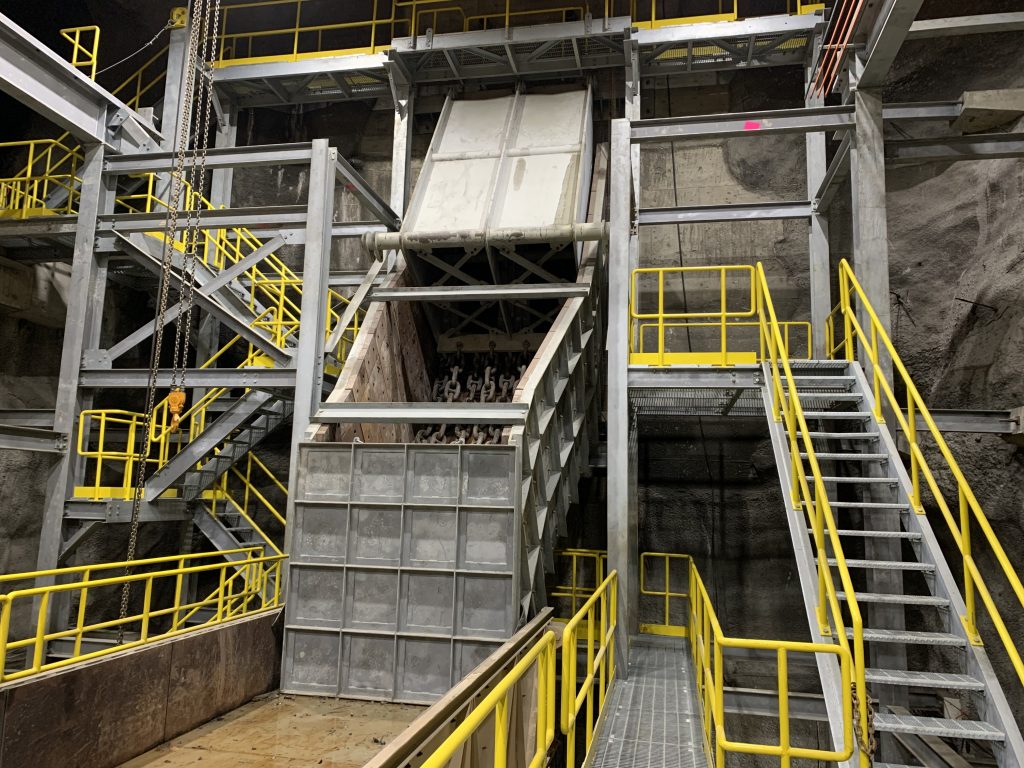
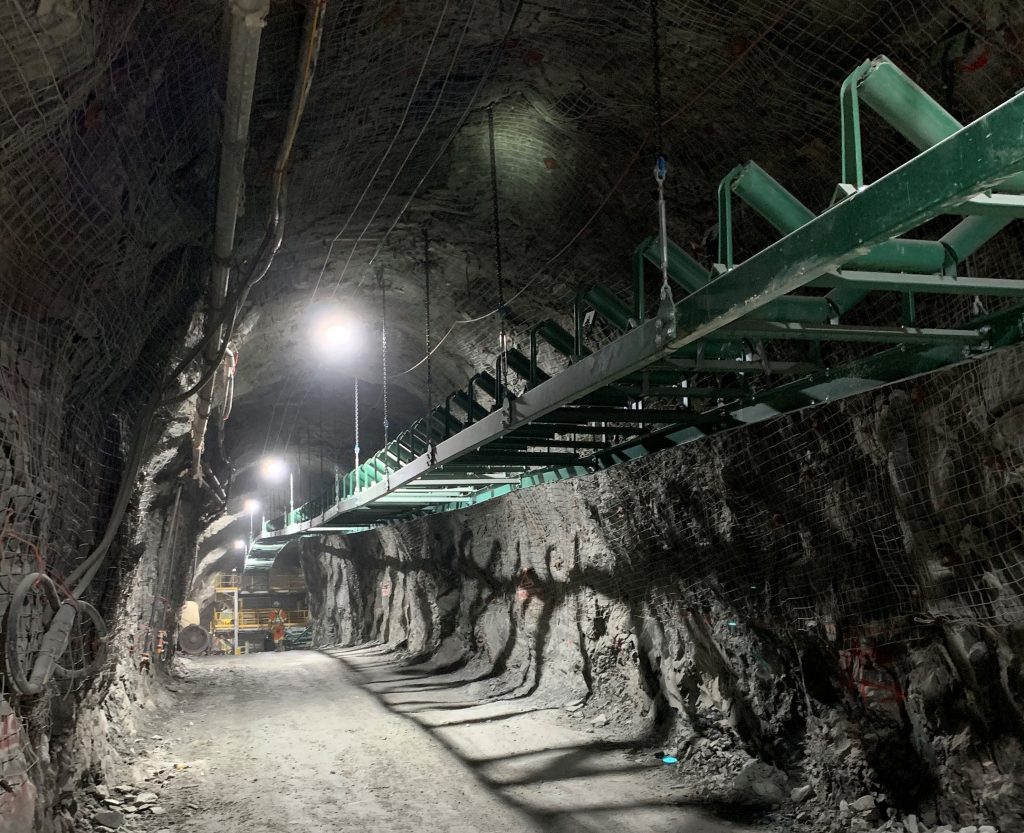
In addition, the three fine ore bins have been excavated with the two ore bins at the Northgate shaft now commissioned and the feeder from the ore bin on the 8930 level below the crusher currently being installed. Installation and commissioning of the crusher will be completed in February. The shaft bottom steel, ore and waste bins at the Northgate shaft, and the 8940 level loading pocket have been completed, with the shaft ready to be roped up following removal of the pentice. Installation of the hangers and trays for the main conveyor (CV21) from the crusher loadout level to the top of the shaft bins has progressed and is awaiting completion of the 8930 loadout.
The Northgate shaft was shutdown in mid-February 2020 and removal of the ropes has commenced. All supplies and equipment required to complete the tie-in are now on site. During the shutdown, the shaft steel at the mid-shaft location will be removed, the pentice will be excavated, and the new head, tail and guide ropes will be installed. Hoisting from the lower mine (8940 level) is expected to commence in June 2020.
A photo of the Lower mine loadout is available: https://www.globenewswire.com/NewsRoom/AttachmentNg/d3ae5d4f-d292-4d7a-8aee-4681a317b576
A photo of the Lower mine crusher installation is available: https://www.globenewswire.com/NewsRoom/AttachmentNg/632e761f-c1b3-4209-8757-a366f311d189
A photo of the Lower mine conveyor is available: https://www.globenewswire.com/NewsRoom/AttachmentNg/d19e3fa9-a67c-4dc2-b9ad-8b9b7359f863
Financial Review
Fourth quarter revenues of $75.9 million were 18% above the prior year quarter, reflecting higher realized gold prices. For the year ended December 31, 2019, revenues of $262.1 million were $25.8 million higher than the prior year, attributable to a 2% increase in ounces sold, as well as higher realized prices.
Cost of sales (which includes mining and processing costs, royalties, and amortization expense) of $59.4 million in the fourth quarter were consistent with the comparative quarter of 2018, as were underground mining costs of CAD$51 per tonne. Cost of sales for the year ended December 31, 2019 were $231.1 million, slightly lower than the prior year period due to lower mining costs per tonne and lower tonnes processed.
Total cash costs of $766 per ounce in the fourth quarter were consistent with the comparative period and in line with annual guidance. Total cash costs improved significantly in the fourth quarter compared to the first half of the year, as a result of higher grades mined, and lower mining and milling costs. For the year ended December 31, 2019, total cash costs of $800 per ounce were 3% lower than the prior year period, and slightly above guidance. Total cash costs are expected to be higher in the first half of 2020, due to lower production during the lower mine tie-in, decreasing significantly in the second half of the year.
Mine-site AISC of $1,083 per ounce in the fourth quarter were higher than the comparative quarter of 2019 and higher than annual guidance, reflecting the timing of sustaining capital expenditures. Mine-site AISC for the year were $1,047 per ounce, above guidance as a result of higher sustaining capital expenditures.
Capital expenditures were $27.0 million in the fourth quarter. This included $16.4 million of sustaining capital and $10.6 million of growth capital. Growth capital spending was focused on construction of the new TIA1 tailings facility and continued lower mine construction. For the full year, capital expenditures of $99.9 million were focused on lower mine construction, lateral development in the upper and lower mines, and construction of the new TIA1 tailings facility. Capital spending was above guidance due to additional grouting requirements and a change in scope of the new tailings facility from an upstream to a centreline design.
Young-Davidson generated $11.9 million of mine-site free cash flow in the fourth quarter, significantly higher than the same period of 2018 due to a higher gold price, and improved operating costs. For the full year, mine-site free cash flow was $12.8 million, generating a return after self financing the lower mine expansion. Since the acquisition of Young-Davidson in 2015, the mine has generated operating cash flow of $467.4 million and invested $420.0 million in capital expenditures, the majority of which has been focused on the lower mine expansion. With declining capital spending following the completion of the lower mine expansion in June 2020, and a corresponding increase in gold production and lower operating costs, Young-Davidson is expected to generate strong free cash flow starting in the second half of 2020.
Island Gold Financial and Operational Review
| Three Months Ended December 31, | Years Ended December 31, | |||||||
| 2019 | 2018 | 2019 | 2018 | |||||
| Gold production (ounces) | 38,600 | 29,000 | 150,400 | 105,800 | ||||
| Gold sales (ounces) | 39,652 | 30,199 | 149,746 | 105,520 | ||||
| Financial Review (in millions) | ||||||||
| Operating Revenues | $58.2 | $37.5 | $207.3 | $135.1 | ||||
| Cost of sales (1) | $36.4 | $28.7 | $129.4 | $106.5 | ||||
| Earnings from operations | $21.5 | $7.8 | $76.8 | $27.2 | ||||
| Cash provided by operating activities | $34.1 | $16.3 | $133.4 | $75.9 | ||||
| Capital expenditures (sustaining) (2) | $5.7 | $8.0 | $24.1 | $20.2 | ||||
| Capital expenditures (growth) (2) | $14.3 | $5.7 | $28.4 | $30.3 | ||||
| Capital expenditures (capitalized exploration) (2) | $4.7 | $3.1 | $16.4 | $15.6 | ||||
| Mine-site free cash flow (2) | $9.4 | ($0.5 | ) | $64.5 | $9.8 | |||
| Cost of sales, including amortization per ounce of gold sold (1) | $918 | $950 | $864 | $1,009 | ||||
| Total cash costs per ounce of gold sold (2) | $507 | $570 | $495 | $589 | ||||
| Mine-site all-in sustaining costs per ounce of gold sold (2),(3) | $653 | $834 | $656 | $781 | ||||
| Underground Operations | ||||||||
| Tonnes of ore mined | 102,652 | 102,692 | 380,266 | 344,336 | ||||
| Tonnes of ore mined per day (“tpd”) | 1,116 | 1,116 | 1,042 | 943 | ||||
| Average grade of gold (4) | 12.44 | 8.95 | 12.28 | 9.07 | ||||
| Metres developed | 1,831 | 1,560 | 6,031 | 6,477 | ||||
| Mill Operations | ||||||||
| Tonnes of ore processed | 93,912 | 105,432 | 401,276 | 369,767 | ||||
| Tonnes of ore processed per day | 1,021 | 1,146 | 1,099 | 1,013 | ||||
| Average grade of gold (4) | 13.03 | 9.02 | 11.85 | 9.20 | ||||
| Contained ounces milled | 39,345 | 30,585 | 152,905 | 109,383 | ||||
| Average recovery rate | 97 | % | 96 | % | 97 | % | 96 | % |
(1) Cost of sales includes mining and processing costs, royalties and amortization.
(2) Refer to the “Non-GAAP Measures and Additional GAAP Measures” disclosure at the end of this press release and associated MD&A for a description and calculation of these measures.
(3) For the purposes of calculating mine-site all-in sustaining costs, the Company does not include an allocation of corporate and administrative and share based compensation expenses.
(4) Grams per tonne of gold (“g/t Au”).
Island Gold produced 38,600 ounces in the fourth quarter, marking a 33% increase from the fourth quarter of 2018 driven by higher grades mined and milled. For the full year, Island Gold produced a record 150,400 ounces, 4% above the high end of guidance, and 42% higher than 2018 reflecting higher grades mined and milled. The operation generated mine-site free cash flow of $9.4 million in the fourth quarter, bringing the 2019 total to a record $64.5 million.
Underground mining rates were 1,116 tpd in the fourth quarter, consistent with the prior year period. For the full year, underground mining rates increased 10% to average 1,042 tpd. Underground grades mined averaged 12.44 g/t Au in the fourth quarter, higher than annual guidance and 39% higher than the fourth quarter of 2018 due to mine sequencing. Full year grades mined of 12.28 g/t Au were above guided levels due to a combination of positive grade reconciliation and mine sequencing.
Mill throughput of 1,021 tpd in the fourth quarter was down from the prior year period; however, throughput of 1,099 tpd for the full year was in line with annual guidance. Mill recoveries were 97% in the fourth quarter, in line with the prior year quarter and guidance.
Financial Review
Island Gold generated record revenues of $58.2 million in the fourth quarter, an increase of 55% compared to the prior year period, reflecting significantly more ounces sold and a higher realized gold price. For the full year, revenues of $207.3 million were also a record and $72.2 million, or 53% higher than the prior year, primarily attributable to more ounces sold.
Cost of sales (includes mining and processing costs, royalties, and amortization expense) of $36.4 million in the fourth quarter were 27% higher than the comparative period, reflecting more ounces sold and higher unit mining costs. However, on a per ounce basis, cost of sales decreased 3%, driven by higher grades mined and lower amortization charges. Cost of sales for the full year of $129.4 million increased 22% from the prior year period due to higher mining and processing rates.
Total cash costs were $507 per ounce in the fourth quarter, an 11% improvement from the comparative quarter, driven by higher grades mined partially offset by higher mining costs. Unit mining costs were CAD$165 per tonne in the quarter due to higher contractor and maintenance costs. For the full year, total cash costs of $495 per ounce were 16% lower than the prior year due to higher grades mined, and in line with annual guidance.
Mine-site AISC of $653 per ounce in the fourth quarter were below the full year guidance range of $730 to $770 per ounce, reflecting lower sustaining capital spending. Mine-site AISC for the full year of $656 per ounce were 16% lower than the prior year and below guidance due to the deferral of certain sustaining capital spending to 2020.
Total capital expenditures were $24.7 million in the fourth quarter, with spending focused on lateral development, tailings construction, mining equipment, and capitalized exploration. This included $5.7 million of sustaining capital and $19.0 million of growth capital (inclusive of $4.7 million of capitalized exploration). For the full year, total capital expenditures, including capitalized exploration, were $68.9 million, consistent with the prior year.
Island Gold generated mine-site free cash flow of $9.4 million during the fourth quarter driven by strong gold production and operating margins. For the full year, Island Gold generated a record $64.5 million of mine-site free cash flow, net of all investment in capital and exploration. Since the acquisition of Island Gold in November 2017, the mine has generated $81 million of free cash flow, while funding an expansion of the operation from 900 tpd to 1,200 tpd, and more than doubling Mineral Reserves and Resources.
Mulatos Financial and Operational Review
| Three Months Ended December 31, | Years Ended December 31, | ||||||||
| 2019 | 2018 | 2019 | 2018 | ||||||
| Gold production (ounces) | 34,100 | 35,600 | 142,000 | 175,500 | |||||
| Gold sales (ounces) | 34,127 | 38,819 | 141,496 | 175,104 | |||||
| Financial Review (in millions) | |||||||||
| Operating Revenues | $49.7 | $48.1 | $194.4 | $223.3 | |||||
| Cost of sales (1) | $35.8 | $38.4 | $138.9 | $173.1 | |||||
| Earnings from operations | $13.0 | $8.8 | $51.9 | $42.7 | |||||
| Cash provided by operating activities | $10.5 | $14.7 | $41.5 | $71.0 | |||||
| Capital expenditures (sustaining) (2) | $1.2 | $2.5 | $6.5 | $7.2 | |||||
| Capital expenditures (growth) (2) | $7.0 | $8.7 | $46.4 | $25.2 | |||||
| Capital expenditures (capitalized exploration) (2) | $1.3 | $0.6 | $1.3 | $2.9 | |||||
| Mine-site free cash flow (2) | $1.0 | $2.9 | ($12.7 | ) | $35.7 | ||||
| Cost of sales, including amortization per ounce of gold sold (1) | $1,049 | $989 | $982 | $989 | |||||
| Total cash costs per ounce of gold sold (2) | $820 | $793 | $784 | $786 | |||||
| Mine site all-in sustaining costs per ounce of gold sold (2),(3) | $891 | $881 | $868 | $855 | |||||
| Open Pit & Underground Operations | |||||||||
| Tonnes of ore mined – open pit (4) | 1,558,458 | 2,118,300 | 7,166,679 | 8,479,211 | |||||
| Total waste mined – open pit (6) | 2,058,732 | 2,151,749 | 7,095,650 | 8,788,488 | |||||
| Total tonnes mined – open pit | 3,617,190 | 4,270,049 | 14,262,329 | 17,267,699 | |||||
| Waste-to-ore ratio (operating) | 0.98 | 0.51 | 0.73 | 0.71 | |||||
| Tonnes of ore mined – underground | — | — | — | 48,772 | |||||
| Crushing and Heap Leach Operations | |||||||||
| Tonnes of ore stacked | 1,823,418 | 1,776,719 | 7,289,811 | 6,795,175 | |||||
| Average grade of gold processed (5) | 0.99 | 0.92 | 0.94 | 0.90 | |||||
| Contained ounces stacked | 58,205 | 52,296 | 219,655 | 195,606 | |||||
| Mill Operations | |||||||||
| Tonnes of high-grade ore milled | — | — | — | 91,680 | |||||
| Average grade of gold processed (5) | — | — | — | 6.70 | |||||
| Contained ounces milled | — | — | — | 19,744 | |||||
| Total contained ounces stacked and milled | 58,205 | 52,296 | 219,655 | 215,350 | |||||
| Average recovery rate | 59 | % | 68 | % | 65 | % | 81 | % | |
| Ore crushed per day (tonnes) – combined | 19,800 | 19,300 | 20,000 | 18,900 |
(1) Cost of sales includes mining and processing costs, royalties and amortization.
(2) Refer to the “Non-GAAP Measures and Additional GAAP Measures” disclosure at the end of this MD&A for a description and calculation of these measures.
(3) For the purposes of calculating mine-site all-in sustaining costs, the Company does not include an allocation of corporate and administrative and share based compensation expenses.
(4) Includes ore stockpiled during the quarter.
(5) Grams per tonne of gold (“g/t Au”).
(6) Total waste mined includes operating waste and capitalized stripping.
Mulatos produced 34,100 ounces in the fourth quarter of 2019, including initial production from Cerro Pelon which commenced stacking ore in the quarter ahead of schedule. For the year, Mulatos produced 142,000 ounces, down 19% from 2018 due to lower recoveries, as well as the completion of mining from the San Carlos underground deposit in 2018 and La Yaqui Phase I deposit in the third quarter of 2019.
The Company is currently mining from the Mulatos, Victor, San Carlos, and Cerro Pelon open pits. Mining and stacking rates were impacted by abnormally high rainfall in September over a short period of time which temporarily restricted mining activities in the main Mulatos pit early in the quarter, as well as the wind-down of mining activities at La Yaqui Phase I, partially offset by the start up of mining at Cerro Pelon.
Total crusher throughput averaged 19,800 tpd for a total of 1,823,418 tonnes stacked in the fourth quarter at a grade of 0.99 g/t Au. Grades stacked for the full year were in line with guidance at 0.94 g/t Au, including mining from La Yaqui Phase I and Cerro Pelon. The recovery rate of 59% in the fourth quarter was mainly impacted by the timing of stacking higher grade ore from Cerro Pelon later in the quarter, with those ounces expected to be recovered in 2020. For the full year, the recovery rate of 65% was slightly below guidance due to stacking of higher grade, lower recovery SAS ore during the year.
Financial Review
Fourth quarter revenues of $49.7 million were in line with the prior year quarter. For the full year of 2019, revenues of $194.4 million were $28.9 million lower than the prior year, primarily due to less ounces sold.
Cost of sales (includes mining and processing costs, royalties, and amortization expense) were $35.8 million in the fourth quarter, lower than the prior year period due to a lower number of tonnes mined and lower ounces sold. On a per ounce basis, cost of sales were slightly higher in the fourth quarter of 2019 driven by higher mining costs and a higher waste to ore ratio. Cost of sales for the full year were $138.9 million, 20% lower due to fewer tonnes mined and the completion of underground mining operations at San Carlos in the prior year.
Total cash costs of $820 per ounce in the fourth quarter were higher than the prior year quarter, due to a higher waste-to-ore ratio, partially offset by higher grades processed. For the full year, total cash costs of $784 per ounce were consistent with the prior year period, and below annual guidance, as the Company benefited from higher grades and the sale of concentrate ounces early in the year that had not been budgeted.
Mine-site AISC of $891 per ounce in the fourth quarter were higher than the prior year quarter as a result of higher total cash costs. Mine-site AISC of $868 per ounce for the full year were in line with the prior year and the low end of guidance.
Capital spending in the fourth quarter was focused on completion of construction at Cerro Pelon, including stripping of the open pit and commissioning of the crusher. Total capital spending for the quarter was $9.5 million, of which $1.2 million was sustaining capital. For the full year, capital expenditures of $54.2 million were $18.9 million higher than the prior year reflecting $21.8 million spent in 2019 to construct the Cerro Pelon mine.
Mulatos generated mine-site free cash-flow of $1.0 million in the fourth quarter as capital spending decreased with the completion of Cerro Pelon development in October. For the full year, mine-site free-cash flow was negative $12.7 million reflecting the construction costs of Cerro Pelon. With the construction of Cerro Pelon now complete, Mulatos is expected to generate strong free cash flow growth in 2020.
El Chanate Financial and Operational Review
| | Three Months Ended December 31, | Years Ended December 31, | |||||||
| 2019 | 2018 | 2019 | 2018 | ||||||
| Gold production (ounces) | 1,400 | 10,100 | 14,100 | 43,700 | |||||
| Gold sales (ounces) | 1,675 | 10,199 | 14,675 | 43,662 | |||||
| Financial Review (in millions) | |||||||||
| Operating Revenues | $2.2 | $13.1 | $19.3 | $57.1 | |||||
| Cost of sales (1) | $4.4 | $78.5 | $22.0 | $124.8 | |||||
| Loss from operations | ($2.2 | ) | ($65.4 | ) | ($2.7 | ) | ($67.7 | ) | |
| Cash (used in) provided by operating activities | ($4.1 | ) | $2.4 | ($2.9 | ) | $0.6 | |||
| Capital expenditures | $— | $0.1 | $— | $0.6 | |||||
| Mine-site free cash flow (2) | ($4.1 | ) | $2.3 | ($2.9 | ) | $— | |||
| Cost of sales, including amortization per ounce of gold sold (1) | $2,627 | $7,697 | $1,499 | $2,858 | |||||
| Total cash costs per ounce of gold sold (2) | $2,448 | $1,304 | $1,390 | $1,289 | |||||
| Mine site all-in sustaining costs per ounce of gold sold (2),(3) | $2,448 | $1,333 | $1,411 | $1,317 |
(1) Cost of sales includes mining and processing costs, royalties and amortization.
(2) Refer to the “Non-GAAP Measures and Additional GAAP Measures” disclosure at the end of this press release and associated MD&A for a description and calculation of these measures.
(3) For the purposes of calculating mine-site all-in sustaining costs, the Company does not include an allocation of corporate and administrative and share based compensation expenses.
El Chanate produced 1,400 ounces of gold in the fourth quarter, and 14,100 ounces for the full year. The operation concluded residual leaching in October 2019, and has now transitioned to reclamation activities with rinsing of the leach pad in the fourth quarter.
Financial Review
Fourth quarter revenues of $2.2 million were lower than the prior year quarter due to fewer ounces sold, as mining activities and ore stacking ceased in 2018. Total cash costs and mine-site AISC were both $2,448 per ounce in the fourth quarter, increasing from the prior year period due to higher fixed costs.
El Chanate generated negative mine-site free cash flow of $4.1 million in the quarter and $2.9 million for the full year. Margins generated from residual leaching throughout the year funded reclamation spend of approximately $2.0 million in the year.
Fourth Quarter 2019 Development Activities
Kirazlı (Çanakkale, Turkey)
On October, 14, 2019, the Company suspended all construction activities on its Kirazlı project pending the renewal of its Turkish mining concessions which expired on October 13, 2019. Although the mining concessions have not been revoked and can be renewed following this expiration date, no further construction activities can be completed until the concessions have been renewed.
There has been false information about the project circulated through social media, which resulted in project opposition and related protests. The Company continues to share correct information about the project and dispel this misinformation.
The Company has met all the regulatory requirements and conditions for the concessions to be renewed and reasonably expected the renewal by the expiration date. The communities local to the Kirazlı project remain supportive. As such, the Company is working with the Turkish Department of Energy and Natural Resources on securing the renewal of the mining concessions which will allow for a resumption of construction activities. The renewal is required from the same government department that granted the Operating Permit for Kirazlı in March 2019.
The Company will provide updated guidance on the construction schedule and budget for Kirazlı following the receipt of the concession renewal and resumption of construction activities.
During the fourth quarter of 2019, the Company spent $8.2 million at Kirazlı, including completing construction of the reservoir and annual forestry fee, bringing year-to-date spending to $28.1 million.
Mulatos District (Sonora, Mexico)
Cerro Pelon
During the fourth quarter, the Company completed construction of the Cerro Pelon mine, including commissioning of the crushing circuit and conveyor. The Company commenced stacking ore from Cerro Pelon in the fourth quarter and declared commercial production. Cerro Pelon is expected to be a significant contributor to production at Mulatos in 2020.
The Company spent $4.0 million at Cerro Pelon in the fourth quarter, bringing total construction costs to $25.2 million (of which $21.8 million was spent in 2019). Spending in the fourth quarter was focused on installation and testing of the crushing and conveying system, and final pre-stripping of the open pit.
La Yaqui Grande
The Company received approval of the environmental impact assessment (“MIA”) for La Yaqui Grande during the second quarter of 2019 and the Change in Land Use permit in the third quarter of 2019. The Company is currently finalizing project design and plans to finalize the project economics and announce a construction decision in the second quarter of 2020.
During the fourth quarter, the Company spent $0.7 million, bringing 2019 spending to $4.9 million, focused on detailed engineering and project design.
Lynn Lake (Manitoba, Canada)
The Company released a positive Feasibility Study on the Lynn Lake project in December 2017 outlining average annual production of 143,000 ounces over a 10 year mine life at average mine-site all-in sustaining costs of $745 per ounce.
The project economics detailed in the 2017 Feasibility Study outlined a 12.5% IRR at a $1,250 per ounce gold price (21.5% IRR and NPV of $290 million at a $1,500 per ounce gold price). Since the release of the 2017 Feasibility Study, the Company has undertaken several initiatives designed to improve the project economics. These include a detailed review of construction capital, the evaluation of various production scenarios and the inclusion of the results of more detailed engineering.
Development spending (excluding exploration) in the fourth quarter of 2019 of $0.9 million and $3.4 million for the year related to project optimization activities, as well as supporting drafting of the Environmental Impact Study (“EIS”) for the project that will be submitted to satisfy Federal and Provincial environmental assessment requirements . The EIS is expected to be submitted in the second quarter of 2020. The permitting process is expected to take approximately two years followed by two years of construction.
Fourth Quarter 2019 Exploration Activities
Island Gold (Ontario, Canada)
The 2019 exploration drilling program was focused on further expanding the down-plunge and lateral extensions of the Island Gold deposit with the objective of adding new near mine Mineral Resources across the two-kilometre long Island Gold Main Zone. The program was successful in extending high grade gold mineralization across all three areas of focus, most notably in the Main and Eastern Extensions. This resulted in 21% increase in Mineral Reserves to 1.2 million ounces (3.6 mt grading 10.37 g/t Au), net of mining depletion, and a 46% increase in Inferred Mineral Resources to 2.3 million ounces (5.4 mt grading 13.26 g/t Au) as outlined in the 2019 Mineral Reserve and Resource statement issued on February 18, 2020.
A total of 47,608 m of surface directional drilling, 24,462 m of underground exploration drilling, and 993 m of underground exploration drift development was completed in 2019. The Company issued four press releases during the year highlighting the results from the exploration program in 2019.
Surface exploration drilling
A total of 17 holes (13,682 m) were completed in the fourth quarter as part of the directional exploration drilling program. Directional drilling targeted areas peripheral to the Inferred Mineral Resource blocks below the 1,000 m level, with drill hole spacing ranging from 75 m to 100 m. The area that was targeted by the surface directional drill program extends approximately 2,000 m in strike length between the 1,000 m and 1,500 m elevation below surface.
Underground exploration drilling
During the fourth quarter of 2019, a total of 2,689 m of underground exploration drilling was completed in 11 holes from the 190, 340, 620 and 840 levels. The objective of the underground drilling is to identify new Mineral Resources close to existing Mineral Resource or Reserve blocks. A total of 267 m of underground exploration drift development was completed on the 620 and 840 levels during the fourth quarter of 2019.
As outlined in a press release issued on January 15, 2020, highlights from drilling in the fourth quarter included the following:
Main Extension Down-Plunge – fourth quarter previously released highlights included:
- 121.32 g/t Au (96.47 g/t cut) over 3.81 m (MH20-01);
- 108.17 g/t Au (94.56 g/t cut) over 2.57 m (MH17-11); and
- 36.45 g/t Au (13.23 g/t cut) over 8.04 m (MH17-12)
Eastern Extension – fourth quarter previously released highlights included:
- 32.19 g/t Au (25.48 g/t cut) over 4.68 m (620-610-01); and
- 20.18 g/t Au (20.18 g/t cut) over 3.24 m (620-610-07)
Gap between Main and Eastern Extensions – fourth quarter previously released highlights include:
- 21.28 g/t Au (21.28 g/t cut) over 9.01 m (MH18-09); and
- 28.50 g/t Au (23.13 g/t cut) over 4.38 m (MH18-10)
Total exploration expenditures during the fourth quarter were $5.0 million, of which $4.7 million was capitalized. For the full year, $17.4 million was spent, of which $16.4 million was capitalized.
Mulatos District (Sonora, Mexico)
The Company has a large exploration package covering 28,972 hectares with the majority of past exploration efforts focused around the Mulatos mine. Over the last three years, exploration has moved beyond the main Mulatos pit area and is focused on earlier stage prospects throughout the wider district.
In the fourth quarter, the Company invested $0.9 million in exploration activities within the Mulatos District, and $5.0 million for the full year, of which $1.3 million was capitalized. Spending in the quarter primarily related to drilling on early stage projects, ground geophysical surveys, and administrative costs.
Lynn Lake (Manitoba, Canada)
In the fourth quarter of 2019, 1,553 m of drilling was completed in 6 holes focused on testing exploration targets in proximity to the Gordon Deposit. Interpretation of data collected during the 2019 field program continued through the fourth quarter with the focus on developing a pipeline of prospective regional exploration targets for further evaluation in 2020. Spending in the fourth quarter totaled $0.6 million, bringing the full year spend to $4.3 million.
Review of Fourth Quarter Financial Results
During the fourth quarter of 2019, the Company sold 127,148 ounces of gold for record quarterly revenue of $186.0 million, a 14% increase from the prior year period due to an increase in realized gold prices. The average realized gold price in the quarter was $1,463 per ounce compared to $1,244 per ounce in the prior year period.
Cost of sales were $136.0 million in the fourth quarter of 2019, a 34% decrease compared to the prior year period, primarily due to the prior year including a $64.0 million non-cash inventory impairment charge at El Chanate.
Mining and processing costs were $87.4 million compared to $96.2 million in the prior year period. This decline was attributable to lower operating costs at Island Gold and Young-Davidson, and the completion of mining activities at El Chanate in the fourth quarter of 2018.
Consolidated total cash costs for the quarter were $722 per ounce compared to $770 per ounce in the prior year period, a 6% decrease driven by low cost production growth at Island Gold.
AISC were $972 per ounce in the quarter, $11 per ounce lower than the prior year period driven by lower total cash costs, partially offset by higher sustaining capital spending.
Royalty expense was $4.4 million in the quarter, lower than the prior year period of $4.8 million, as the 5% Mulatos royalty commitment ceased in the first quarter of 2019, partially offset by a higher number of ounces sold at Island Gold and higher realized gold prices.
Amortization of $44.2 million in the quarter was consistent with the prior year period expense of $42.1 million. Amortization of $348 per ounce was in line with guidance.
The Company recognized earnings from operations of $41.6 million in the quarter, higher than the prior year period due to higher realized gold prices combined with lower mining and processing expense, driving stronger margins. Further, the prior year period included a $64.0 million non-cash inventory impairment charge at El Chanate which impacted earnings in 2018.
The Company reported net earnings of $38.0 million in the quarter, compared to net loss of $71.5 million in the same period of 2018. The increase in earnings is due to stronger operating margins, the benefit of foreign exchange gains recorded within deferred taxes, as well as the prior year period impacted by the non-cash inventory impairment charge at El Chanate. On an adjusted basis, earnings of $32.1 million or $0.08 per share increased compared to the prior year driven by higher realized gold prices and improved costs. Adjusted earnings reflect adjustments for one-time gains and losses, as well as foreign exchange movements related to the Canadian dollar and Mexican Peso, which generated a foreign exchange gain of $8.6 million in the fourth quarter of 2019 recorded within both foreign exchange and deferred income taxes.
Review of 2019 Financial Results
For the full year of 2019, the Company sold 494,702 ounces of gold for record revenue of $683.1 million, a 5% increase compared to 2018. This was primarily driven by higher realized gold prices and record production at Island gold, partially offset by less ounces sold at Mulatos and El Chanate which transitioned to residual leaching at the end of 2018. Revenue benefited from a higher realized gold price of $1,381 per ounce compared to $1,278 per ounce in 2018, a $52.5 million impact.
Cost of sales were $521.4 million in 2019 compared to $639.4 million in 2018, as the prior year included a $64.0 million non-cash inventory impairment charge at El Chanate. Cost of sales was also driven lower by lower mining and processing costs, royalties and amortization charges.
Mining and processing costs decreased to $339.0 million in 2019 from $387.2 million in the prior year, primarily due to lower operating costs at Young-Davidson and Mulatos which drove down total cash costs. In addition, mining and processing costs decreased significantly at El Chanate as mining activities ceased in the fourth quarter of 2018.
Consolidated total cash costs per ounce decreased 10% in 2019 to $720 per ounce compared to $802 per ounce in the prior year. The decline in total cash costs was driven by low cost production growth at Island Gold, and lower operating costs and higher grades mined at both Young-Davidson and Mulatos.
AISC decreased to $951 per ounce in 2019 from $989 per ounce in the prior year. The decrease was primarily driven by the reduction in total cash costs, partially offset by higher sustaining capital spending at Young-Davidson.
Royalty expense was $17.4 million in 2019, a 19% decrease compared to $21.6 million in 2018, primarily due to a lower royalty obligation at Mulatos with the completion of the third-party royalty commitment in the first quarter of 2019.
Amortization of $165.0 million in 2019 was lower than the prior year due to fewer ounces sold. On a per ounce basis, amortization was $334 per ounce, in line with guidance and slightly higher than the prior year due to a higher proportion of sales coming from Island Gold and Young-Davidson, which include higher amortization charges.
The Company recognized earnings from operations of $126.0 million in 2019, compared to loss of $22.6 million in 2018. The substantial increase in earnings from operations was driven by higher gold prices, and increased production from Island Gold which generates stronger margins. Further, the prior year included a $64.0 million non-cash inventory impairment charge at El Chanate.
The Company reported net earnings of $96.1 million in 2019 compared to a net loss of $72.6 million in 2018, driven by improved margins, and the 2018 inventory impairment charge at El Chanate. On an adjusted basis, earnings of $83.5 million or $0.21 per share for the year were 326% higher than in the prior year. Adjusted net earnings reflect adjustments for other gains, as well as foreign exchange movements related to the Canadian dollar and Mexican Peso, which generated a foreign exchange gain of $13.5 million in 2019 recorded within both foreign exchange gain and deferred income taxes.
Associated Documents
This press release should be read in conjunction with the Company’s interim consolidated financial statements for the year ended December 31, 2019 and associated Management’s Discussion and Analysis (“MD&A”), which are available from the Company’s website, www.alamosgold.com, in the “Investors” section under “Reports and Financials”, and on SEDAR (www.sedar.com) and EDGAR (www.sec.gov).
Reminder of Fourth Quarter and Year-End 2019 Results Conference Call
The Company’s senior management will host a conference call on Thursday, February 20, 2020 at 11:00 am ET to discuss the fourth quarter and year-end 2019 results.
Participants may join the conference call by dialling (416) 340-2216 or (800) 273-9672 for calls within Canada and the United States, or via webcast at www.alamosgold.com.
A playback will be available until March 23, 2020 by dialling (905) 694-9451 or (800) 408-3053 within Canada and the United States. The pass code is 1735825#. The webcast will be archived at www.alamosgold.com.
Qualified Persons
Chris Bostwick, FAusIMM, Alamos’ Vice President, Technical Services, who is a qualified person within the meaning of National Instrument 43-101 (“Qualified Person”), has reviewed and approved the scientific and technical information contained in this press release.
About Alamos
Alamos is a Canadian-based intermediate gold producer with diversified production from three operating mines in North America. This includes the Young-Davidson and Island Gold mines in northern Ontario, Canada and the Mulatos mine in Sonora State, Mexico. Additionally, the Company has a significant portfolio of development stage projects in Canada, Mexico, Turkey, and the United States. Alamos employs more than 1,700 people and is committed to the highest standards of sustainable development. The Company’s shares are traded on the TSX and NYSE under the symbol “AGI”.
FOR FURTHER INFORMATION, PLEASE CONTACT:
| Scott K. Parsons | |
| Vice-President, Investor Relations | |
| (416) 368-9932 x 5439 |
All amounts are in United States dollars, unless otherwise stated.
The TSX and NYSE have not reviewed and do not accept responsibility for the adequacy or accuracy of this release.
Cautionary Note
This press release contains statements which are, or may be deemed to be, forward-looking information as defined under applicable Canadian and U.S. securities laws (“forward-looking statement(s)”). All statements in this press release, other than statements of historical fact, which address events, results, outcomes or developments that the Company expects to occur are, or may be deemed to be forward-looking statements. Forward-looking statements are generally, but not always, identified by the use of forward-looking terminology such as “expect”, “believe”, “anticipate”, “intend”, “estimate”, “forecast”, “budget”, “contemplates”, “continues”, “plan” or variations of such words and phrases and similar expressions or statements that certain actions, events or results “may”, “could”, “would”, “might” or “will” be taken, occur or be achieved.
Forward-looking statements include information as to strategy, plans or future financial or operating performance, such as the Company’s expansion plans, project timelines, production plans and expected sustainable productivity increases, expected increases in mining activities and corresponding cost efficiencies, expected drilling targets, expected sustaining costs, expected improvements in cash flows and margins, expectations of changes in capital expenditures, forecasted cash shortfalls and the Company’s ability to fund them, cost estimates, projected exploration results, reserve and resource estimates, expected production rates and use of the stockpile inventory, expected recoveries, sufficiency of working capital for future commitments and other statements that express management’s expectations or estimates of future performance.
Alamos cautions that forward-looking statements are necessarily based upon several factors and assumptions that, while considered reasonable by the Company at the time of making such statements, are inherently subject to significant business, economic, legal, political and competitive uncertainties and contingencies. Known and unknown factors could cause actual results to differ materially from those projected in the forward-looking statements.
Such factors and assumptions underlying the forward-looking statements in this press release include, but are not limited to: changes to current estimates of mineral reserves and resources; changes to production estimates (which assume accuracy of projected ore grade, mining rates, recovery timing and recovery rate estimates and may be impacted by unscheduled maintenance, labour and contractor availability and other operating or technical difficulties); fluctuations in the price of gold; changes in foreign exchange rates (particularly the Canadian dollar, Mexican peso, Turkish Lira and U.S. dollar); the impact of inflation; employee and community relations; litigation and administrative proceedings; disruptions affecting operations; availability of and increased costs associated with mining inputs and labour; development delays at the Kirazlı project or Young-Davidson mine; inherent risks associated with mining and mineral processing; the risk that the Company’s mines may not perform as planned; uncertainty with the Company’s ability to secure additional capital to execute its business plans; the speculative nature of mineral exploration and development, including the risks of obtaining and maintaining necessary licenses, permits and authorizations for the Company’s development and operating assets; contests over title to properties; expropriation or nationalization of property; inherent risks and hazards associated with mining including environmental hazards, industrial accidents, unusual or unexpected formations, pressures and cave-ins; changes in national and local government legislation (including tax legislation), controls or regulations in Canada, Mexico, Turkey, the United States and other jurisdictions in which the Company does or may carry on business in the future; risk of loss due to sabotage and civil disturbances; the impact of global liquidity and credit availability and the values of assets and liabilities based on projected future cash flows; risks arising from holding derivative instruments; and business opportunities that may be pursued by the Company.
Additional risk factors and details with respect to risk factors affecting the Company are set out in the Company’s latest Annual Information Form and MD&A, each under the heading “Risk Factors”, available on the SEDAR website at www.sedar.com or on EDGAR at www.sec.gov. The foregoing should be reviewed in conjunction with the information found in this press release.
The Company disclaims any intention or obligation to update or revise any forward-looking statements whether as a result of new information, future events or otherwise, except as required by applicable law.
Cautionary Note to U.S. Investors Concerning Measured, Indicated and Inferred Resources
The Company is required to prepare its resource estimates in accordance with standards of the Canadian Institute of Mining, Metallurgy and Petroleum referred to in Canadian National Instrument 43-101. These standards are materially different from the standards generally permitted in reports filed with the United States Securities and Exchange Commission. When describing resources we use the terms “measured”, “indicated” or “inferred” resources which are not recognized by the United States Securities and Exchange Commission. The estimation of measured resources and indicated resources involve greater uncertainty as to their existence and economic feasibility than the estimation of proven and probable reserves. U.S. investors are cautioned not to assume that any part of measured or indicated resources will ever be converted into economically or legally mineable proven or probable reserves. The estimation of inferred resources may not form the basis of a feasibility or other economic studies and involves far greater uncertainty as to their existence and economic viability than the estimation of other categories of resources.
Non-GAAP Measures and Additional GAAP Measures
The Company has included certain non-GAAP financial measures to supplement its Consolidated Financial Statements, which are presented in accordance with IFRS, including the following:
- adjusted net earnings and adjusted earnings per share;
- cash flow from operating activities before changes in working capital and taxes received;
- Company-wide free cash flow;
- total mine-site free cash flow;
- mine-site free cash flow;
- total cash cost per ounce of gold sold;
- all-in sustaining cost (“AISC”) per ounce of gold sold;
- mine-site all-in sustaining cost (“Mine-site AISC”) per ounce of gold sold;
- sustaining and non-sustaining capital expenditures; and
- earnings before interest, taxes, depreciation, and amortization
The Company believes that these measures, together with measures determined in accordance with IFRS, provide investors with an improved ability to evaluate the underlying performance of the Company. Non-GAAP financial measures do not have any standardized meaning prescribed under IFRS, and therefore they may not be comparable to similar measures employed by other companies. The data is intended to provide additional information and should not be considered in isolation or as a substitute for measures of performance prepared in accordance with IFRS. Management’s determination of the components of non-GAAP and additional measures are evaluated on a periodic basis influenced by new items and transactions, a review of investor uses and new regulations as applicable. Any changes in to the measures are dully noted and retrospectively applied as applicable.
Adjusted Net Earnings and Adjusted Earnings per Share
“Adjusted net earnings” and “adjusted earnings per share” are non-GAAP financial measures with no standard meaning under IFRS which exclude the following from net earnings:
- Foreign exchange gain (loss)
- Items included in other gain (loss)
- Certain non-reoccurring items
- Foreign exchange gain (loss) recorded in deferred tax expense
Net earnings have been adjusted, including the associated tax impact, for the group of costs in “Other loss” on the consolidated statement of comprehensive income. Transactions within this grouping are: the fair value changes on non-hedged derivatives; the renunciation of flow-through exploration expenditures; and loss on disposal of assets. The adjusted entries are also impacted for tax to the extent that the underlying entries are impacted for tax in the unadjusted net earnings.
The Company uses adjusted net earnings for its own internal purposes. Management’s internal budgets and forecasts and public guidance do not reflect the items which have been excluded from the determination of adjusted net earnings. Consequently, the presentation of adjusted net earnings enables shareholders to better understand the underlying operating performance of the core mining business through the eyes of management. Management periodically evaluates the components of adjusted net earnings based on an internal assessment of performance measures that are useful for evaluating the operating performance of our business and a review of the non-GAAP measures used by mining industry analysts and other mining companies.
Adjusted net earnings is intended to provide additional information only and does not have any standardized meaning under IFRS and may not be comparable to similar measures presented by other companies. It should not be considered in isolation or as a substitute for measures of performance prepared in accordance with IFRS. The measure is not necessarily indicative of operating profit or cash flows from operations as determined under IFRS. The following table reconciles this non-GAAP measure to the most directly comparable IFRS measure.
| (in millions) | |||||||||||||||
| Three Months Ended December 31, | Years Ended December 31, | ||||||||||||||
| 2019 | 2018 | 2019 | 2018 | 2017 | |||||||||||
| Net earnings (loss) | $38.0 | ($71.5 | ) | $96.1 | ($72.6 | ) | $26.6 | ||||||||
| Adjustments: | |||||||||||||||
| Impairment of El Chanate inventory | — | 64.0 | — | 64.0 | — | ||||||||||
| Tax impact on Impairment of El Chanate inventory | — | (14.1 | ) | — | (14.1 | ) | — | ||||||||
| Foreign exchange (gain) loss | — | 1.7 | (0.3 | ) | 4.4 | 5.0 | |||||||||
| Other gain | (2.6 | ) | 10.1 | (5.1 | ) | 8.4 | 3.1 | ||||||||
| Unrealized foreign exchange loss (gain) recorded in deferred tax expense | (8.6 | ) | 14.1 | (13.2 | ) | 28.8 | (22.5 | ) | |||||||
| Transaction costs related to the Richmont acquisition | — | — | — | — | 3.8 | ||||||||||
| Acquisition fair value adjustment on Richmont acquisition | — | — | — | — | 1.3 | ||||||||||
| Loss on redemption of senior secured notes | — | — | — | — | 29.1 | ||||||||||
| Other income tax and mining tax adjustments | 5.3 | — | 6.0 | 0.7 | (7.5 | ) | |||||||||
| Adjusted net earnings | $32.1 | $4.3 | $83.5 | $19.6 | $38.9 | ||||||||||
| Adjusted earnings per share – basic and diluted | $0.08 | $0.01 | $0.21 | $0.05 | $0.13 |
Cash Flow from Operating Activities before Changes in Working Capital and Cash Taxes
“Cash flow from operating activities before changes in working capital and cash taxes” is a non-GAAP performance measure that could provide an indication of the Company’s ability to generate cash flows from operations, and is calculated by adding back the change in working capital and taxes received to “Cash provided by (used in) operating activities” as presented on the Company’s consolidated statements of cash flows. “Cash flow from operating activities before changes in working capital” is a non-GAAP financial measure with no standard meaning under IFRS.
The following table reconciles the non-GAAP measure to the consolidated statements of cash flows.
| (in millions) | |||||||||
| Three Months Ended December 31, | Years Ended December 31, | ||||||||
| 2019 | 2018 | 2019 | 2018 | ||||||
| Cash flow from operating activities | $77.8 | $47.4 | $260.4 | $213.9 | |||||
| Add (less): Changes in working capital and cash taxes | 7.9 | 5.4 | 36.5 | (1.2 | ) | ||||
| Cash flow from operating activities before changes in working capital and cash taxes | $ 85.7 | $ 52.8 | $ 296.9 | $ 212.7 |
Company-wide Free Cash Flow
“Company-wide free cash flow” is a non-GAAP performance measure calculated from the consolidated operating cash flow, less consolidated mineral property, plant and equipment expenditures. The Company believes this to be a useful indicator of our ability to operate without reliance on additional borrowing or usage of existing cash company-wide. Company-wide free cash flow is intended to provide additional information only and does not have any standardized meaning under IFRS and may not be comparable to similar measures of performance presented by other mining companies. Company-wide free cash flow should not be considered in isolation or as a substitute for measures of performance prepared in accordance with IFRS.
| (in millions) | |||||||||
| Three Months Ended December 31, | Years Ended December 31, | ||||||||
| 2019 | 2018 | 2019 | 2018 | ||||||
| Cash flow from operating activities | $77.8 | $47.4 | $260.4 | $213.9 | |||||
| Less: mineral property, plant and equipment expenditures | (72.9 | ) | (61.5 | ) | (263.6 | ) | (221.5 | ) | |
| Company-wide free cash flow | $ 4.9 | ($ 14.1 | ) | ($ 3.2 | ) | ($ 7.6 | ) |
Mine-site Free Cash Flow
“Mine-site free cash flow” is a non-GAAP financial performance measure calculated as cash flow from mine-site operating activities, less mineral property, plant and equipment expenditures. The Company believes this to be a useful indicator of our ability to operate without reliance on additional borrowing or usage of existing cash. Mine-site free cash flow is intended to provide additional information only and does not have any standardized meaning under IFRS and may not be comparable to similar measures of performance presented by other mining companies. Mine-site free cash flow should not be considered in isolation or as a substitute for measures of performance prepared in accordance with IFRS.
| Total Mine-Site Free Cash Flow | |||||||||
| Three Months Ended December 31, | Years Ended December 31, | ||||||||
| 2019 | 2018 | 2019 | 2018 | ||||||
| (in millions) | |||||||||
| Cash flow from operating activities | $77.8 | $47.4 | $260.4 | $213.9 | |||||
| Less: operating cash flow used by non-mine site activity | (1.6 | ) | (9.6 | ) | (24.3 | ) | (31.1 | ) | |
| Cash flow from operating mine-sites | $ 79.4 | $ 57.0 | $ 284.7 | $ 245.0 | |||||
| Mineral property, plant and equipment expenditure | $72.9 | $61.5 | $263.6 | $221.5 | |||||
| Less: capital expenditures from development projects, and corporate | (11.7 | ) | (9.7 | ) | (40.6 | ) | (32.9 | ) | |
| Capital expenditure from mine-sites | $ 61.2 | $ 51.8 | $ 223.0 | $ 188.6 | |||||
| Total mine-site free cash flow | $ 18.2 | $ 5.2 | $ 61.7 | $ 56.4 |
| Young-Davidson Mine-Site Free Cash Flow | |||||||||
| Three Months Ended December 31, | Years Ended December 31, | ||||||||
| 2019 | 2018 | 2019 | 2018 | ||||||
| (in millions) | |||||||||
| Cash flow from operating activities | $38.9 | $23.6 | $112.7 | $97.5 | |||||
| Mineral property, plant and equipment expenditure | (27.0 | ) | (23.1 | ) | (99.9 | ) | (86.6 | ) | |
| Mine-site free cash flow | $ 11.9 | $ 0.5 | $ 12.8 | $ 10.9 |
| Mulatos Mine-Site Free Cash Flow | |||||||||
| Three Months Ended December 31, | Years Ended December 31, | ||||||||
| 2019 | 2018 | 2019 | 2018 | ||||||
| (in millions) | |||||||||
| Cash flow from operating activities | $10.5 | $14.7 | $41.5 | $71.0 | |||||
| Mineral property, plant and equipment expenditure | (9.5 | ) | (11.8 | ) | (54.2 | ) | (35.3 | ) | |
| Mine-site free cash flow | $ 1.0 | $ 2.9 | ($ 12.7 | ) | $ 35.7 |
| Island Gold Mine-Site Free Cash Flow | |||||||||
| Three Months Ended December 31, | Years Ended December 31, | ||||||||
| 2019 | 2018 | 2019 | 2018 | ||||||
| (in millions) | |||||||||
| Cash flow from operating activities | $34.1 | $16.3 | $133.4 | $75.9 | |||||
| Mineral property, plant and equipment expenditure | (24.7 | ) | (16.8 | ) | (68.9 | ) | (66.1 | ) | |
| Mine-site free cash flow | $ 9.4 | ($ 0.5 | ) | $ 64.5 | $ 9.8 |
| El Chanate Mine-Site Free Cash Flow | |||||||||
| Three Months Ended December 31, | Years Ended December 31, | ||||||||
| 2019 | 2018 | 2019 | 2018 | ||||||
| (in millions) | |||||||||
| Cash flow from operating activities | ($4.1 | ) | $2.4 | ($2.9 | ) | $0.6 | |||
| Mineral property, plant and equipment expenditure | — | (0.1 | ) | — | (0.6 | ) | |||
| Mine-site free cash flow | ($ 4.1 | ) | $ 2.3 | ($ 2.9 | ) | $ — |
Total Cash Costs per ounce
Total cash costs per ounce is a non-GAAP term typically used by gold mining companies to assess the level of gross margin available to the Company by subtracting these costs from the unit price realized during the period. This non-GAAP term is also used to assess the ability of a mining company to generate cash flow from operations. Total cash costs per ounce includes mining and processing costs plus applicable royalties, and net of by-product revenue and net realizable value adjustments. Total cash costs per ounce is exclusive of exploration costs.
Total cash costs per ounce is intended to provide additional information only and does not have any standardized meaning under IFRS and may not be comparable to similar measures presented by other mining companies. It should not be considered in isolation or as a substitute for measures of performance prepared in accordance with IFRS. The measure is not necessarily indicative of cash flow from operations under IFRS or operating costs presented under IFRS.
All-in Sustaining Costs per ounce and Mine-site All-in Sustaining Costs
The Company adopted an “all-in sustaining costs per ounce” non-GAAP performance measure in accordance with the World Gold Council published in June 2013. The Company believes the measure more fully defines the total costs associated with producing gold; however, this performance measure has no standardized meaning. Accordingly, there may be some variation in the method of computation of “all-in sustaining costs per ounce” as determined by the Company compared with other mining companies. In this context, “all-in sustaining costs per ounce” for the consolidated Company reflects total mining and processing costs, corporate and administrative costs, share-based compensation, exploration costs, sustaining capital, and other operating costs.
For the purposes of calculating “mine-site all-in sustaining costs” at the individual mine-sites, the Company does not include an allocation of corporate and administrative costs and share-based compensation, as detailed in the reconciliations below.
Sustaining capital expenditures are expenditures that do not increase annual gold ounce production at a mine site and excludes all expenditures at the Company’s development projects as well as certain expenditures at the Company’s operating sites that are deemed expansionary in nature. For each mine-site reconciliation, corporate and administrative costs, and non-site specific costs are not included in the all-in sustaining cost per ounce calculation.
All-in sustaining costs per gold ounce is intended to provide additional information only and does not have any standardized meaning under IFRS and may not be comparable to similar measures presented by other mining companies. It should not be considered in isolation or as a substitute for measures of performance prepared in accordance with IFRS.
The measure is not necessarily indicative of cash flow from operations under IFRS or operating costs presented under IFRS.
Total Cash Costs and All-in Sustaining Costs per Ounce Reconciliation Tables
The following tables reconciles these non-GAAP measures to the most directly comparable IFRS measures on a Company-wide and individual mine-site basis.
| Total Cash Costs and AISC Reconciliation – Company-wide | |||||||||||
| Three Months Ended December 31, | Years Ended December 31, | ||||||||||
| 2019 | 2018 | 2019 | 2018 | 2017 | |||||||
| (in millions, except ounces and per ounce figures) | |||||||||||
| Mining and processing | $87.4 | $96.2 | $339.0 | $387.2 | $315.6 | ||||||
| Royalties | 4.4 | 4.8 | 17.4 | 21.6 | 15.6 | ||||||
| Total cash costs | $91.8 | $101.0 | $356.4 | $408.8 | $331.2 | ||||||
| Gold ounces sold | 127,148 | 131,161 | 494,702 | 509,879 | 430,115 | ||||||
| Total cash costs per ounce | $ 722 | $ 770 | $ 720 | $ 802 | $ 770 | ||||||
| Total cash costs | $91.8 | $101.0 | $356.4 | $408.8 | $331.2 | ||||||
| Corporate and administrative(1) | 5.2 | 3.5 | 19.8 | 17.4 | 15.5 | ||||||
| Sustaining capital expenditures(2) | 23.3 | 21.4 | 76.8 | 63.8 | 42.7 | ||||||
| Share-based compensation | 1.5 | 1.3 | 9.2 | 6.6 | 6.2 | ||||||
| Sustaining exploration | 1.2 | 0.9 | 5.4 | 4.8 | 3.9 | ||||||
| Accretion of decommissioning liabilities | 0.6 | 0.8 | 2.8 | 3.0 | 2.7 | ||||||
| Realized gains on FX options | — | — | — | — | (0.8 | ) | |||||
| Total all-in sustaining costs | $123.6 | $128.9 | $470.4 | $504.4 | $401.4 | ||||||
| Gold ounces sold | 127,148 | 131,161 | 494,702 | 509,879 | 430,115 | ||||||
| All-in sustaining costs per ounce | $ 972 | $ 983 | $ 951 | $ 989 | $ 933 |
(1) Corporate and administrative expenses exclude expenses incurred at development properties.
(2) Sustaining capital expenditures are defined as those expenditures which do not increase annual gold ounce production at a mine site and exclude all expenditures at growth projects and certain expenditures at operating sites which are deemed expansionary in nature. Total sustaining capital for the period is as follows:
| Three Months Ended December 31, | Years Ended December 31, | ||||||||||
| 2019 | 2018 | 2019 | 2018 | 2017 | |||||||
| (in millions) | |||||||||||
| Capital expenditures per cash flow statement | $72.9 | $61.5 | $263.6 | $221.5 | $162.5 | ||||||
| Less: non-sustaining capital expenditures at: | |||||||||||
| Young-Davidson | (10.6 | ) | (12.3 | ) | (53.7 | ) | (50.8 | ) | (46.2 | ) | |
| Mulatos | (8.3 | ) | (9.3 | ) | (47.7 | ) | (28.1 | ) | (38.4 | ) | |
| Island Gold | (19.0 | ) | (8.8 | ) | (44.8 | ) | (45.9 | ) | (3.1 | ) | |
| Corporate and other | (11.7 | ) | (9.7 | ) | (40.6 | ) | (32.9 | ) | (32.1 | ) | |
| Sustaining capital expenditures | $23.3 | $21.4 | $76.8 | $63.8 | $42.7 |
| Young-Davidson Total Cash Costs and Mine-site AISC Reconciliation | |||||||||
| Three Months Ended December 31, | Years Ended December 31, | ||||||||
| 2019 | 2018 | 2019 | 2018 | ||||||
| (in millions, except ounces and per ounce figures) | |||||||||
| Mining and processing | $38.1 | $38.7 | $146.6 | $149.0 | |||||
| Royalties | 1.5 | 1.0 | 4.4 | 3.6 | |||||
| Total cash costs | $39.6 | $39.7 | $151.0 | $152.6 | |||||
| Gold ounces sold | 51,694 | 51,944 | 188,785 | 185,593 | |||||
| Total cash costs per ounce | $ 766 | $ 764 | $ 800 | $ 822 | |||||
| Total cash costs | $39.6 | $39.7 | $151.0 | $152.6 | |||||
| Sustaining capital expenditures | 16.4 | 10.8 | 46.2 | 35.8 | |||||
| Sustaining exploration | — | 0.1 | 0.3 | 0.2 | |||||
| Accretion of decommissioning liabilities | — | — | 0.1 | 0.2 | |||||
| Total all-in sustaining costs | $56.0 | $50.6 | $197.6 | $188.8 | |||||
| Gold ounces sold | 51,694 | 51,944 | 188,785 | 185,593 | |||||
| Mine-site all-in sustaining costs per ounce | $ 1,083 | $ 974 | $ 1,047 | $ 1,017 |
| Mulatos Total Cash Costs and Mine-site AISC Reconciliation | |||||||||
| Three Months Ended December 31, | Years Ended December 31, | ||||||||
| 2019 | 2018 | 2019 | 2018 | ||||||
| (in millions, except ounces and per ounce figures) | |||||||||
| Mining and processing | $27.8 | $28.7 | $107.8 | $125.9 | |||||
| Royalties | 0.2 | 2.1 | 3.1 | 11.8 | |||||
| Total cash costs | $28.0 | $30.8 | $110.9 | $137.7 | |||||
| Gold ounces sold | 34,127 | 38,819 | 141,496 | 175,104 | |||||
| Total cash costs per ounce | $ 820 | $ 793 | $ 784 | $ 786 | |||||
| Total cash costs | $28.0 | $30.8 | $110.9 | $137.7 | |||||
| Sustaining capital expenditures | 1.2 | 2.5 | 6.5 | 7.2 | |||||
| Sustaining exploration | 0.7 | 0.3 | 3.1 | 2.6 | |||||
| Accretion of decommissioning liabilities | 0.5 | 0.6 | 2.3 | 2.2 | |||||
| Total all-in sustaining costs | $30.4 | $34.2 | $122.8 | $149.7 | |||||
| Gold ounces sold | 34,127 | 38,819 | 141,496 | 175,104 | |||||
| Mine-site all-in sustaining costs per ounce | $ 891 | $ 881 | $ 868 | $ 855 |
| Island Gold Total Cash Costs and Mine-site AISC Reconciliation | |||||||||
| Three Months Ended December 31, | Years Ended December 31, | ||||||||
| 2019 | 2018 | 2019 | 2018 | ||||||
| (in millions, except ounces and per ounce figures) | |||||||||
| Mining and processing | $17.4 | $15.5 | $64.2 | $56.0 | |||||
| Royalties | 2.7 | 1.7 | 9.9 | 6.2 | |||||
| Total cash costs | $20.1 | $17.2 | $74.1 | $62.2 | |||||
| Gold ounces sold | 39,652 | 30,199 | 149,746 | 105,520 | |||||
| Total cash costs per ounce | $ 507 | $ 570 | $ 495 | $ 589 | |||||
| Total cash costs | $20.1 | $17.2 | $74.1 | $62.2 | |||||
| Sustaining capital expenditures | 5.7 | 8.0 | 24.1 | 20.2 | |||||
| Accretion of decommissioning liabilities | 0.1 | — | 0.1 | — | |||||
| Total all-in sustaining costs | $25.9 | $25.2 | $98.3 | $82.4 | |||||
| Gold ounces sold | 39,652 | 30,199 | 149,746 | 105,520 | |||||
| Mine-site all-in sustaining costs per ounce | $ 653 | $ 834 | $ 656 | $ 781 |
| El Chanate Total Cash Costs and Mine-site AISC Reconciliation | |||||||||
| Three Months Ended December 31, | Years Ended December 31, | ||||||||
| 2019 | 2018 | 2019 | 2018 | ||||||
| (in millions, except ounces and per ounce figures) | |||||||||
| Mining and processing | $4.1 | $13.3 | $20.4 | $56.3 | |||||
| Total cash costs | $4.1 | $13.3 | $20.4 | $56.3 | |||||
| Gold ounces sold | 1,675 | 10,199 | 14,675 | 43,662 | |||||
| Total cash costs per ounce | $ 2,448 | $ 1,304 | $ 1,390 | $ 1,289 | |||||
| Total cash costs | $4.1 | $13.3 | $20.4 | $56.3 | |||||
| Sustaining capital expenditures | — | 0.1 | — | 0.6 | |||||
| Accretion of decommissioning liabilities | — | 0.2 | 0.3 | 0.6 | |||||
| Total all-in sustaining costs | $4.1 | $13.6 | $20.7 | $57.5 | |||||
| Gold ounces sold | 1,675 | 10,199 | 14,675 | 43,662 | |||||
| Mine-site all-in sustaining costs per ounce | $ 2,448 | $ 1,333 | $ 1,411 | $ 1,317 |
Earnings Before Interest, Taxes, Depreciation, and Amortization (“EBITDA”)
EBITDA represents net earnings before interest, taxes, depreciation, and amortization. EBITDA is an indicator of the Company’s ability to generate liquidity by producing operating cash flow to fund working capital needs, service debt obligations, and fund capital expenditures.
EBITDA does not have any standardized meaning under IFRS and may not be comparable to similar measures presented by other mining companies. It should not be considered in isolation or as a substitute for measures of performance prepared in accordance with IFRS.
The following is a reconciliation of EBITDA to the consolidated financial statements:
| (in millions) | |||||||||
| Three Months Ended December 31, | Years Ended December 31, | ||||||||
| 2019 | 2018 | 2019 | 2018 | ||||||
| Net earnings (loss) | $38.0 | ($71.5 | ) | $96.1 | ($72.6 | ) | |||
| Add back: | |||||||||
| Finance expense | 0.4 | 0.2 | 2.5 | 3.0 | |||||
| Amortization | 44.2 | 42.1 | 165.0 | 166.6 | |||||
| Impairment of El Chanate inventory | — | 64.0 | — | 64.0 | |||||
| Loss on redemption of senior secured notes | — | — | — | — | |||||
| Deferred income tax expense | 11.6 | 8.8 | 20.1 | 16.9 | |||||
| Current income tax (recovery) expense | (5.8 | ) | (0.6 | ) | 12.7 | 17.3 | |||
| EBITDA | $ 88.4 | $ 43.0 | $ 296.4 | $ 195.2 |
Additional GAAP Measures
Additional GAAP measures are presented on the face of the Company’s consolidated statements of comprehensive income (loss) and are not meant to be a substitute for other subtotals or totals presented in accordance with IFRS, but rather should be evaluated in conjunction with such IFRS measures. The following additional GAAP measures are used and are intended to provide an indication of the Company’s mine and operating performance:
- Earnings from operations – represents the amount of earnings before net finance income/expense, foreign exchange gain/loss, other income/loss, loss on redemption of senior secured notes and income tax expense
Unaudited Consolidated Statements of Financial Position, Comprehensive
Income, and Cash Flow
ALAMOS GOLD INC.
Consolidated Statements of Financial Position
(Unaudited – stated in millions of United States dollars)
| December 31, 2019 | December 31, 2018 | ||||
| A S S E T S | |||||
| Current Assets | |||||
| Cash and cash equivalents | $182.8 | $206.0 | |||
| Equity securities | 22.8 | 7.8 | |||
| Amounts receivable | 37.4 | 39.5 | |||
| Income taxes receivable | 4.6 | 8.0 | |||
| Inventory | 126.9 | 110.2 | |||
| Other current assets | 19.8 | 15.5 | |||
| Total Current Assets | 394.3 | 387.0 | |||
| Non-Current Assets | |||||
| Long-term inventory | 25.7 | 30.0 | |||
| Mineral property, plant and equipment | 2,933.4 | 2,813.3 | |||
| Other non-current assets | 43.1 | 41.9 | |||
| Total Assets | $ 3,396.5 | $ 3,272.2 | |||
| L I A B I L I T I E S | |||||
| Current Liabilities | |||||
| Accounts payable and accrued liabilities | $127.3 | $131.9 | |||
| Total Current Liabilities | 127.3 | 131.9 | |||
| Non-Current Liabilities | |||||
| Deferred income taxes | 513.7 | 491.5 | |||
| Decommissioning liabilities | 57.1 | 44.9 | |||
| Other non-current liabilities | 3.1 | 1.6 | |||
| Total Liabilities | 701.2 | 669.9 | |||
| E Q U I T Y | |||||
| Share capital | $3,693.3 | $3,705.2 | |||
| Contributed surplus | 90.7 | 87.3 | |||
| Warrants | — | 3.9 | |||
| Accumulated other comprehensive loss | (0.2 | ) | (9.2 | ) | |
| Deficit | (1,088.5 | ) | (1,184.9 | ) | |
| Total Equity | 2,695.3 | 2,602.3 | |||
| Total Liabilities and Equity | $ 3,396.5 | $ 3,272.2 |
ALAMOS GOLD INC.
Consolidated Statements of Comprehensive Income (Loss)
(Unaudited – stated in millions of United States dollars, except share and per share amounts)
| For three months ended | For twelve months ended | ||||||||||
| December 31, | December 31, | December 31, | December 31, | ||||||||
| 2019 | 2018 | 2019 | 2018 | ||||||||
| OPERATING REVENUES | $186.0 | $163.1 | $683.1 | $651.8 | |||||||
| COST OF SALES | |||||||||||
| Mining and processing | 87.4 | 96.2 | 339.0 | 387.2 | |||||||
| Impairment of El Chanate inventory | — | 64.0 | — | 64.0 | |||||||
| Royalties | 4.4 | 4.8 | 17.4 | 21.6 | |||||||
| Amortization | 44.2 | 42.1 | 165.0 | 166.6 | |||||||
| 136.0 | 207.1 | 521.4 | 639.4 | ||||||||
| EXPENSES | |||||||||||
| Exploration | 1.7 | 2.5 | 6.7 | 11.0 | |||||||
| Corporate and administrative | 5.2 | 3.5 | 19.8 | 17.4 | |||||||
| Share-based compensation | 1.5 | 1.3 | 9.2 | 6.6 | |||||||
| 144.4 | 214.4 | 557.1 | 674.4 | ||||||||
| EARNINGS (LOSS) FROM OPERATIONS | 41.6 | (51.3 | ) | 126.0 | (22.6 | ) | |||||
| OTHER EXPENSES | |||||||||||
| Finance expense | (0.4 | ) | (0.2 | ) | (2.5 | ) | (3.0 | ) | |||
| Foreign exchange gain (loss) | — | (1.7 | ) | 0.3 | (4.4 | ) | |||||
| Other gain (loss) | 2.6 | (10.1 | ) | 5.1 | (8.4 | ) | |||||
| EARNINGS (LOSS) BEFORE INCOME TAXES | $ 43.8 | ($ 63.3 | ) | $ 128.9 | ($ 38.4 | ) | |||||
| INCOME TAXES | |||||||||||
| Current income tax recovery (expense) | 5.8 | 0.6 | (12.7 | ) | (17.3 | ) | |||||
| Deferred income tax expense | (11.6 | ) | (8.8 | ) | (20.1 | ) | (16.9 | ) | |||
| NET EARNINGS (LOSS) | $ 38.0 | ($ 71.5 | ) | $ 96.1 | ($ 72.6 | ) | |||||
| Items that may be subsequently reclassified to net earnings: | |||||||||||
| Unrealized gain (loss) on currency hedging instruments, net of taxes | 1.8 | (4.5 | ) | 6.0 | (7.4 | ) | |||||
| Unrealized gain on fuel hedging instruments, net of taxes | — | (0.5 | ) | 0.5 | (0.5 | ) | |||||
| Items that will not be reclassified to net earnings: | |||||||||||
| Unrealized gain (loss) on equity securities, net of taxes | 3.5 | 3.2 | 2.5 | (1.8 | ) | ||||||
| Total other comprehensive income (loss) | $ 5.3 | ($ 1.8 | ) | $ 9.0 | ($ 9.7 | ) | |||||
| COMPREHENSIVE INCOME (LOSS) | $ 43.3 | ($ 73.3 | ) | $ 105.1 | ($ 82.3 | ) | |||||
| EARNINGS PER SHARE | |||||||||||
| – basic | $ 0.10 | ($ 0.18 | ) | $ 0.25 | ($ 0.19 | ) | |||||
| – diluted | $ 0.10 | ($ 0.18 | ) | $ 0.24 | ($ 0.19 | ) | |||||
| Weighted average number of common shares outstanding (000’s) | |||||||||||
| – basic | 391,076 | 390,540 | 390,160 | 389,816 | |||||||
| – diluted | 394,353 | 390,540 | 393,427 | 389,816 |
ALAMOS GOLD INC.
Consolidated Statements of Cash Flows
(Unaudited – stated in millions of United States dollars)
| For three months ended | For twelve months ended | ||||||||||
| December 31, | December 31, | December 31, | December 31, | ||||||||
| 2019 | 2018 | 2019 | 2018 | ||||||||
| CASH PROVIDED BY (USED IN): | |||||||||||
| OPERATING ACTIVITIES | |||||||||||
| Net earnings (loss) for the period | $38.0 | ($71.5 | ) | $96.1 | ($72.6 | ) | |||||
| Adjustments for items not involving cash: | |||||||||||
| Amortization | 44.2 | 42.1 | 165.0 | 166.6 | |||||||
| Foreign exchange (gain) loss | — | 1.7 | (0.3 | ) | 4.4 | ||||||
| Current income tax expense | (5.8 | ) | (0.6 | ) | 12.7 | 17.3 | |||||
| Deferred income tax expense (recovery) | 11.6 | 8.8 | 20.1 | 16.9 | |||||||
| Share-based compensation | 1.5 | 1.3 | 9.2 | 6.6 | |||||||
| Finance expense | 0.4 | 0.2 | 2.5 | 3.0 | |||||||
| Impairment of El Chanate inventory | — | 64.0 | — | 64.0 | |||||||
| Other items | (4.2 | ) | 6.8 | (8.4 | ) | 6.5 | |||||
| Changes in working capital and cash taxes | (7.9 | ) | (5.4 | ) | (36.5 | ) | 1.2 | ||||
| 77.8 | 47.4 | 260.4 | 213.9 | ||||||||
| INVESTING ACTIVITIES | |||||||||||
| Mineral property, plant and equipment | (72.9 | ) | (61.5 | ) | (263.6 | ) | (221.5 | ) | |||
| Proceeds from sale of equity securities | — | — | — | 24.9 | |||||||
| Other | (2.4 | ) | — | (4.0 | ) | — | |||||
| (75.3 | ) | (61.5 | ) | (267.6 | ) | (196.6 | ) | ||||
| FINANCING ACTIVITIES | |||||||||||
| Repayment of equipment financing obligations | (0.7 | ) | (0.9 | ) | (3.3 | ) | (4.1 | ) | |||
| Revolving credit facility transaction fees | (1.2 | ) | 0.0 | (1.2 | ) | (0.8 | ) | ||||
| Repurchase and cancellation of common shares | — | — | (11.4 | ) | — | ||||||
| Proceeds from the exercise of options and warrants | 0.0 | 2.2 | 7.0 | 3.9 | |||||||
| Dividends paid | (3.9 | ) | (3.9 | ) | (15.6 | ) | (7.8 | ) | |||
| Proceeds from issuance of flow-through shares | — | — | 7.5 | — | |||||||
| (5.8 | ) | (2.6 | ) | (17.0 | ) | (8.8 | ) | ||||
| Effect of exchange rates on cash and cash equivalents | 0.5 | (2.1 | ) | 1.0 | (3.3 | ) | |||||
| Net increase (decrease) in cash and cash equivalents | (2.8 | ) | (18.8 | ) | (23.2 | ) | 5.2 | ||||
| Cash and cash equivalents – beginning of period | 185.6 | 224.8 | 206.0 | 200.8 | |||||||
| CASH AND CASH EQUIVALENTS – END OF PERIOD | $ 182.8 | $ 206.0 | $ 182.8 | $ 206.0 |
Source: Alamos Gold Inc.
Original Article: https://www.alamosgold.com/news-and-media/news-releases/news-releases-details/2020/Alamos-Gold-Reports-Fourth-Quarter-and-Year-End-2019-Results/default.aspx


