Record quarterly production, solid cost performance drive margin expansion; cash balance more than doubles to $266 million; full-year production and CAS1 guidance ranges narrowed and refined
CHICAGO–(BUSINESS WIRE)–Coeur Mining, Inc. (“Coeur” or the “Company”) (NYSE: CDE) today reported record third quarter 2025 financial results, including revenue of $555 million and cash flow from operating activities of $238 million. The Company reported record quarterly GAAP net income from continuing operations of $267 million, or $0.41 per share. On an adjusted basis1, Coeur reported record quarterly EBITDA of $299 million, record cash flow from operating activities before changes in working capital of $239 million and record net income from continuing operations of $147 million, or $0.23 per share.
Key Highlights
- Record quarterly production and solid cost performance –Operating strength acrossthe portfolio together with higher gold and silver prices drove a second consecutive quarter of record results. Quarterly silver production of 4.8 million ounces was 1% higher quarter-over-quarter and 57% higher year-over-year. Gold production increased 3% quarter-over-quarter and 17% year-over-year to 111,364 ounces. Average realized prices for gold and silver increased 4% and 15%, respectively, compared to the second quarter, leading to further margin expansion
- Record quarterly financial results – Fifth consecutive quarter of positive free cash flow, which increased 29% versus the prior quarter to a record $189 million. Adjusted EBITDA1 increased 23% versus the prior quarter to a record $299 million, bringing the last twelve-month (“LTM”) total to $808 million. Sixth consecutive quarter of GAAP net income, which totaled a record $267 million, or $0.41 per share
- Significantly bolstered liquidity position – Quarter-end cash and equivalents more than doubled to $266 million compared to the prior quarter-end. Year-to-date, the Company has repaid over $228 million of total debt and its net leverage ratio decreased to 0.1x at quarter-end with a strong net cash position expected at year-end. Nearly 10% of the Company’s share repurchase program has been completed at an average price of $11.79 per share
- Full-year production and cost guidance refined – Coeur refined its full year 2025 production guidance ranges, resulting in a 1% increase in the midpoint of expected full year gold production to 415,250 ounces and a 2% decrease in the midpoint of expected full year silver production to 18.1 million ounces. Coeur also adjusted its full-year 2025 cost guidance lower at three of its five operations
“Coeur delivered another quarter of record financial results, driven by higher prices, balanced contributions from all five of our North American gold and silver operations along with overall strong cost control,” said Mitchell J. Krebs, Chairman, President and Chief Executive Officer. “Las Chispas experienced a particularly strong quarter, with the team continuing to exceed expectations in just its second full quarter of operations with the Company.
“We look forward to delivering another record quarter in the final three months of the year based on anticipated higher average realized prices and increasing margins which is expected to push full-year 2025 adjusted EBITDA to over $1 billion, full-year 2025 free cash flow to over $550 million and place the Company in an extremely strong position to achieve record-setting operating and financial results in 2026.”
Financial and Operating Highlights (Unaudited)
| (Amounts in millions, except per share amounts, gold ounces produced & sold, and per-ounce metrics) | 3Q 2025 | 2Q 2025 | 1Q 2025 | 4Q 2024 | 3Q 2024 | |||||
| Gold Sales | $ | 360.5 | $ | 323.1 | $ | 235.3 | $ | 205.2 | $ | 223.8 |
| Silver Sales | $ | 194.1 | $ | 157.5 | $ | 124.7 | $ | 100.2 | $ | 89.7 |
| Consolidated Revenue | $ | 554.6 | $ | 480.7 | $ | 360.1 | $ | 305.4 | $ | 313.5 |
| Costs Applicable to Sales2 | $ | 248.7 | $ | 229.5 | $ | 204.3 | $ | 158.8 | $ | 156.7 |
| General and Administrative Expenses | $ | 14.8 | $ | 13.3 | $ | 13.9 | $ | 11.1 | $ | 11.0 |
| Net Income | $ | 266.8 | $ | 70.7 | $ | 33.4 | $ | 37.9 | $ | 48.7 |
| Net Income Per Share | $ | 0.41 | $ | 0.11 | $ | 0.06 | $ | 0.08 | $ | 0.12 |
| Adjusted Net Income1 | $ | 147.3 | $ | 127.4 | $ | 59.9 | $ | 45.3 | $ | 47.2 |
| Adjusted Net Income1 Per Share | $ | 0.23 | $ | 0.20 | $ | 0.11 | $ | 0.11 | $ | 0.12 |
| Weighted Average Shares Outstanding | 644.9 | 643.1 | 521.2 | 401.0 | 400.8 | |||||
| EBITDA1 | $ | 249.1 | $ | 203.0 | $ | 105.3 | $ | 104.6 | $ | 121.1 |
| Adjusted EBITDA1 | $ | 299.1 | $ | 243.5 | $ | 148.9 | $ | 116.4 | $ | 126.0 |
| Cash Flow from Operating Activities | $ | 237.7 | $ | 207.0 | $ | 67.6 | $ | 63.8 | $ | 111.1 |
| Capital Expenditures | $ | 49.0 | $ | 60.8 | $ | 50.0 | $ | 47.7 | $ | 42.0 |
| Free Cash Flow1 | $ | 188.7 | $ | 146.2 | $ | 17.6 | $ | 16.1 | $ | 69.1 |
| Cash, Equivalents & Short-Term Investments | $ | 266.3 | $ | 111.6 | $ | 77.6 | $ | 55.1 | $ | 76.9 |
| Total Debt3 | $ | 363.5 | $ | 380.7 | $ | 498.3 | $ | 590.1 | $ | 605.2 |
| Average Realized Price Per Ounce – Gold | $ | 3,148 | $ | 3,021 | $ | 2,635 | $ | 2,399 | $ | 2,309 |
| Average Realized Price Per Ounce – Silver | $ | 38.93 | $ | 33.72 | $ | 32.05 | $ | 31.11 | $ | 29.86 |
| Gold Ounces Produced | 111,364 | 108,487 | 86,766 | 87,149 | 94,993 | |||||
| Silver Ounces Produced | 4.8 | 4.7 | 3.7 | 3.2 | 3.0 | |||||
| Gold Ounces Sold | 114,495 | 106,948 | 89,316 | 85,555 | 96,913 | |||||
| Silver Ounces Sold | 5.0 | 4.7 | 3.9 | 3.2 | 3.0 | |||||
| Adjusted CAS per AuOz1 | $ | 1,215 | $ | 1,260 | $ | 1,330 | $ | 1,192 | $ | 1,113 |
| Adjusted CAS per AgOz1 | $ | 14.95 | $ | 13.41 | $ | 14.28 | $ | 16.93 | $ | 15.67 |
Financial Results
Third quarter 2025 revenue totaled $555 million compared to $481 million in the prior period and $314 million in the third quarter of 2024. The Company produced 111,364 and 4.8 million ounces of gold and silver, respectively, during the quarter. Metal sales for the quarter totaled 114,495 ounces of gold and 5.0 million ounces of silver. Average realized gold and silver prices for the quarter were $3,148 and $38.93 per ounce, respectively, compared to $3,021 and $33.72 per ounce in the prior period and $2,309 and $29.86 per ounce in the third quarter of 2024.
Gold and silver sales represented 65% and 35% of quarterly revenue, respectively, compared to 67% and 33% in the prior period. The Company’s U.S. operations accounted for approximately 55% of both third and second quarter revenue.
Adjusted costs applicable to sales per ounce1 of gold and silver totaled $1,215 and $14.95 respectively. General and administrative expenses increased $2 million, or 11%, quarter-over-quarter to $15 million, due primarily to increased stock-based compensation.
Coeur invested approximately $30 million ($25 million expensed and $5 million capitalized) in exploration during the quarter, compared to approximately $30 million ($23 million expensed and $7 million capitalized) in the prior period. See the “Operations” and “Exploration” sections for additional detail on the Company’s exploration activities.
The Company recorded a significant income and mining tax benefit during the third quarter driven primarily by recording a $216 million tax benefit related to recognition of a significant portion of its U.S. deferred tax assets, including Federal Net Operating Losses on the balance sheet at September 30, 2025. The $216 million valuation allowance release is comprised of $54 million related to current year income and $162 million related to forecasted future year income. The recognition of the deferred tax asset was triggered as the three year cumulative net income position from the Company’s U.S. operations turned positive during the quarter. Cash income and mining taxes paid during the period totaled approximately $36 million and have totaled $137 million year to date, including $63 million and $38 million in the first and second quarters, respectively.
Quarterly operating cash flow increased to $238 million compared to $207 million in the prior period, driven by strong operational performance, increased metal sales and higher average metals prices. Changes in working capital during the quarter were $(1) million.
Third quarter capital expenditures were $49 million compared to $61 million in the prior period. Sustaining and development capital expenditures accounted for approximately $34 million and $15 million, or 70% and 30%, respectively, of Coeur’s total capital investment during the quarter.
Operations
Third quarter 2025 highlights for each of the Company’s operations are provided below.
Las Chispas, Mexico
| (Dollars in millions, except per ounce amounts) | 3Q 2025 | 2Q 2025 | 1Q 2025 | 4Q 2024 | 3Q 2024 | ||||||||||
| Tons milled | 139,916 | 118,399 | 59,368 | — | — | ||||||||||
| Average gold grade (oz/t) | 0.110 | 0.150 | 0.130 | — | — | ||||||||||
| Average silver grade (oz/t) | 10.32 | 13.32 | 12.71 | — | — | ||||||||||
| Average recovery rate – Au | 97.9 | % | 98.6 | % | 98.6 | % | — | % | — | % | |||||
| Average recovery rate – Ag | 97.8 | % | 98.5 | % | 98.1 | % | — | % | — | % | |||||
| Gold ounces produced | 16,540 | 16,271 | 7,175 | — | — | ||||||||||
| Silver ounces produced (000’s) | 1,572 | 1,489 | 714 | — | — | ||||||||||
| Gold ounces sold | 17,800 | 16,025 | 9,607 | — | — | ||||||||||
| Silver ounces sold (000’s) | 1,675 | 1,479 | 924 | — | — | ||||||||||
| Average realized price per gold ounce | $ | 3,427 | $ | 3,315 | $ | 2,902 | $ | — | $ | — | |||||
| Average realized price per silver ounce | $ | 38.89 | $ | 33.48 | $ | 32.63 | $ | — | $ | — | |||||
| Metal sales | $ | 126.1 | $ | 102.7 | $ | 58.0 | $ | — | $ | — | |||||
| Costs applicable to sales2 | $ | 68.1 | $ | 57.7 | $ | 42.8 | $ | — | $ | — | |||||
| Adjusted CASper AuOz1 | $ | 934 | $ | 894 | $ | 744 | $ | — | $ | — | |||||
| Adjusted CASper AgOz1 | $ | 10.75 | $ | 8.94 | $ | 8.38 | $ | — | $ | — | |||||
| Exploration expense | $ | 2.5 | $ | 3.3 | $ | 1.9 | $ | — | $ | — | |||||
| Cash flow from operating activities | $ | 75.9 | $ | 58.6 | $ | 97.1 | $ | — | $ | — | |||||
| Sustaining capital expenditures (excludes capital lease payments) | $ | 9.8 | $ | 9.2 | $ | 5.3 | $ | — | $ | — | |||||
| Development capital expenditures | $ | — | $ | — | $ | — | $ | — | $ | — | |||||
| Total capital expenditures | $ | 9.8 | $ | 9.2 | $ | 5.3 | $ | — | $ | — | |||||
| Free cash flow1 | $ | 66.1 | $ | 49.4 | $ | 91.8 | $ | — | $ | — |
Operational
- Third quarter gold and silver production increased to 16,540 ounces and 1.6 million ounces, respectively, compared to 16,271 gold ounces and 1.5 million silver ounces in the prior period
- Production during the quarter benefited from higher mill throughput driven by the consumption of the remaining acquired stockpile and recovery of in-circuit inventory
Financial
- Adjusted CAS1 for gold and silver on a co-product basis totaled $934 for gold and $10.75 for silver, which were higher quarter-over-quarter due to the planned processing of lower grade acquired stockpile material
- Gold and silver accounted for approximately 48% and 52%, respectively, of revenue during the quarter
- Free cash flow1 totaled $66 million compared to $49 million in the prior period
Exploration
- Exploration investment in the third quarter totaled approximately $4 million (substantially all expensed) compared to $3 million (substantially all expensed) in the prior period
- In the Las Chispas Block and the Gap Zone, up to six rigs were active during the quarter: three on surface and three underground, while in the Babicanora Block up to 7 additional rigs were active underground
- Infill and expansion drilling of the Augusta vein (in the Gap Zone) commenced from the new underground ramp with excellent results received, including the discovery of the Promesa vein located between Augusta and William Tell. The high-grade Augusta discovery made earlier this year has now been traced over 450 meters along strike and 150 meters down dip, consistently yielding multi-kilo grade intercepts on a silver equivalent basis
- The William Tell, William Tell Mini, North Las Chispas and La Sopresa veins continued to expand, supporting the potential for expansion of these resource zones
- In the Babicanora Block, infill drilling delivered excellent results
- In the fourth quarter, drilling is expected to continue on all veins detailed above and scout drilling is expected to commence on a number of targets across the district
Guidance
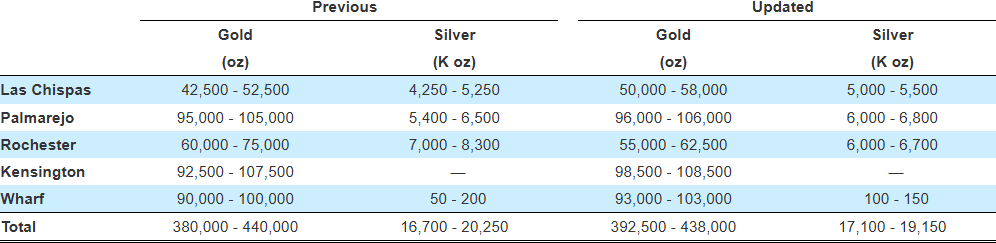
- The Company has increased Las Chispas’ 2025 gold and silver production guidance ranges to reflect strong performance since the acquisition closed on February 14 and strong expected mining and milling rates in the fourth quarter
- Prorated production reflecting 10.5 months of contributions in 2025 is expected to be 50,000 – 58,000 ounces of gold (previously 42,500 – 52,500 ounces) and 5.0 – 5.5 million ounces of silver (previously 4.25 – 5.25 million ounces)
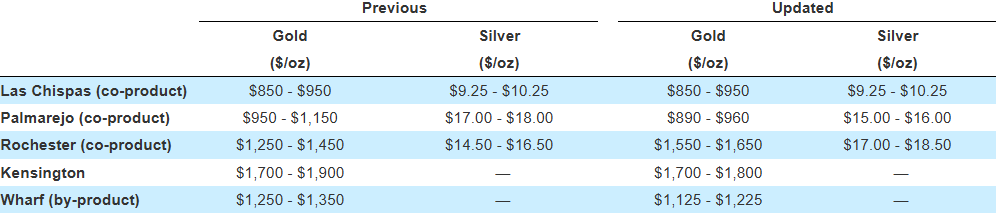
- Prorated adjusted CAS1 reflecting 10.5 months of contributions in 2025 are expected to be $850 – $950 per gold ounce and $9.25 – $10.25 per silver ounce, which are unchanged from previous guidance ranges
- Prorated capital expenditures reflecting 10.5 months of contributions in 2025 are expected to be $30 – $34 million, consisting primarily of sustaining capital, which is unchanged from the previous guidance range
- Prorated exploration investment reflecting 10.5 months of contributions in 2025 is expected to be $16 – $18 million (substantially all expensed), which is unchanged from the previous guidance range
Palmarejo, Mexico
| (Dollars in millions, except per ounce amounts) | 3Q 2025 | 2Q 2025 | 1Q 2025 | 4Q 2024 | 3Q 2024 | ||||||||||
| Tons milled | 485,267 | 483,880 | 440,920 | 419,008 | 413,463 | ||||||||||
| Average gold grade (oz/t) | 0.050 | 0.060 | 0.050 | 0.059 | 0.070 | ||||||||||
| Average silver grade (oz/t) | 3.47 | 4.06 | 4.36 | 4.17 | 5.15 | ||||||||||
| Average recovery rate – Au | 95.0 | % | 92.9 | % | 95.2 | % | 91.2 | % | 94.8 | % | |||||
| Average recovery rate – Ag | 89.9 | % | 88.6 | % | 87.4 | % | 88.3 | % | 85.6 | % | |||||
| Gold ounces produced | 24,802 | 27,272 | 23,032 | 22,490 | 27,549 | ||||||||||
| Silver ounces produced (000’s) | 1,514 | 1,741 | 1,680 | 1,543 | 1,823 | ||||||||||
| Gold ounces sold | 26,850 | 26,782 | 22,713 | 22,353 | 28,655 | ||||||||||
| Silver ounces sold (000’s) | 1,633 | 1,720 | 1,636 | 1,598 | 1,861 | ||||||||||
| Average realized price per gold ounce | $ | 2,144 | $ | 2,093 | $ | 1,924 | $ | 1,750 | $ | 1,922 | |||||
| Average realized price per silver ounce | $ | 38.97 | $ | 33.76 | $ | 31.85 | $ | 31.27 | $ | 29.71 | |||||
| Metal sales | $ | 121.2 | $ | 114.1 | $ | 95.8 | $ | 89.1 | $ | 110.4 | |||||
| Costs applicable to sales2 | $ | 51.0 | $ | 48.7 | $ | 43.7 | $ | 45.5 | $ | 47.5 | |||||
| Adjusted CASper AuOz1 | $ | 887 | $ | 888 | $ | 882 | $ | 894 | $ | 818 | |||||
| Adjusted CASper AgOz1 | $ | 16.44 | $ | 14.39 | $ | 14.37 | $ | 15.92 | $ | 12.60 | |||||
| Exploration expense | $ | 5.7 | $ | 4.0 | $ | 3.9 | $ | 3.8 | $ | 4.3 | |||||
| Cash flow from operating activities | $ | 52.6 | $ | 47.9 | $ | 8.7 | $ | 33.2 | $ | 55.6 | |||||
| Sustaining capital expenditures (excludes capital lease payments) | $ | 4.3 | $ | 3.6 | $ | 2.5 | $ | 6.5 | $ | 4.0 | |||||
| Development capital expenditures | $ | 1.4 | $ | 2.0 | $ | 3.4 | $ | 3.4 | $ | 4.0 | |||||
| Total capital expenditures | $ | 5.7 | $ | 5.6 | $ | 5.9 | $ | 9.9 | $ | 8.0 | |||||
| Free cash flow1 | $ | 46.9 | $ | 42.3 | $ | 2.8 | $ | 23.3 | $ | 47.6 |
Operational
- Third quarter gold and silver production totaled 24,802 and 1.5 million ounces, respectively, compared to 27,272 and 1.7 million ounces in the prior period and 27,549 and 1.8 million ounces in the third quarter of 2024
- Production during the quarter was affected by lower gold and silver grades, partially offset by higher recoveries
Financial
- Adjusted CAS1 for gold and silver on a co-product basis totaled $887 and $16.44 per ounce, respectively
- Capital expenditures totaled $6 million, which were flat compared to the prior period
- Free cash flow1 in the third quarter increased to $47 million compared to $42 million in the prior period, driven by stronger metals sales due to higher realized prices
Exploration
- Exploration investment totaled approximately $6 million (substantially all expensed)
- The exploration program ramped up to 11 rigs across the property during the third quarter
- A key area of focus during the quarter was the San Miguel deposit in the Guazapares block (in the Eastern District), including validation drilling of the historic Paramount resource. Most results are pending but visual inspection of the core is encouraging
- On the Hidalgo Corridor, drilling continues to deliver excellent results, outlining an additional 500 meters of strike length year to date. Since its discovery in 2019, Hidalgo has become Palmarejo’s second largest reserve after Guadalupe and is expected to expand further. Three rigs are expected to remain active in the Hidalgo Corridor through year-end
- At the Independencia Sur block, validation drilling of the historic Fresnillo resource is progressing with additional rigs added to enable completion by year-end resource calculations. This block is immediately adjacent to existing infrastructure and outside the area of interest of the Franco-Nevada gold stream agreement. Multiple veins, including Bruno and Independencia Sur, as well as potential new zones, have been intersected. Assay results are as expected and the program exhibits potential to confirm the historic resources in this area
- At the Camuchin target located to the East, scout drilling has confirmed multiple veins spanning several kilometers, and assay results indicate veins are gold-rich, with good grades and narrow widths. Planning for a subsequent phase of the program in 2026 is underway
Other
- Approximately 49% of Palmarejo’s gold sales in the third quarter were sold under the gold stream agreement with Franco-Nevada at a price of $800 per ounce, totaling 13,228 ounces. The Company anticipates approximately 40% – 50% of Palmarejo’s 2025 gold sales will be sold under the gold stream agreement
Guidance
- The Company has increased Palmarejo’s 2025 gold and silver production guidance ranges and lowered the 2025 cost guidance ranges to reflect strong year-to-date performance and higher expected grades in the fourth quarter
- Full-year 2025 production is expected to be 96,000 – 106,000 ounces of gold (previously 95,000 – 105,000 ounces) and 6.0 – 6.8 million ounces of silver (previously 5.4 – 6.5 million ounces)
- Adjusted CAS1 in 2025 are expected to be $890 – $960 per gold ounce (previously $950 – $1,150 per gold ounce) and $15.00 – $16.00 per silver ounce (previously $17.00 – $18.00 per silver ounce)
- Capital expenditures are expected to be $26 – $32 million, consisting primarily of sustaining capital and underground development, which is unchanged from the previous guidance range
- Exploration investment in 2025 is expected to be $16 – $18 million (substantially all expensed), which is unchanged from the previous guidance range
Rochester, Nevada
| (Dollars in millions, except per ounce amounts) | 3Q 2025 | 2Q 2025 | 1Q 2025 | 4Q 2024 | 3Q 2024 | |||||||
| Ore tons placed | 8,306,272 | 7,851,665 | 6,987,324 | 8,226,820 | 7,064,623 | |||||||
| Average silver grade (oz/t) | 0.57 | 0.60 | 0.59 | 0.44 | 0.57 | |||||||
| Average gold grade (oz/t) | 0.002 | 0.003 | 0.003 | 0.003 | 0.002 | |||||||
| Silver ounces produced (000’s) | 1,644 | 1,456 | 1,284 | 1,551 | 1,155 | |||||||
| Gold ounces produced | 14,801 | 14,302 | 13,353 | 15,752 | 9,690 | |||||||
| Silver ounces sold (000’s) | 1,656 | 1,438 | 1,282 | 1,571 | 1,098 | |||||||
| Gold ounces sold | 13,975 | 13,881 | 14,713 | 14,824 | 9,186 | |||||||
| Average realized price per silver ounce | $ | 38.95 | $ | 33.88 | $ | 31.86 | $ | 30.97 | $ | 30.13 | ||
| Average realized price per gold ounce | $ | 3,431 | $ | 3,333 | $ | 2,840 | $ | 2,604 | $ | 2,492 | ||
| Metal sales | $ | 112.5 | $ | 95.0 | $ | 82.6 | $ | 87.2 | $ | 56.0 | ||
| Costs applicable to sales2 | $ | 52.0 | $ | 47.9 | $ | 48.5 | $ | 51.5 | $ | 39.4 | ||
| Adjusted CASper AgOz1 | $ | 17.73 | $ | 16.83 | $ | 18.41 | $ | 17.96 | $ | 20.88 | ||
| Adjusted CASper AuOz1 | $ | 1,585 | $ | 1,675 | $ | 1,670 | $ | 1,495 | $ | 1,735 | ||
| Prepayment, working capital cash flow | $ | — | $ | — | $ | (17.5 | ) | $ | — | $ | — | |
| Exploration expense | $ | 3.2 | $ | 1.2 | $ | 1.5 | $ | 2.7 | $ | 1.0 | ||
| Cash flow from operating activities | $ | 41.2 | $ | 39.6 | $ | (7.0 | ) | $ | 26.0 | $ | 3.2 | |
| Sustaining capital expenditures (excludes capital lease payments) | $ | 4.8 | $ | 20.7 | $ | 8.5 | $ | 10.4 | $ | 7.0 | ||
| Development capital expenditures | $ | 6.8 | $ | 3.8 | $ | 6.4 | $ | 3.5 | $ | 3.1 | ||
| Total capital expenditures | $ | 11.6 | $ | 24.5 | $ | 14.9 | $ | 13.9 | $ | 10.1 | ||
| Free cash flow1 | $ | 29.6 | $ | 15.1 | $ | (21.9 | ) | $ | 12.1 | $ | (6.9 | ) |
Operational
- Silver and gold production in the third quarter increased to 1.6 million and 14,801 ounces, respectively, compared to 1.5 million and 14,302 ounces in the prior period and 1.2 million and 9,690 ounces in the third quarter of 2024
- Ore tons placed during the quarter totaled 8.3 million tons, consisting of approximately 6.3 million tons through the crushing circuit, down from 6.7 million tons in the prior quarter largely due to planned downtime in July to complete several crusher upgrades. Additionally, the Company placed approximately 2.0 million tons of direct to pad (DTP) material, up from 1.1 million tons of DTP material placed in the prior quarter
Financial
- Third quarter adjusted CAS1 for silver and gold on a co-product basis totaled $17.73 and $1,585 per ounce
- Capital expenditures decreased to $12 million compared to $25 million in the prior period, driven mainly by capitalized stripping to offload material from the legacy Stage I and II leach pads
- Free cash flow1 in the third quarter totaled $30 million compared to $15 million in the prior period
Exploration
- Exploration investment in the third quarter totaled approximately $3 million substantially all expensed compared to roughly $4 million ($1 million expensed and $3 million capitalized) in the prior quarter
- One rig was active during the quarter conducting infill, expansion and condemnation drilling at Lincoln Hill. Most results are pending but visual review of core indicate mineralized veins in the expected locations
- Significant focus was placed on completion of geological models to support the Nevada Packard, Rochester and Lincoln Hill resource modelling for year end. This modeling is allowing us to make rapid strides in our understanding of the orebodies and this solid foundation is being used to support planning for district exploration in 2026
Guidance
- The Company has revised Rochester’s 2025 production and cost guidance ranges to reflect the cumulative effect of lower than planned tons placed under leach year-to-date due to crusher down time to complete a range of upgrades and the expected timing of these placed ounces
- Full-year 2025 production is expected to be 6.0 – 6.7 million ounces of silver (previously 7.0 – 8.3 million ounces) and 55,000 – 62,500 ounces of gold (previously 60,000 – 75,000 ounces)
- Adjusted CAS1 for 2025 are expected to be $17.00 – $18.50 per silver ounce (previously $14.50 – $16.50 per silver ounce) and $1,550 – $1,650 per gold ounce (previously $1,250 – $1,450 per gold ounce)
- Capital expenditures are expected to be $57 – $70 million, which is unchanged from the previous guidance range
- Exploration investment in 2025 is expected to be $13 – $16 million ($11 – $12 million expensed and $2 – $4 million capitalized), which is unchanged from the previous guidance range
Kensington, Alaska
| (Dollars in millions, except per ounce amounts) | 3Q 2025 | 2Q 2025 | 1Q 2025 | 4Q 2024 | 3Q 2024 | ||||||||||
| Tons milled | 188,705 | 192,169 | 185,344 | 183,639 | 165,916 | ||||||||||
| Average gold grade (oz/t) | 0.16 | 0.15 | 0.13 | 0.16 | 0.16 | ||||||||||
| Average recovery rate | 90.5 | % | 91.8 | % | 93.3 | % | 91.8 | % | 90.4 | % | |||||
| Gold ounces produced | 27,231 | 26,555 | 22,715 | 26,931 | 24,104 | ||||||||||
| Gold ounces sold | 28,011 | 26,751 | 22,205 | 25,839 | 24,800 | ||||||||||
| Average realized price per gold ounce, gross | $ | 3,588 | $ | 3,410 | $ | 2,990 | $ | 2,702 | $ | 2,563 | |||||
| Treatment and refining charges per gold ounce | $ | 56 | $ | 56 | $ | 53 | $ | 53 | $ | 56 | |||||
| Average realized price per gold ounce, net | $ | 3,532 | $ | 3,354 | $ | 2,937 | $ | 2,649 | $ | 2,507 | |||||
| Metal sales | $ | 98.9 | $ | 89.8 | $ | 65.2 | $ | 68.3 | $ | 62.2 | |||||
| Costs applicable to sales2 | $ | 46.7 | $ | 46.1 | $ | 42.2 | $ | 39.7 | $ | 38.1 | |||||
| Adjusted CAS per AuOz1 | $ | 1,659 | $ | 1,713 | $ | 1,882 | $ | 1,529 | $ | 1,539 | |||||
| Prepayment, working capital cash flow | $ | — | $ | — | $ | (12.1 | ) | $ | (12.9 | ) | $ | 11.8 | |||
| Exploration expense | $ | 2.2 | $ | 1.5 | $ | 3.3 | $ | 0.7 | $ | 2.0 | |||||
| Cash flow from operating activities | $ | 46.4 | $ | 36.0 | $ | 5.9 | $ | 8.5 | $ | 38.1 | |||||
| Sustaining capital expenditures (excludes capital lease payments) | $ | 9.4 | $ | 12.3 | $ | 15.2 | $ | 18.9 | $ | 20.0 | |||||
| Development capital expenditures | $ | 6.2 | $ | 4.0 | $ | 0.3 | $ | — | $ | — | |||||
| Total capital expenditures | $ | 15.6 | $ | 16.3 | $ | 15.5 | $ | 18.9 | $ | 20.0 | |||||
| Free cash flow1 | $ | 30.8 | $ | 19.7 | $ | (9.6 | ) | $ | (10.4 | ) | $ | 18.1 |
Operational
- Gold production in the third quarter increased to 27,231 ounces compared to 26,555 ounces in the prior period and 24,104 ounces in the third quarter of 2024
- Stronger production during the quarter was driven by higher average gold grade partially offset by a decrease in mill throughput
Financial
- Third quarter adjusted CAS1 decreased to $1,659 per ounce compared to $1,713 per ounce in the prior period, due primarily to increased metal sales
- Capital expenditures increased 4% quarter-over-quarter to $16 million. The second quarter marked the end of the multi-year underground mine development program at Kensington
- Free cash flow1 in the third quarter increased to $31 million, reflecting increased metals sales
Exploration
- Exploration investment in the third quarter totaled approximately $4 million ($2 million expensed and $2 million capitalized), compared to $5 million ($2 million expensed and $3 million capitalized) in the prior period
- Programs in Upper Kensington (expansion and infill drilling at Zones 30 and 30B) were completed during the quarter with excellent results received. Drilling is continuing in Lower Kensington with most results pending but exhibiting highly encouraging visual results
- At Elmira, drilling is progressing well, with over 95% of the drillholes intersecting mineralization as predicted by the geology model. Results are as expected, supporting the potential for positive contributions to year end resource and reserve calculations
- Drilling at the Johnson target, located 150 meters to the east of Elmira was not in the original budget for 2025 but excellent 2024 results received in the first quarter warranted follow-up this year
Guidance
- The Company has increased Kensington’s 2025 gold production guidance range and narrowed its cost guidance range to reflect strong year-to-date performance and higher expected mining face availability in the fourth quarter as a result of the Company’s recently completed multi-year investment in underground development
- Full-year 2025 production is expected to be 98,500 – 108,500 gold ounces (previously 92,500 – 107,500 ounces)
- Adjusted CAS1 in 2025 are expected to be $1,700 – $1,800 per gold ounce (previously $1,700 – $1,900 per ounce)
- Capital expenditures are expected to be $55 – $64 million, which are unchanged from the previous guidance range
- Exploration investment in 2025 is expected to be $11 – $14 million ($6 – $8 million expensed and $5 – $6 million capitalized), which are unchanged from the previous guidance range
Wharf, South Dakota
| (Dollars in millions, except per ounce amounts) | 3Q 2025 | 2Q 2025 | 1Q 2025 | 4Q 2024 | 3Q 2024 | ||||||
| Ore tons placed | 1,345,662 | 1,105,605 | 1,033,699 | 1,164,894 | 1,424,649 | ||||||
| Average gold grade (oz/t) | 0.028 | 0.035 | 0.020 | 0.023 | 0.046 | ||||||
| Gold ounces produced | 27,990 | 24,087 | 20,491 | 21,976 | 33,650 | ||||||
| Silver ounces produced (000’s) | 25 | 36 | 51 | 54 | 42 | ||||||
| Gold ounces sold | 27,859 | 23,509 | 20,078 | 22,539 | 34,272 | ||||||
| Silver ounces sold (000’s) | 22 | 35 | 50 | 54 | 45 | ||||||
| Average realized price per gold ounce | $ | 3,412 | $ | 3,315 | $ | 2,827 | $ | 2,620 | $ | 2,440 | |
| Metal sales | $ | 95.9 | $ | 79.1 | $ | 58.4 | $ | 60.7 | $ | 85.0 | |
| Costs applicable to sales2 | $ | 30.9 | $ | 29.0 | $ | 27.0 | $ | 22.1 | $ | 31.8 | |
| Adjusted CAS per AuOz1 | $ | 1,079 | $ | 1,175 | $ | 1,260 | $ | 902 | $ | 885 | |
| Prepayment, working capital cash flow | $ | — | $ | — | $ | (12.5 | ) | $ | — | $ | — |
| Exploration expense | $ | 0.7 | $ | 3.5 | $ | 2.6 | $ | 2.7 | $ | 2.3 | |
| Cash flow from operating activities | $ | 57.2 | $ | 41.4 | $ | 15.7 | $ | 22.2 | $ | 51.6 | |
| Sustaining capital expenditures (excludes capital lease payments) | $ | 1.2 | $ | 2.3 | $ | 6.4 | $ | 2.9 | $ | 2.8 | |
| Development capital expenditures | $ | 2.0 | $ | 1.3 | $ | 1.0 | $ | — | $ | — | |
| Total capital expenditures | $ | 3.2 | $ | 3.6 | $ | 7.4 | $ | 2.9 | $ | 2.8 | |
| Free cash flow1 | $ | 54.0 | $ | 37.8 | $ | 8.3 | $ | 19.3 | $ | 48.8 |
Operational
- Gold production in the third quarter increased 16% quarter-over-quarter to 27,990 ounces, driven by higher gold grades
Financial
- Adjusted CAS1 on a by-product basis decreased 8% quarter-over-quarter to $1,079 per ounce, due primarily to higher gold sales
- Capital expenditures totaled approximately $3 million compared to $4 million in the prior period
- Free cash flow1 in the third quarter increased to $54 million compared to $38 million in the prior period
Exploration
- Exploration investment during the third quarter totaled $3 million (substantially all expensed), compared to $4 million (substantially all expensed) in the prior quarter
- All drilling in the quarter was focused on the Juno deposit, following up on 2024 expansion drilling, which extended mineralization approximately 500 feet to the northwest. This program was completed at the end of August
- Results from all programs support a meaningful expected contribution to year-end reserve and resource estimates
Guidance
- The Company has increased Wharf’s 2025 gold and silver production guidance ranges to reflect strong year-to-date performance and higher expected grades in the fourth quarter
- Full-year 2025 production is expected to be 93,000 – 103,000 gold ounces (previously 90,000 – 100,000 ounces) and 100,000 – 150,000 ounces of silver (previously 50,000 – 200,000 ounces)
- Adjusted CAS1 in 2025 are expected to be $1,125 – $1,225 per gold ounce (previously $1,250 – $1,350 per ounce)
- Capital expenditures are expected to be $13 – $17 million, which is unchanged from the previous guidance range
- Exploration investment in 2025 is expected to be $7 – $10 million (substantially all expensed), which is unchanged from the previous guidance range
Exploration
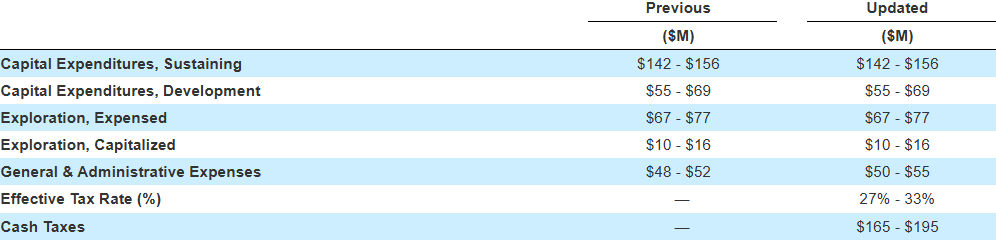
The Company’s exploration investment in 2025 is expected to total $67 – $77 million for expansion drilling (classified as exploration expense) and $10 – $16 million for infill drilling (capitalized exploration) for a total expected investment of $77 – $93 million.
Top exploration priorities for 2025 are: (1) continuing to build the inferred pipeline at Palmarejo to provide optionality to the operation, including to the east of existing operations outside the Franco-Nevada gold stream area of interest, where 60% of this year’s exploration investment is budgeted; (2) outlining higher-grade structures to enhance near-term margins and longer-term free cash flow profile of Rochester; (3) maintaining a 5-year reserve-based mine life at Kensington while finding higher-grade zones to enhance cash flow; (4) completing the expansion and infill programs at Wharf to add to the life of mine; (5) building on the new geological model and understanding at Silvertip to grow the resource base, and; (6) rapidly building detailed knowledge of Las Chispas and maintaining mine life.
During the third quarter, Coeur invested approximately $30 million ($25 million expensed and $5 million capitalized), compared to roughly $30 million ($23 million expensed and $7 million capitalized) in the prior period.
At Silvertip, exploration investment totaled approximately $10 million in the third quarter, compared to $9 million in the prior period, with up to five rigs drilling across the property. During the third quarter, drilling focused on a number of targets in the Southern Silver, Discovery, Camp Creek and Saddle Zones, using one underground rig and four surface rigs. Drilling was also undertaken over the Silverknife Property which is under option agreement. In addition to drilling a comprehensive regional program of geological mapping, rock chip sampling, stream and soil geochemical surveys and a LiDAR survey was completed. Results are mostly pending but core review indicates highly encouraging visual results.
2025 Guidance
The Company has refined its 2025 production and cost guidance ranges as reflected below.
2025 Production Guidance
2025 Adjusted Costs Applicable to Sales Guidance
2025 Capital, Exploration, G&A and Income and Mining Tax Guidance
Note: The Company’s previous guidance figures assume estimated prices of $2,700/oz gold and $30.00/oz silver as well as CAD of 1.425 and MXN of 20.50. Guidance figures exclude the impact of any metal sales or foreign exchange hedges.
The Company’s updated guidance figures assume estimated prices of $3,411/oz gold and $37.82/oz silver as well as CAD of 1.38 and MXN of 20.0. Guidance figures exclude the impact of any metal sales or foreign exchange hedges.
On August 6, 2025, the Company increased its 2025 general & administrative expense guidance to reflect the non-cash increase in incentive compensation related to expected performance share expense.
The normalized effective tax rate excludes items that are not reflective of Coeur’s underlying performance, such as the impacts of foreign currency on deferred taxes, taxes related to prior periods, and one-time, non-cash, tax valuation allowance adjustments.
Financial Results and Conference Call
Coeur will host a conference call to discuss its third quarter 2025 financial results on October 30, 2025 at 11:00 a.m. Eastern Time.
| Dial-In Numbers: | (855) 560-2581 (U.S.) | |
| (855) 669-9657 (Canada) | ||
| (412) 542-4166 (International) | ||
| Conference ID: | Coeur Mining |
Hosting the call will be Mitchell J. Krebs, Chairman, President and Chief Executive Officer of Coeur, who will be joined by Thomas S. Whelan, Senior Vice President and Chief Financial Officer, Michael “Mick” Routledge, Senior Vice President and Chief Operating Officer, Aoife McGrath, Senior Vice President, Exploration, and other members of management. A replay of the call will be available through November 6, 2025.
| Replay numbers: | (877) 344-7529 (U.S.) | |
| (855) 669-9658 (Canada) | ||
| (412) 317-0088 (International) | ||
| Conference ID: | 144 51 57 |
About Coeur
Coeur Mining, Inc. is a U.S.-based, well-diversified, growing precious metals producer with five wholly-owned operations: the Las Chispas silver-gold mine in Sonora, Mexico, the Palmarejo gold-silver complex in Chihuahua, Mexico, the Rochester silver-gold mine in Nevada, the Kensington gold mine in Alaska and the Wharf gold mine in South Dakota. In addition, the Company wholly-owns the Silvertip polymetallic critical minerals exploration project in British Columbia.
Cautionary Statements
This news release contains forward-looking statements within the meaning of securities legislation in the United States and Canada, including statements regarding EBITDA, cash flow, production, costs, capital expenditures, tax rates and treatment, exploration and development efforts and plans and potential impacts on reserves and resources, mine lives and expected extensions, the gold stream agreement at Palmarejo, anticipated production, and costs and expenses and operations at Las Chispas, Palmarejo, Rochester, Kensington and Wharf. Such forward-looking statements involve known and unknown risks, uncertainties and other factors which may cause Coeur’s actual results, performance or achievements to be materially different from any future results, performance or achievements expressed or implied by the forward-looking statements. Such factors include, among others, the risk that anticipated production, cost and expense levels are not attained, the risks and hazards inherent in the mining business (including risks inherent in developing and expanding large-scale mining projects, environmental hazards, industrial accidents, weather or geologically-related conditions), changes in the market prices of gold and silver and a sustained lower price or higher treatment and refining charge environment, the uncertainties inherent in Coeur’s production, exploration and development activities, including risks relating to permitting and regulatory delays (including the impact of government shutdowns) and mining law changes, ground conditions, grade and recovery variability, any future labor disputes or work stoppages (involving the Company and its subsidiaries or third parties), the risk of adverse outcomes in litigation, the uncertainties inherent in the estimation of mineral reserves and resources, impacts from Coeur’s future acquisition of new mining properties or businesses, risks associated with the continued integration of the Las Chispas mine after the recent acquisition of SilverCrest Metals, Inc., the risk that the Rochester expansion does not sustain planned performance, the loss of access or insolvency of any third-party refiner or smelter to whom Coeur markets its production, materials and equipment availability, inflationary pressures, changes in applicable tax laws or regulatory interpretations, impacts from tariffs or other trade barriers, continued access to financing sources, the effects of environmental and other governmental regulations and government shut-downs, the risks inherent in the ownership or operation of or investment in mining properties or businesses in foreign countries, Coeur’s ability to raise additional financing necessary to conduct its business, make payments or refinance its debt, as well as other uncertainties and risk factors set out in filings made from time to time with the United States Securities and Exchange Commission, and the Canadian securities regulators, including, without limitation, Coeur’s most recent reports on Form 10-K and Form 10-Q. Actual results, developments and timetables could vary significantly from the estimates presented. Readers are cautioned not to put undue reliance on forward-looking statements. Coeur disclaims any intent or obligation to update publicly such forward-looking statements, whether as a result of new information, future events or otherwise. Additionally, Coeur undertakes no obligation to comment on analyses, expectations or statements made by third parties in respect of Coeur, its financial or operating results or its securities. This does not constitute an offer of any securities for sale.
The scientific and technical information concerning our mineral projects in this news release have been reviewed and approved by a “qualified person” under Item 1300 of SEC Regulation S-K, namely our Vice President, Technical Services, Christopher Pascoe. For a description of the key assumptions, parameters and methods used to estimate mineral reserves and mineral resources, as well as data verification procedures and a general discussion of the extent to which the estimates may be affected by any known environmental, permitting, legal, title, taxation, sociopolitical, marketing or other relevant factors, please review the Technical Report Summaries for each of the Company’s material properties which are available at www.sec.gov.
Non-U.S. GAAP Measures
We supplement the reporting of our financial information determined under United States generally accepted accounting principles (U.S. GAAP) with certain non-U.S. GAAP financial measures, including EBITDA, adjusted EBITDA, adjusted EBITDA margin, free cash flow, adjusted net income (loss), operating cash flow before changes in working capital and adjusted costs applicable to sales per ounce. We believe that these adjusted measures provide meaningful information to assist management, investors and analysts in understanding our financial results and assessing our prospects for future performance. We believe these adjusted financial measures are important indicators of our recurring operations because they exclude items that may not be indicative of, or are unrelated to our core operating results, and provide a better baseline for analyzing trends in our underlying businesses. We believe EBITDA, adjusted EBITDA, adjusted EBITDA margin, free cash flow, adjusted net income (loss) and adjusted costs applicable to sales per ounce are important measures in assessing the Company’s overall financial performance. For additional explanation regarding our use of non-U.S. GAAP financial measures, please refer to our Form 10-K for the year ended December 31, 2024.
Contacts
For Additional Information
Coeur Mining, Inc.
200 S. Wacker Drive, Suite 2100
Chicago, IL 60606
Attention: Jeff Wilhoit, Senior Director, Investor Relations
Phone: (312) 489-5800
www.coeur.com
Original Article: https://www.businesswire.com/news/home/20251029580124/en/Coeur-Reports-Third-Quarter-2025-Results


